Computed Tomography of the Heart: Introduction
Computed tomography (CT) is a technique that can fully evaluate both cardiac structure and function. Recent advances in imaging allow for evaluation of not only relatively stationary anatomy, such as the thoracic aorta, but also rapidly moving structures, such as the myocardium and coronary arteries. This imparts the ability to noninvasively evaluate for significant coronary artery disease (CAD), myocardial and pericardial abnormalities, and aortic pathology. When combined with electrocardiographic (ECG) gating, freeze-frame images of the heart can be obtained, obviating most of the motion artifact. This is particularly important in contrast-enhanced CT angiography of the coronary arteries and quantifying coronary artery calcium. The advances in spatial and temporal resolution and image reconstruction software have also helped in the evaluation of cardiac structures including coronary veins, saphenous vein grafts, atria, ventricles, and pulmonary arteries and veins with precise definition of their spatial relationships for the comprehensive assessment of a variety of cardiovascular disease processes. This chapter details the current and future role of cardiac CT for the assessment of cardiovascular physiology and pathology.
Technical Considerations
Advancements in CT technology have made it possible to noninvasively image the beating heart. Multidetector CT (MDCT) scanners produce images by rotating an x-ray tube around a circular gantry through which the patient advances on a moving table. Improvements in gantry rotation speeds and the development of partial reconstruction algorithms have reduced effective single-image acquisition time to <200 ms. The coronary arteries move independently throughout the cardiac cycle and even at slow heart rates exhibit significant translational motion of up to 60 mm/s for the right coronary artery (RCA) and 20 to 40 mm/s for the left anterior descending (LAD) and circumflex coronary arteries (Fig. 22–1).1,2 Image acquisition <50 ms is truly required to completely avoid cardiac motion artifacts.1,3
FIGURE 22–1.
Coronary artery velocity varies substantially throughout the cardiac cycle, depending on whether the heart rate is relatively slow (72 beats/min) (A) or fast (89 beats/min) (B). The greatest motion occurs in the right coronary artery (RCA), followed by the left circumflex (LCX) and left anterior descending (LAD) coronary arteries. A. A biphasic pattern of rest is found during end-systole (at 40%-50% of the R-R interval) and mid-diastole (at 70%-80% of the R-R interval). B. A monophasic rest period pattern was found near end-systole (at 40%-60% of the R-R interval). Reproduced with permission from Lu et al.1
With MDCT systems, temporal resolution may be further improved by selecting specific partial image sector data from different heartbeats and detector rings to reconstruct a complete 240-degree image data set. With retrospective gating, several thousand images can be acquired during a single cardiac study, allowing one to pick and choose images with the least amount of motion-related distortion prior to final image reconstruction.
The typical radiation exposure from an electron-beam CT (EBCT) study is <1.0 rad,4 whereas MDCT scanners using retrospective gating can increase exposure approximately 13-fold.5 Prospective gating during either spiral or nonspiral acquisitions uses ECG-gated image triggering only at specific temporal locations in the cardiac cycle, thereby significantly reducing radiation exposure to <3 mSv, with reports as low as <1 mSv. Gating works relatively well at slow heart rates (ie, <60 beats/min), where the R-R interval is >1000 ms and the fastest imaging protocols are used. However, at faster heart rates, a 200-ms acquisition effectively covers most of the cardiac cycle, thus obviating any potential benefit from gating the image acquisition.
EBCT uses an electron beam (current 630 mA, voltage 130 kV) that is deflected via a magnetic coil and focused to strike a series of four tungsten targets located beneath the patient (Fig. 22–2). The electron beam is magnetically swept along the tungsten targets at a 210-degree arc, and each target ring is separated by a 4-mm distance. The resultant x-rays generated beneath the patient are then attenuated as they pass through the thorax and recorded by a series of two twin fixed detector arrays arranged in a semicircle above the patient. Because EBCT has no moving parts, as found in conventional and MDCT scanners, imaging time is complete within 50 ms, which is the time required for the electron beam to sweep along the tungsten targets. With a 100-ms acquisition time, a freeze-frame image of the myocardium and coronary arteries in end-diastole can be achieved with minimal motion artifact.
EBCT is commonly operated using three different acquisition modes. The cine mode creates real-time, cross-sectional views of the beating heart and is commonly used to assess both global and regional right and left ventricular function (Fig. 22–3). The volume mode allows acquisition of a single image with each preselected movement of the patient table. Up to 40 continuous slices can be obtained scanning 12 to 32 cm of anatomy, depending on the couch speed selected (Fig. 22–4). This imaging mode is commonly gated to the ECG to obtain high-resolution static images for detailed evaluation of cardiovascular anatomy, such as coronary artery calcification (CAC). The triggered (flow) mode is used to assess blood flow through specific cardiac chambers and the myocardium itself. This mode allows acquisition of 20 to 40 consecutive scans where imaging occurs at a designated time during each cardiac cycle. From these consecutive scans, time-density curves can be constructed, which can estimate blood flow through specific cardiac chambers and within the myocardium.
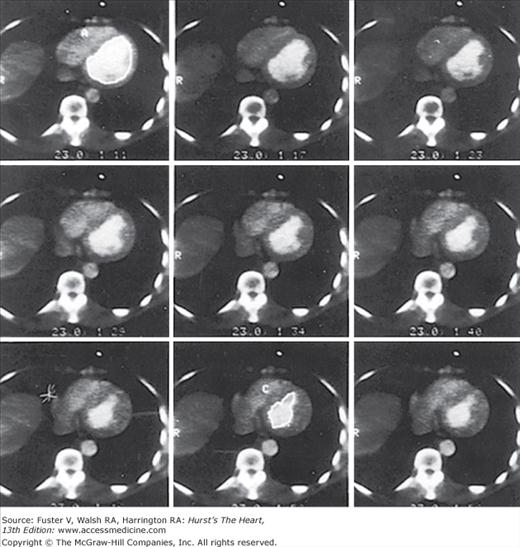
FIGURE 22–4.
Fifty-millisecond contrast-enhanced electron-beam computed tomography (EBCT) images gated to end-diastole include the left ventricle from base (top left) to apex (bottom right). Reproduced with permission from Brundage BH, Chomka E. Evaluation of acute myocardial infarction by computed tomography. In: Brundage BH, ed. Comparative Cardiac Imaging. Rockville, MD: Aspen;1990:223-229.
Evaluation of Myocardial Function
Right and left ventricles are equally well visualized by contrast cardiac CT angiography (CCTA). The combination of ECG gating and image postprocessing permits the reconstruction of multiple data sets at predetermined percentages of the R-R interval throughout the entire cardiac cycle (Fig. 22–5). This multiphase image reconstruction can be displayed in cine mode as in echocardiography or cardiac magnetic resonance (CMR) imaging. Therefore, end-systolic and end-diastolic images can be obtained to assess ventricular volumes and function (see Fig. 22–5).
FIGURE 22–5.
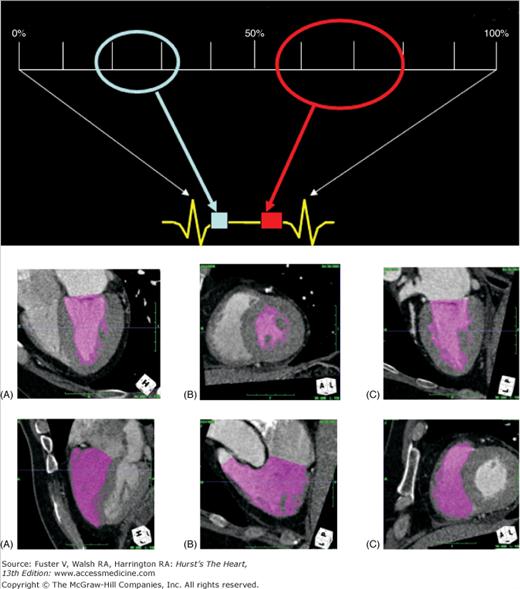
Evaluation of cardiac function. Upper panel: A diagram showing the division of the cardiac cycle into 10% intervals. The two ovals cover the two regions of the cardiac cycle where the motions are the most still. The light blue oval covers the mid- to end-systolic phase, and the red oval covers the mid- to end-diastolic phase. Middle panel: Images generated by an automatic contrast and contour detection software for quantitative functional evaluation. The three views are four chamber (A), short axis (B), and two chamber (C) of the left ventricle. Lower panel: Images generated by the same software for right ventricular ejection fraction calculation. The three views are four chamber (A), right ventricle outflow (B), and short axis (C).
Both ventricles are well visualized by MDCT and EBCT, allowing excellent spatial separation between the two structures. Delineation of the epicardial and endocardial surfaces allows accurate and reproducible measurement of left ventricular (LV) and right ventricular (RV) wall thickness and myocardial mass.6 LV hypertrophy can be quantified and serially assessed.
Cardiac CT can assess left and right heart hemodynamics as well as regional myocardial wall motion and thickening.7,8 The cine mode is used to acquire multiple gated images of the RV and LV during maximal contrast enhancement (see Fig. 22–5).8 This affords accurate and reproducible quantification of LV and RV end-diastolic and end-systolic volumes for the calculation of ejection fraction (EF).8 Cardiac CT is comparable to first-pass radionuclide angiography for the calculation of LV ejection fraction (LVEF) in patients with myocardial infarction (MI).9
Both MDCT and EBCT allow precise measurements of the LV volumes and overall function, which have a close correlation with echocardiography.6,10-13 When compared with CMR, the current gold standard for cardiac functional evaluation, MDCT is an adequate alternative.12 Furthermore, MDCT and EBCT are also valuable tools in estimating LV wall thickness, mass, and segmental wall motion and demonstrate good overall agreement with echocardiography and CMR.6,11-13
Ventricular remodeling can be assessed by CT in a method similar to gated blood-pool radionuclide angiography and echocardiography. CT angiography (CTA) can identify wall thinning and impaired LV thickening in an area of previous MI and delineate anterior and posterior LV aneurysms and associated mural thrombus (Fig. 22–6).6,14
RV volume and functional assessment by MDCT is feasible and has good correlation with both radionuclide ventriculography and CMR.6,11 Typically, the RV is not well opacified during the routine image acquisition of a coronary CTA because the timing of contrast injection and the bolus chase with normal saline is aimed at the optimal opacification of the left heart and the coronary arteries (Fig. 22–7).
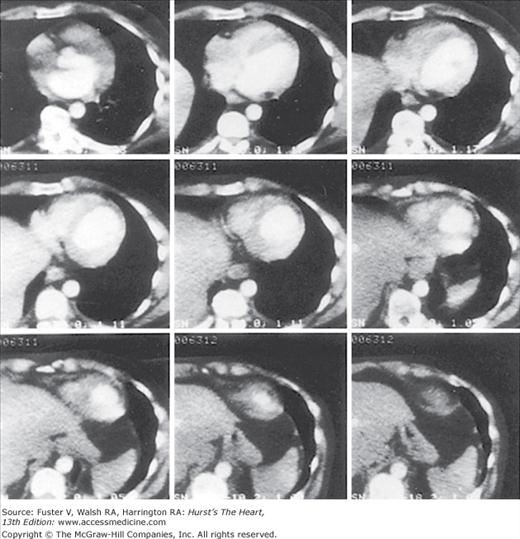
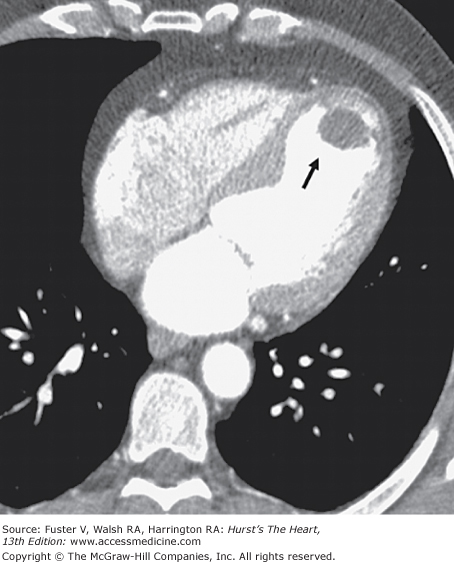
FIGURE 22–7.

Evaluation of the right ventricular (RV) function. A. Maximum intensity projection (MIP) image of a four-chamber view of a heart. The study was performed with normal saline chaser. No contrast enhancement is noted in the RV, allowing optimal evaluation of the right coronary artery (RCA), intracardiac shunts, and atrial septal aneurysm (as shown in this case). B. MIP image of a four-chamber view of a heart. This study was performed without saline chaser, and the timing of the study was suboptimal for the assessment of the left heart and coronary arteries. Overenhancement of the RV with contrast leads to difficulty in the assessment of the RCA. There is also significant beam-hardening artifact from the sternal wire.
Hyperenhancement of the RV with contrast could adversely affect the visualization of the RCA (see Fig. 22–7). A 65- to 80-mL bolus of contrast is typically used, followed by a 50-mL mix of contrast and normal saline, usually in a ratio of 30:70, respectively, and then a 50-mL normal saline chaser. This protocol offers adequate opacification of the RV and the interventricular septum for determination of RV function and LV mass. Dense coronary calcification can interfere with the CT evaluation of the native coronary artery (Fig. 22–8).


Stress-rest EBCT imaging can detect underlying ischemic heart disease based on changes in global LVEF and regional wall motion. One small study compared semisupine bicycle exercise contrast-enhanced EBCT to technetium 99m (99mTc) single-photon emission CT (SPECT) of the myocardium in patients with suspected CAD.8 Coronary angiography was used as the gold standard. An abnormal EBCT study was defined as <5% increase in LVEF during exercise. Regional LVEF was assessed by computer analysis of end-diastolic and end-systolic images. The sensitivity and specificity of exercise EBCT for detecting CAD were 81% and 76%, respectively, when the global LVEF criteria for abnormalcy were used. However, these percentages improved to 88% and 100% when regional wall motion abnormalities were considered. EBCT was as accurate as 99mTc SPECT in the diagnosis of CAD.
When valvular surgery is considered, CT can delineate the important parameters of LV chamber size, wall thickness, and LVEF.6,14 Congestive heart failure or left atrial enlargement can be complicated by left atrial thrombi. One study showed greater accuracy of EBCT compared with transthoracic echocardiography in demonstrating such atrial thrombi (Fig. 22–9).15 Whether CT can detect thrombi as well as transesophageal echocardiography remains to be determined because only limited studies are currently available. However, the superior spatial resolution of CT should allow visualization of thrombi with high accuracy.
For cardiac functional assessment, EBCT was shown to provide a highly accurate EF (±1%), with 50-ms image acquisition per image. Retrospective ECG gating allows for image reconstruction in any phase of the cardiac cycle. Thus, end-systolic and end-diastolic images can be produced to assess ventricular volumes and function. Despite lower temporal resolution than EBCT, MDCT preserves the ability to assess EF. Functional parameters by MDCT have shown good agreement with findings on echocardiography, cine ventriculography, SPECT, and magnetic resonance imaging (MRI).6 The technical development of scanner hardware along with multisegmental image reconstruction has led to rapid improvement in spatial and temporal resolution and significantly faster cardiac scans. Although the same data acquired for MDCT angiography can be used for evaluation of cardiac function, MDCT is not a first-line imaging tool for this application unless images from echocardiography are of poor quality or CMR is contraindicated. MDCT is limited by its radiation exposure; however, one study showed a good correlation of LV volumes and function between MDCT and CMR.10 Furthermore, the results from MDCT were better than from echocardiography. Considering the contrast media load, radiation exposure, and limited temporal resolution, MDCT solely for analysis of cardiac function parameters does not seem reasonable at the present time. However, because the data are already obtained during a coronary evaluation, the combination of coronary artery imaging and assessment of cardiac function with MDCT frequently adds clinically useful information.
Coronary Artery Calcification
The standard EBCT imaging protocol is to acquire 40 consecutive 3-mm-thick images at a rate of 100 ms per image from the base of the heart to just below the carina. Images are obtained at end-inspiration, with ECG triggering typically at 80% of the R-R interval (end-diastole). Image pixel size using a 512 × 512 reconstruction matrix is 0.26 or 0.34 mm2 based on a 26- or 30-cm field of vision, respectively.
A calcified lesion is generally defined as either two or three adjacent pixels (0.68-1.02 mm2 for a 512 × 512 reconstruction matrix and camera field size of 30 cm) of >130 Hounsfield units (HU). Using the traditional Agatston method, each calcified lesion is multiplied by a density factor as follows: 1 for lesions with a maximal density between 130 and 199 HU; 2 for lesions between 200 and 299 HU; 3 for lesions between 300 and 399 HU; and 4 for lesions >400 HU. The total coronary artery calcium score (CACS) is calculated as the sum of each calcified lesion in the four main coronary arteries over all the consecutive tomographic slices. The EBCT-derived CACS correlates well with calcified areas found in individual coronary arteries as determined by histomorphometric measurements (r = 0.96).16
MDCT imaging protocols vary among different camera systems and manufacturers. Generally 40 consecutive 2.5- to 3-mm-thick images are acquired per cardiac study. Calcified lesions are defined as two or three adjacent pixels with a tomographic density of either >90 or >130 HU. Effective pixel size for a reconstruction matrix of 512 × 512 pixels with a common field of view of 26 cm is 0.26 mm2. Calcium scoring is usually based on the traditional Agatston method (ie, initial density of >130 HU). As with EBCT scoring, the total CACS is calculated as the sum of each calcified plaque over all the tomographic slices.
The comparability of MDCT- and EBCT-derived CACSs has been explored in separate studies involving approximately 400 patients (Table 22–1).17-19 The MDCT protocols vary considerably in these studies, ranging from conventional CT to single-slice CT (with either retrospective or prospective gating) to MDCT. EBCT imaging was performed using the standard protocol conventionally used in routine clinical practice. Coronary calcification was defined as >130 HU for EBCT but varied from 90 to 130 HU for MDCT. Although high correlation coefficients were reported between EBCT and MDCT CACS, there was significant variability in individual CACS results (range, 17%-84%).
| Authors | Year | Number of Patients | Age (years) | Average Ca2+ Score | Mechanical CT Technique | Gating | Number of Detectors | Correlation Coefficient | Mean % Difference |
|---|---|---|---|---|---|---|---|---|---|
| Budoff et al17 | 2001 | 33 | 54 | 52 | Nonspiral | No | Single | 0.68 | 84% |
| Becker et al36 | 2000 | 50 | 62 | — | Nonspiral | Prosp | Single | 0.98 | 25% |
| Carr et al37 | 2000 | 36 | 68 | 432 | Spiral | Retrosp | Single | 0.96 | 17% |
| Goldin et al38 | 2001 | 70 | 48 | 70 | Spiral | Retrosp | Single | NA | 28% |
| Becker et a l18 | 2001 | 88 | 63 | 793 | Spiral | Prosp | 4 | 0.99 | 32% |
| Knez et al20 | 2002 | 99 | 60 | 722 | Spiral | Prosp | 4 | 0.99 | 17% |
| Budoff et al39 | 2009 | 100 | 61 | 351 | MDCT | Prosp | 64 | 0.99 | 17% |
A study by Knez and coworkers20 compared MDCT with EBCT using prospective ECG gating for both techniques. The CACS was calculated using the volumetric (rather than the Agatston) calcium scoring method. Variability in CACS between the two techniques ranged from 20% (CACS <100) to 15% (CACS >100), with a mean variability of 17%. Further research is still needed to determine which MDCT technique, imaging protocol, calcium criterion, and scoring system best approximate the values determined by EBCT, especially with the new 64-detector systems. A recent study by Cademartiri and colleagues21 found that CACS proved inadequate for the detection of obstructive and nonobstructive CAD, compared with coronary CTA, when invasive coronary angiography was used as the reference in high-risk asymptomatic patients with equivocal stress test results.
The most recent study between EBCT and 64-slice MDCT demonstrated that the interscan agreement for the presence of CAC was 99%.19 There was a significant linear relationship between the scores from the two scanners, and the interscanner variability between EBCT and 64-slice MDCT was not significantly different. Bland-Altman analysis demonstrated a mean difference in scores of 8.3% for Agatston and 7.8% by volumetric calcium scoring. When compared with EBCT, there were larger and more prevalent motion artifacts and larger mean Hounsfield units using 64-slice MDCT (P < .001). In this study, 64-slice MDCT and EBCT were comparable in Agatston and volumetric CAC scanning. The interscan variability between scanners is similar to interscan variability of two calcium scores done on the same equipment. However, heart rate control was achieved for this study for calcium scores. Whether these results are repeatable without heart rate control needs to be further assessed.
The presence of CAC is clearly indicative of coronary atherosclerosis.22,23 Furthermore, the CAC severity, as assessed by EBCT, is directly related to the total atherosclerotic plaque burden present in the epicardial coronary arteries.22,23 Coronary calcification is thought to begin early in life, but it progresses more rapidly in older individuals who have further advanced atherosclerotic lesions.24 Calcification is an active, organized, and regulated process occurring during atherosclerotic plaque development where calcium phosphate in the form of hydroxyapatite precipitates in atherosclerotic coronary arteries in a similar fashion as observed in bone mineralization.25-27 Although lack of calcification does not categorically exclude the presence of atherosclerotic plaque, calcification occurs exclusively in atherosclerotic arteries and is not found in normal coronary arteries.
The presence and extent of histologically determined plaque area has been compared with the total calcium area as assessed by EBCT in individual coronary arteries derived from autopsied hearts.22 A strong linear correlation exists between total coronary artery plaque area and the extent of CAC as found in individual hearts (r = 0.93, P < .001) and in individual coronary arteries (r = 0.90, P < .001) (Fig. 22–10). However, the total calcium area underestimates total plaque area, with approximately five times as many noncalcified as calcified plaques.22
FIGURE 22–10.

Comparison of the square root sum of total coronary calcium area (millimeters) by electron-beam computed tomography (EBCT) with actual atherosclerotic plaque area (millimeters) for 38 individual coronary arteries. The linear regression line and 95% confidence intervals are shown. Reproduced with permission from Rumberger et al.22
Numerous studies have indicated that there is a correlation between the CACS and the number and severity of conventional CAD risk factors, but CAC is also an independent marker for future coronary events after adjustment for CAD risk factors.28-34
Significant coronary artery stenosis (>50%) by angiography is frequently associated with the presence of coronary artery calcium as assessed by EBCT. However, the severity of angiographic coronary artery stenosis is not directly related to the total CAC. A recent study compared calcium extent with coronary artery luminal diameter stenosis determined by morphologic examination of 723 coronary artery segments.23 Although coronary stenosis severity increased with increasing CAC, this relationship was poor and could not be used to estimate angiographic stenosis severity on a segment-by-segment basis (Fig. 22–11). One explanation is that coronary artery remodeling occurs with increasing plaque burden so as to maintain luminal diameter and arterial patency.35 Although the extent of coronary calcification does not precisely predict stenosis severity, noncalcified plaques are frequently associated with <50% diameter stenosis and typically <20% stenosis.23 These data indicate that lack of coronary calcification predicts a low likelihood of obstructive CAD.
Multiple clinical angiographic trials confirm the relationship between CAC severity and the presence of significant (≥50%) CAD.40-49 Although the diagnostic accuracy of EBCT improves with age, most patients younger than 50 years with obstructive CAD also have coronary calcification (85%).41,43 There are at least 15 studies comparing EBCT with coronary angiography in which obstructive CAD was defined as >50% luminal diameter stenosis (Table 22–2). In these studies, the overall sensitivity and specificity for detecting obstructive CAD were 97% and 39%, respectively. In the largest series, Haberl and colleagues49 performed EBCT within 30 days of coronary angiography in 1764 patients who had suspected CAD. Only 5 of 940 patients (0.5%) with significant (≥50%) coronary artery stenosis had a normal EBCT, and 4 of these patients were younger than 45 years of age. Although differences in CAC were noted among men and women, EBCT predicted CAD equally well in both sexes, based on age-specific CACS thresholds (Fig. 22–12). CAC assessment may also be useful for detecting CAD in heart transplant recipients.50
FIGURE 22–12.
Diagnostic yield of calcium screening in symptomatic men (A) and women (B). The lower scores define the calcium score thresholds for the 95% of patients without significant stenoses. The higher scores give the calcium score thresholds for the 90% of patients with significant stenoses. Within the central area, the diagnosis is uncertain. The numbers in parentheses give the numbers of patients within the area. For example, a man at the age of 50 years is probably free of coronary stenosis if his score is <56. At scores ≥217, he bears a high risk of stenosis. Reproduced with permission from Haberl et al.49
| Investigators | Year | Number of Subjects | Sensitivity (%) | Specificity (%) | Positive Predictive Accuracy (%) | Negative Predictive Accuracy (%) |
|---|---|---|---|---|---|---|
| Agatston et al40 | 1990 | 584 | 96 | 51 | 31 | 98 |
| Breen et al61 | 1992 | 100 | 100 | 47 | 63 | 100 |
| Bielak et al62 | 1994 | 160 | 96 | 45 | 57 | 93 |
| Kaufman et al63 | 1995 | 160 | 93 | 67 | 81 | 86 |
| Rumberger et al22 | 1995 | 139 | 98 | 39 | 59 | 97 |
| Braun et al64 | 1996 | 102 | 93 | 73 | 93 | 73 |
| Budoff et al41 | 1996 | 710 | 95 | 44 | 72 | 84 |
| Detrano et al42 | 1996 | 491 | 95 | 31 | 51 | 89 |
| Fallavollita et al43 | 1996 | 106 | 85 | 45 | 66 | 70 |
| Baumgart et al44 | 1997 | 57 | 97 | 21 | 56 | 86 |
| Schmermund et al45 | 1997 | 118 | 95 | 88 | 99 | 58 |
| Kennedy et al46 | 1998 | 368 | 96 | 31 | 51 | 90 |
| Bielak et al47 | 2000 | 213 | 99 | 39 | 64 | 98 |
| Shavelle et al48 | 2000 | 97 | 96 | 47 | 80 | 82 |
| Haberl et al49 | 2001 | 1764 | 99 | 30 | 62 | 98 |
| Total | 5169 | 97 | 39 | 61 | 92 |
The poor specificity of coronary calcium scanning can be reconciled by the fact that the coronary calcification confirms the presence of atherosclerotic plaque, but it may not necessarily be obstructive (Fig. 22–13). The CAC severity may be a better barometer of obstructive CAD than the mere presence of calcium. Budoff and coworkers41 observed that specificity increased with the number of calcified coronary arteries (ie, high calcium scores). Two separate reports in patients referred for coronary angiography found that a CACS >100 best predicted obstructive CAD with an equally high sensitivity and specificity of 80%.51,52 There appears to be a threshold CACS above which most patients will have significant coronary artery stenosis (Fig. 22–14). The accuracy for identifying significant CAD based on CACS may be further improved by incorporating age, sex, and traditional risk factor information.22,47,49,52-54 However, despite the relationship between obstructive CAD and CAC severity, the latter is still too imprecise to be used as a definitive criterion for proceeding directly to coronary angiography. The current American College of Cardiology (ACC)/American Heart Association (AHA) appropriateness guidelines on coronary angiography do not recommend coronary angiography based on a positive EBCT but do suggest that angiography may be avoided with the finding of a negative (0 score) study.55
FIGURE 22–13.
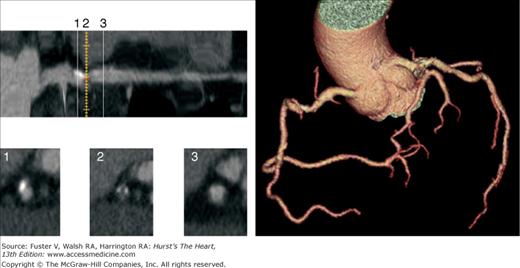
Four noncontrast EBCT images (left). The total CACS is moderate at 271 and highest in the RCA (176). Longitudinal maximum-intensity projection (MIP) view of RCA lesion (top) with three axial multiplanar reconstruction (MPR) views obtained at three sequential points (below): (1) calcified plaque, (2) mixed plaque, and (3) normal reference vessel. Coronary three-dimensional arteriogram (right) demonstrates a nonobstructive plaque in the mid RCA; the LAD and LCX coronary arteries were normal. The patient also had a normal exercise myocardial perfusion scan. EBCT, electron-beam computed tomography; LAD, left anterior descending; LCX, left circumflex; RCA, right coronary artery.
FIGURE 22–14.
Single-photon emission computed tomography (SPECT) results based on total coronary artery calcium (CAC) score. Increasing calcium scores were associated with a higher likelihood of abnormal SPECT scan (blue bars represent >5% ischemic segment; brown bars represent >10% ischemia present). Reproduced with permission from Berman et al.65
A recent trial explored the complementary role of EBCT and myocardial perfusion SPECT for identifying both subclinical CAD and silent myocardial ischemia in a generally asymptomatic population who had risk factors for CAD development.56 The purpose of this study was to identify patients with subclinical CAD who might benefit from aggressive risk factor modification and are at relatively higher short-term risk for cardiac events based on the presence of silent myocardial ischemia. Among the 3895 patients who had EBCT, 411 also underwent stress SPECT within a close temporal period (median, 17 days). The mean CACS was significantly higher in the 81 patients (20%) who had an abnormal (1065 ± 983) compared with a normal (286 ± 394, P < .00001) SPECT. The likelihood of an abnormal SPECT increased dramatically with the total CACS (Fig. 22–15). Although only 1% of patients with a total CACS < 100 had an abnormal SPECT, this was observed in 46% of patients with scores ≥400. Only 10% of all 3895 patients scanned with EBCT had CACSs ≥400. Large ischemic perfusion defects were virtually confined to patients who had a CACS of ≥400 (see Figs. 22–14 and 22–15). Several studies have confirmed that patients with large ischemic perfusion defects by SPECT are known to be at high risk for subsequent cardiac events, whereas patients with small perfusion defects or those with normal scans have an exceedingly low cardiac event rate (Figs. 22–16 and 22–17).57-60
FIGURE 22–15.
Single-photon emission computed tomography (SPECT) results based on total coronary artery calcium score (CACS). Few patients with CACS <400 had a perfusion defect, whereas nearly half of the patients with CACS >400 had an abnormal SPECT. PDS, perfusion defect size; LV, left ventricle. Reproduced with permission from He et al.56
FIGURE 22–16.
Relative risks for total cardiovascular events in patients at various total calcium score quartiles versus those without calcium, adjusting for age, sex, hypertension, hyperlipidemia, smoking history, and diabetes. Reproduced with permission from Wong et al.76
FIGURE 22–17.

Risk factor–unadjusted (A) and risk factor–adjusted (B) cumulative survival curves in 10,377 asymptomatic individuals based on electron-beam computed tomography (EBCT)-derived coronary artery calcium score results. Reproduced with permission from Shaw et al.29
A study of 1195 patients who underwent CAC measurement with EBCT and myocardial perfusion SPECT assessment demonstrated that CAC was often present in the absence of myocardial perfusion SPECT abnormalities and that <2% of all patients with CACS < 100 had positive myocardial perfusion SPECT studies.65 This is supported by other published reports and is synthesized in a recent appropriateness guideline from the American Society of Nuclear Cardiology (ASNC) and the ACC.66 Because calcified plaque may be present in nonobstructive lesions, the presence of CAC in asymptomatic persons does not provide rationale for revascularization but rather risk factor modification and possible further functional assessment. Clinicians must understand that a positive calcium scan indicates atherosclerosis, but most often, no significant stenosis. The absence of coronary calcium is most often associated with a normal nuclear test and no obstructive disease on angiography. The ACC/ASNC appropriateness criteria suggest that a low score precludes the need for myocardial perfusion SPECT assessment and a high score warrants further assessment. A person with an Agatston score >400 may benefit from functional testing to detect occult ischemia.
Noninvasive techniques, such as exercise treadmill testing and myocardial perfusion imaging, can identify patients with coronary atherosclerosis. However, unlike CT, which can detect coronary atherosclerosis at its earliest stages, these techniques can identify only patients with advanced CAD who manifest myocardial ischemia. Although the presence and extent of ischemia can accurately identify asymptomatic individuals at high risk for cardiac events, the very low prevalence of a positive test result (<5%) precludes the use of these methodologies as primary screening tests for the early detection and treatment of CAD (Fig. 22–18).57,58,67
FIGURE 22–18.
Kaplan-Meier survival curves based on exercise electrocardiogram (ECG) and thallium 201 (Tl) scan results. The highest event rate (17%) is observed in patients with ischemia (+) by both tests. The percentages of patients with each test combination are shown above the curves. CABG, coronary artery bypass grafting; MI, myocardial infarction; PTCA, percutaneous transluminal coronary angioplasty. Reproduced with permission from Blumenthal et al.57
Several studies emphasize the effectiveness of selectively combining stress myocardial perfusion imaging with CT in the anticipated small (10%) number of asymptomatic patients who will have a high (≥400) CACS so as to specifically identify those with silent myocardial ischemia (Fig. 22–19).56,66 This testing strategy may prove to be optimal based on the known prognostic value of perfusion imaging and the superior sensitivity of CT over the former for detecting preclinical CAD. Appropriateness criteria for nuclear testing consider a calcium score >400 in an asymptomatic person to be a generally appropriate indication for myocardial perfusion SPECT testing.66
FIGURE 22–19.

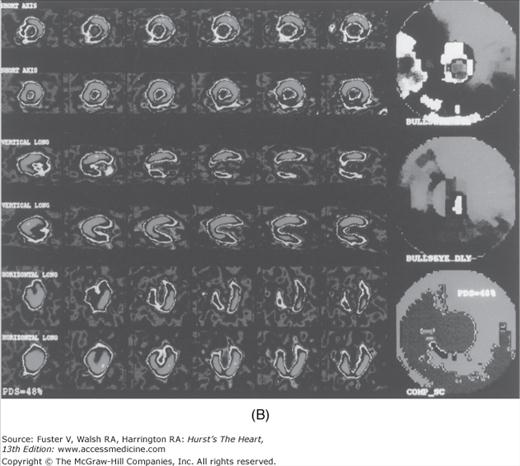
EBCT (A) and SPECT (B) images of an asymptomatic patient who had a high-risk CACS of 937. Circles define regions of coronary calcification. The treadmill test was terminated at 9.0 minutes because of patient fatigue. SPECT demonstrated a large, reversible 48% perfusion defect within the distribution of all three major coronary arteries (COMP-SC) (B). This patient had severe three-vessel disease on angiography and underwent CABG. CACS, coronary artery calcium score; EBCT, electron-beam computed tomography; PDS, perfusion defect size; SPECT, single-photon emission computed tomography. Reproduced with permission from He et al.56
The likelihood of plaque rupture and the development of acute cardiovascular events is related to the total atherosclerotic plaque burden.68-70 Although controversy exists as to whether calcified or noncalcified plaques are more prone to rupture,71,72 extensive calcification indicates the presence of both plaque morphologies.22,23 There is a direct relationship between the CAC severity, the extent of atherosclerotic plaque, and the presence of silent myocardial ischemia. Many studies have now demonstrated an increased risk for cardiac events in asymptomatic patients who have extensive silent myocardial ischemia.57,58,67,73 Therefore, the CACS could be useful for risk assessment of asymptomatic individuals and potentially guide therapeutics.
Several recent trials in both symptomatic42,74 and asymptomatic30,75-79 patients have studied whether the extent of CAC as assessed by EBCT can predict subsequent patient outcome. In 422 symptomatic patients followed for 30 ± 12 months,42 cardiac events were 10-fold higher in patients with a CACS above the 75th percentile for age (9.5%) versus patients with a CACS below the 25th percentile (0.9%). Another study of 288 symptomatic patients referred for coronary angiography74 showed that patients with a CACS > 100 had a 3.2-fold higher relative risk of death or MI than those with a lower CACS.
In the longest study of EBCT scanning of the coronary arteries, the South Bay Heart Watch study, 1196 asymptomatic patients were followed (median, 7.0 years), and it was demonstrated that the CACS added predictive power beyond that of standard coronary risk factors and C-reactive protein.30
Among 1173 asymptomatic patients followed for 3.6 years after an initial screening EBCT, no events occurred in patients with a normal study, and the negative predictive value was 99.8% in patients with a CACS < 100. These results showed a 5%, 7%, and 13% hard cardiac event rate in individuals with a CACS of ≥80, ≥160, and ≥600, respectively.75 The CACS remained the best single predictor of risk after adjustment (Table 22–3). Wong and colleagues76 also showed that the CACS severity predicted subsequent cardiovascular events independent of age, sex, and patient risk factor profile (see Fig. 22–16).
| Study | Number of Participants | Follow-Up (years) | C Statistic with Risk Factors | C Statistic with CAC | P Value |
|---|---|---|---|---|---|
| Arad et al75 | 4903 | 4.3 | 0.69 | 0.79 | .0006 |
| Budoff et al33 | 25,253 | 6.8 | 0.611 | 0.813 | < .0001 |
| Anand et al83 | 510 | 2.3 | 0.60 | 0.92 | < .0001 |
| Becker et al82 | 716 | 8.1 | 0.68 | 0.77 | < .01 |
| Detrano et al28 | 6722 | 3.8 | 0.77 | 0.82 | < .001 |
Raggi and coworkers77 reported on 172 patients who had EBCT within 60 days of an unheralded MI and on 632 asymptomatic patients who were referred for a screening EBCT and then followed for 32 ± 7 months. Ninety-six percent of all patients with infarction were abnormal by EBCT, and the CACS was ≥100 in 62% and ≥400 in 47% of patients. Both the absolute CACS and the relative CACS percentiles adjusted for age and sex predicted subsequent death and nonfatal MI. Hard cardiac events occurred in only 0.3% of patients with a normal EBCT, but this increased to 13% in patients with a CACS >400. A very high CACS (≥1000) may portend a particularly high risk of death or MI (25% per year).78
Larger trials have reported an approximately 10-fold increased risk with the presence of CAC.79,80 In one of the largest observational trials to date, Shaw and colleagues29 reported all-cause mortality among 10,377 asymptomatic patients (4191 women and 6186 men) who had a baseline EBCT and were then followed for 5.0 ± 3.5 years. Most patients had cardiac risk factors including a family history of CAD (69%), hyperlipidemia (62%), hypertension (44%), and current cigarette smoking (40%). The CACS was a strong independent predictor of mortality, with 43% additional predictive value contained within the CACS beyond risk factors alone. Mortality significantly increased with increasing CACS (see Fig. 22–17).
Similarly, in a younger cohort of asymptomatic persons, the 3-year mean follow-up in 2000 participants (mean age, 43 years) showed that coronary calcium was associated with an 11.8-fold increased risk for incident coronary heart disease (CHD) (P < .002) in a Cox model controlling for the Framingham risk score.32 The Rotterdam Heart Study31 investigated 1795 asymptomatic participants (mean age, 71 years) who had CAC and measured risk factors. During a mean follow-up of 3.3 years, the multivariate-adjusted relative risk of coronary events was 3.1 for calcium scores of 101 to 400, 4.6 for calcium scores of 401 to 1000, and 8.3 for calcium scores >1000 compared with calcium scores of 0 to 100.
The Cooper Clinic Study81 included 10,746 adults who were 22 to 96 years of age and free of known CHD. During a mean follow-up of 3.5 years, 81 hard events (CHD death and nonfatal MI) occurred. Age-adjusted rates (per 1000 person-years) of hard events were computed according to four CAC categories: no detectable CAC and incremental sex-specific thirds of detectable CAC; these rates were, respectively, 0.4, 1.5, 4.8, and 8.7 (trend P < .0001) for men and 0.7, 2.3, 3.1, and 6.3 (trend P < .02) for women. The association between CAC and CHD events remained significant after adjustment for CHD risk factors. A Munich study determined the extent of CAC by MDCT in 924 patients (443 men, 481 women, aged 59.4 ± 18.7 years).82 During the 3-year follow-up period, the event rates for coronary revascularization, MI, and cardiac death in patients with volume scores above the 75th percentile were significantly higher compared with the total study group, and no cardiovascular events occurred in patients with scores of 0. Receiver operating characteristic (ROC) analysis demonstrated that it outperformed both the Prospective Cardiovascular Münster (PROCAM) and Framingham models (P < .0001), where 36% and 34% of MIs occurred in the high-risk cohorts, respectively.
A study demonstrated the risk stratification in uncomplicated type 2 diabetes in a prospective evaluation of CAC and myocardial perfusion SPECT.83 Risk factors and CACSs were prospectively measured in 510 asymptomatic type 2 diabetic patients (mean age, 53 ± 8 years; 61% males) without prior cardiovascular disease with a median follow-up of 2.2 years. In the multivariable model, the CACS and extent of myocardial ischemia were the only independent predictors of outcome. ROC analysis demonstrated that CAC predicted cardiovascular events with the best area under the curve (0.92), significantly better than the United Kingdom Prospective Diabetes Study Risk Score (0.74) and Framingham score (0.60). The relative risk to predict a cardiovascular event for a CACS of 101 to 400 was 10.13, and increased to 58.05 for scores > 1000 (P < .0001). No cardiac events or perfusion abnormalities occurred in patients with CAC ≤10 Agatston units up until 2 years of follow-up.
The ACC Clinical Expert Consensus Document examined predictors of 395 CHD deaths or MIs.84 The 11,815 patients who had CACSs of 0 had a low rate of events over the subsequent 3 to 5 years (0.4%, based on 49 events). Compared with a CACS of 0, a CACS between 100 to 400 indicated a relative risk of 4.3 (95% confidence interval [CI], 3.5-5.2; P < .0001), a score of 400 to 1000 indicated a relative risk of 7.2 (95% CI, 5.2-9.9; P < .0001), and a CACS of >1000 indicated a relative risk of 10.8 (95% CI, 4.2-27.7; P < .0001). The corresponding pooled rates of CHD death or MI were 4.6% (for scores from 400-1000) and 7.1% (for scores of ≥1000).
Multiple studies have demonstrated that the relationship between CAC outcomes is similar in men and women and different ethnic groups.28,33,34,84-86 Each of these studies demonstrated that the area under the curve to predict coronary artery events is significantly higher with CAC than either Framingham or PROCAM risk stratification. Studies comparing predictive capacity of conventional and newer biomarkers for prediction of cardiovascular events consistently demonstrate that adding a number of newer biomarkers (such as C-reactive protein, interleukins, and other proposed risk stratifiers) only changes the C statistic by 0.009 (P = .08).28,33,34 Small changes such as these in the C statistic suggest limited or modest improvement in risk discrimination with additional risk markers. However, CAC scanning has been shown to markedly improve the C statistic, suggesting robust improvement in risk discrimination (see Table 22–3).
The CACS appears to provide complementary prognostic information to that obtained by the Framingham risk model (Table 22–4). Multiple studies consistently demonstrate that CAC scanning confers more precise risk prediction than C-reactive protein or carotid intimal-medial thickness.28,33,34
| Study | Number of Patients | Mean Age (years) | Follow-Up Duration (years) | Calcium Score Cutoff | Comparative Group for Relative Risk Calculation | Relative Risk Ratio |
|---|---|---|---|---|---|---|
| Greenland et al30 | 1312 | 66 | 7.0 | CAC >300 | No CAC | 3.9 |
| Arad et al75 | 1173 | 53 | 3.6 | CAC >160 | CAC < 160 | 20.2 |
| Wong et al76 | 926 | 54 | 3.3 | Top quartile | First score quartile | 8.8 |
| Raggi et al77 | 632 | 52 | 2.7 | Top quartile | Lowest quartile | 13 |
| Kondos et al79 | 5635 | 51 | 3.1 | CAC | No CAC | 3.86 (men) 1.53 (women) |
| Arad et al80 | 4613 | 59 | 4.3 | CAC ≥100 | CAC < 100 | 9.2 |
| Shaw et al29 | 10,377 | 53 | 5 | CAC 401-1000 | CAC ≤10 | 6.2 |
| Taylor et al32 | 2000 | 43 | 3 | CAC | No CAC | 11.8 |
| Vliegenthart et al31 | 1795 | 71 | 3.3 | >1000 | 0-100 | 8.1 |
| LaMonte et al81 | 10,746 | 54 | 3.5 | CAC top third | No CAC | 8.7 (men) 6.3 (women) |
| Becker et al82 | 924 | 60 | 3 | Top quartile (75th percentile) | Total study group | 7.3 |
| Budoff et al33 | 25,253 | 61 | 6.8 | CAC > 100 | No CAC | 10.3 |
| Detrano et al28 | 6814 | 63 | 3.8 | CAC > 300 | No CAC | 9.67 |
| Becker et al34 | 1724 | 58 | 3.4 | Top quartile | No CAC | 6.8 (men) 7.9 (women) |
Traditional risk factor analysis is commonly used to identify individuals who are at increased risk for developing cardiovascular disease based on standard clinical criteria.87 Because the development of symptomatic cardiovascular disease occurs almost exclusively in patients with atherosclerosis, it seems advantageous in risk assessment to use a technique that directly measures the presence and severity of atherosclerotic burden rather than estimating its presence through indirect measures. For example, although there is a clear relationship between the number of cardiac risk factors and the presence and extent of CAC, 40% of men and 30% of women without risk factors in one series had CAC, whereas 26% of men and 36% of women with more than three traditional risk factors did not have any CAC.88 In addition, Newman and colleagues88 showed great heterogeneity in the EBCT-derived CACSs even among elderly men and women, which was only weakly associated with the presence of cardiac risk factors (Fig. 22–20). In this series, 9% of patients had a normal EBCT, and 31% had a CAC <100. Increasing age and tobacco use were significantly associated with an increasing CACS in both men and women, whereas hypertension, diabetes, and hyperlipidemia were not.
FIGURE 22–20.
Distribution of the coronary artery calcification (CAC) score in elderly men (top) and women (bottom). Reproduced with permission from Newman et al.88
Hecht and coworkers89 demonstrated that 76% of asymptomatic patients with an abnormal EBCT had a low-density lipoprotein (LDL) cholesterol <160 mg/dL and therefore would not meet National Cholesterol Education Program (NCEP) II guidelines for lipid-lowering therapy. Conversely, 52% of patients with an LDL cholesterol <130 mg/dL and 46% with an LDL <100 mg/dL had an abnormal EBCT. Although the combination of a high LDL cholesterol, a low high-density lipoprotein (HDL) cholesterol, and a history of cigarette smoking was a strong predictor of CAC, this risk factor profile was observed in only 6% of all women studied. Furthermore, only 6 of 21 women with the highest calcium scores (>101) had this risk factor profile. Conversely, 20% of women in the lowest risk profile (ie, nonsmokers, LDL cholesterol <130 mg/dL, and HDL cholesterol >60 mg/dL) had calcium by EBCT. Hecht and colleagues89 likewise showed that 42% of women aged ≤55 and 48% aged >55 years who were at low risk based on NCEP II guidelines (ie, LDL cholesterol <130 mg/dL and HDL ≥35 mg/dL) had evidence of coronary atherosclerosis based on an abnormal EBCT study.
Much interest has been directed at using CAC to measure plaque burden and then remeasuring at some point in time to assess for progression of disease (Fig. 22–21).90 Callister and coworkers91 performed one of the first studies to demonstrate a relationship between cholesterol control and atherosclerosis progression. There was a significant net increase in mean calcium volume score among individuals not treated with cholesterol-reducing medications (mean change, 52% ± 36%; P < .001). There was a graded response depending on the LDL reduction with statin therapy, with those treated to LDL <120 mg/dL demonstrating an average diminution of coronary calcium (7% ± 23%) and those treated less aggressively (LDL >120 mg/dL) showing a calcium volume score increase of 25% ± 22% (P < .001 for comparison with aggressively treated patients).


