Fig. 14.1
“Burst” technology, allowing parts of each image to be used for reconstruction. In this example, portions of two consecutive images were used, to allow the temporal resolution of multidetector computed tomography to be reduced from 265 ms to about 132 ms
In addition, MDCT possesses greater versatility for peripheral vascular imaging, as the gantry opening allows the patient to be inserted from head to foot without repositioning. Furthermore, with large areas of coverage due to multiple detectors, volume scanning is now the norm. To understand how much coverage is possible for a given scanner, one multiplies the number of detectors available (not the slices created, but the actual number of detectors) times the detector thickness (0.5–0.625 mm depending on the vendor). For example, a 64-slice scanner with a 0.625-mm detector width will have 40 mm of coverage per rotation (collimation = 0.625 × 64 = 40 mm), and a 320-detector scanner will theoretically cover 160 mm (320 mm × 0.5 mm = 160 mm per rotation). Because the height of the heart is typically 120 mm, modern CT scanning allows complete coverage of the cardiac anatomy in 1–5 s.
Simultaneous imaging from multiple detectors (now up to 64) during gantry rotation provides greater spatial resolution than does EBCT (specifically thinner slices through the heart), but at the expense of temporal resolution (the time to image an individual level, presenting more motion artifacts when heart rates are above 60 beats/min) [4]. Newer EBCT systems offer 9–11 line pairs/cm, MDCT has improved spatial resolution (14–16 line pairs/cm), and newer detector arrays that are now available (spectral imaging) allow even greater resolution [5]. A previous disadvantage of MDCT in cardiac scanning was the need for a relatively high radiation dose, but this dose has decreased markedly in recent years (see section “Radiation dose and cardiac computed tomography” below) [6].
The additional detector rows increase volume coverage per rotation, thus helping to improve scan times (the times the patient is being imaged), reduce breath-hold time, and reduce the contrast dose. A further benefit of more volume coverage per rotation is the presence of fewer artifacts. A major type of artifact with 4- or 16-slice scanners was a stair-step or misalignment artifact. This phenomenon was due to slight changes in the heart rate or cardiac motion, which caused misalignment of the two datasets. With newer CT scanners using larger volumes of coverage, this type of artifact is diminished or altogether avoided. With time, we will observe continued rapid advancements in CT for coronary and peripheral angiography.
Comparison of Computed Tomography to Magnetic Resonance Imaging
The strengths of cardiovascular MRI include greater definition of tissue characteristics, perfusion, and valvular function, avoidance of X-ray exposure, and use of less nephrotoxic contrast media than in CT technologies. In comparison, the strengths of CT include superior imaging of coronary arteries, higher spatial and temporal resolution, ability to scan patients who have implantable metallic devices such as pacemakers and defibrillators, and shorter study times [4].
Several studies have compared magnetic resonance (MR) angiography to coronary angiography [7–9]. The clinical applicability of MR angiography is reduced by limited temporal and spatial resolution [10], partial volume artifacts [11], reliance on multiple breath-holds, and poor visualization of the left main coronary artery [12]. In contrast, CT angiography offers advantages over MR angiography, including higher spatial resolution, reduced slice thickness, use of a single breath-hold to reduce respiratory motion, and an overall study time of 1–5 s (versus 45–90 min for MR angiography) [4, 13]. Reported sensitivities for MR angiography range from 0 to 90 % [4, 7, 13]. This technique remains a technically challenging one with certain limitations that hinder its clinical use. The rapidity and ease of CT coronary angiography suggest that this modality offers possible cost advantages compared with MR angiography and selective coronary angiography [14].
Noncontrast Computed Tomography Imaging
Coronary Artery Calcium
Coronary artery calcium (CAC) is closely associated with coronary atheromatous plaque. Arterial calcium deposition occurs in association with atherosclerotic plaque evolution and is regulated by cellular calcification-regulating proteins [15]. A direct relationship has been established between CAC as measured by CT and the results of both histopathologic [16, 17] and in vivo intravascular ultrasound [18, 19] studies, which confirm the close correlation between the atherosclerotic plaque burden and the extent of CAC.
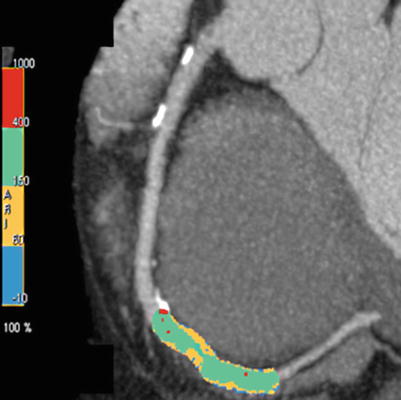
Computed tomography can accurately and noninvasively quantitate CAC, and several types of measurements have been used [20]. Most centers and researchers have reported a calcium score (the Agatston method) [1] that takes into account the density and area of the calcification. The score is calculated by multiplying the lesion area by a density factor derived from the maximal Hounsfield unit (HU) within this area. The density factor is assigned in the following manner: 1 for lesions whose maximal density is 130–199 HU, 2 for 200–299 HU, 3 for 300–399 HU, and 4 for >400 HU. A total calcium score is determined by summing individual lesion scores from each of four anatomic sites (left main, left anterior descending, circumflex, and right coronary arteries) (Fig. 14.2). The other measures are volume and mass score.
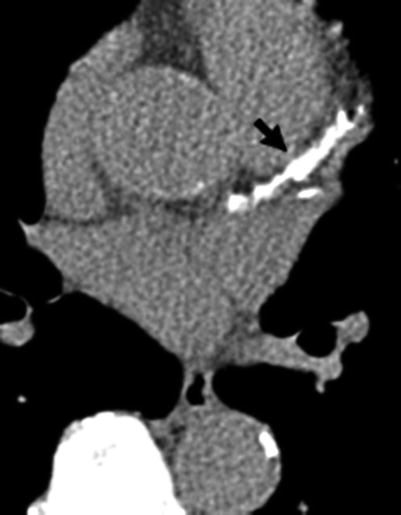
Fig. 14.2
Computed tomography study (axial image) showing calcification of the left main and left anterior descending coronary arteries. The total coronary calcium score was over 1,000. Arrow left anterior descending coronary artery calcification
A major criticism directed at the Agatston method is increased variability (decreased reproducibility) due to image noise (a peak HU level of 199 would multiply the area times a factor of 1; if that increased to 201 on a subsequent scan, it would increase the score by two-fold, as the density factor would be 2). Because these small changes in measurement can double the interscan variability, other measures have been proposed to allow more accurate and reproducible measurement of CAC. The volume method of Callister and associates [21] somewhat resolves the issues of density measures, slice thickness, and spacing by computing a volume above the threshold. This method has been shown to be more reproducible, but less data are available regarding the prognostic values of such scores. A mass score has been introduced, but no prognostic information is available. In addition, a phantom is required to make this measure, and this has been shown to increase image noise (which worsens reproducibility on individual scans) [22]. Further research, using either volume or mass scores, will be needed to allow accurate clinical guidelines to be written.
Data regarding the calcium-score distribution in large numbers of asymptomatic persons have been published [23]. These tables can be used to classify patients on the basis of the extent of their atherosclerotic disease compared with the expected norm. In men, there is a rapid increase in the prevalence and extent of coronary calcification after age 45 years. This increase occurs 10–15 years later in women.
Reproducibility of Coronary Calcium Assessment
The reproducibility of CAC measurement is essential to utilizing this modality for assessing the efficacy of therapeutic interventions. Reproducibility was initially a concern for repeated testing, but hardware and software improvements have reduced interscan variability to a median of 4–8 % [24]. In addressing reproducibility issues involving coronary calcium, it was noted that the most commonly used trigger time in early studies (80 % of the R-R interval) was suboptimal due to increased coronary motion during atrial systole (atrial motion causing the right and circumflex coronary arteries to move rapidly). This has become particularly important with the increased use of CT for measurement of atherosclerosis progression, as well as CT coronary angiography (to improve visualization of the coronary arteries without motion artifacts). Recent studies suggest that triggering should be initiated early in diastole rather than near the end (80 %), as done in the past with some scanners [2]. Researchers using MDCT usually conclude that 70–75 % of the R-R interval (mid diastole) is the optimal trigger for visualization of lumens with the least coronary motion. With MDCT, CAC has a variability of 11–15 % [25]. With excellent inter- and intraobserver variability (1 %), this test can measure plaque-burden changes over time [26].
Calcium Progression
Much interest has been directed at using CAC to measure the plaque burden and then remeasuring at some point to assess progression of the disease. Callister and colleagues [21] were among the first to demonstrate a relationship between cholesterol control and atherosclerosis progression. These researchers found a significant net increase in the mean calcium-volume score among individuals not treated with cholesterol-reducing medications (mean change: 52 ± 36 %; P < 0.001). There was a graded response depending upon reduction of the low-density lipoprotein cholesterol (LDL-C) level with statin therapy: treated patients with an LDL-C level of <120 mg/dL demonstrated an average diminution of coronary calcium (−7 ± 23 %), and individuals treated less aggressively (LDL-C level >120 mg/dL) showed a calcium-volume score increase of 25 ± 22 % (P < 0.001 for comparison with aggressively treated subjects).
Another study evaluated 299 patients who underwent two consecutive EBCT scans at least 12 months apart [27]. The average change in the calcium score (Agatston method) for the entire group was 33.2 ± 9.2 % per year. Patients who reported use of a statin had an annual rate of progression of 15 %, compared with a 39 % annual increase in the EBCT score for non-statin users.
Prospective studies showing a link between CAC progression and coronary events have recently been reported. In the first study, Raggi and colleagues [28] demonstrated in 817 persons that EBCT-measured progression was the strongest predictor of cardiac events. This observational study suggests that continued accumulation of CAC in asymptomatic individuals is associated with an increased risk of myocardial infarction (MI). In the second study, Raggi and associates [29] measured the change in CAC in 495 asymptomatic subjects subjected to sequential EBCT scanning. Statin therapy was started after the initial EBCT scan. On average, MI subjects demonstrated a CAC change of 42 ± 23 % yearly; event-free subjects showed a 17 ± 25 % yearly change (P = 0.0001). The relative risk of having an MI in the presence of CAC progression was 17–fold (95 % confidence interval [CI]: 4.1–71.2) higher than without CAC progression (P < 0.0001). In a Cox proportional hazards model, the follow-up score (P = 0.034) and a score change of >15 % per year (P < 0.001) were independent predictors of time to MI.
Coronary artery calcium represents the burden of coronary atherosclerosis [4] and risk of future cardiovascular events at a given point in time, whereas serial scanning helps to track the progression of atherosclerosis and the impact of various treatment modalities [26, 28]. Whereas the prognostic value of one-time CAC scores is well established, CAC progression is also a significant predictor of future coronary events. Previously published studies have shown an annual CAC score change of >15 % to be a significant predictor of future adverse cardiovascular events [28, 29].
More recently, large cohort studies have been reported. In a prospective evaluation of 4,609 patients, Budoff and coworkers [30] reported that, after adjusting for baseline score, age, sex, and time between scans, CAC progression (the mean progression was 247 in this group) was associated with a 3.34-fold risk of all-cause mortality (hazard ratio [HR], 3.34; 95 % CI, 2.65–4.21; P < 0.0001). Berry and colleagues [31] showed that among 2,988 participants in the Coronary Artery Risk Development in Young Adults (CARDIA) study with a low 10-year risk of a cardiac event, those with a high life-time risk had significantly greater annual CAC progression (22.3 % vs. 15.4 % in men; 8.7 % vs. 5.3 % in women) compared with those with a low life-time risk. The study included individuals with a baseline atherosclerosis score of >10 CAC, and the annual rate of CAC progression was comparable to that observed in the above-mentioned study (22 %/year in patients without cardiac events). However, the annual CAC progression rate was significantly higher in patients with cardiac events (35 % annual CAC score progression). In the recent Multi-Ethnic Study of Atherosclerosis (MESA) [32], researchers measured CAC scores at baseline and repeated this measurement after 3.5 years in 5,682 patients, with a 7.6-year follow-up period. This study also showed that CAC progression was independently and strongly associated with increased cardiovascular events. Among participants with baseline CAC, those with an annual progression rate of ≥300 units had adjusted HRs of 3.8 (1.5–9.6) for total and 6.3 (1.9–21.5) for hard coronary heart disease (CHD) compared to those without progression.
Coronary Artery Calcium and Obstructive Disease
In contradistinction to other noninvasive modalities that focus on diagnosis of obstructive CAD, coronary calcium represents an anatomic measure of plaque burden [33]. Studies comparing pathologic and CAC findings have shown that the degree of luminal narrowing is weakly correlated with the amount of calcification on a segment-by-segment basis [34], whereas the total calcium score is more closely associated with the presence and severity of maximum angiographic stenosis [35]. Detection of coronary calcium by CT has been demonstrated to be highly sensitive for the presence of significant CAD. In a series of 1,764 persons undergoing angiography and CT, Haberl and colleagues [36] similarly documented a very high sensitivity and negative predictive value in both men and women (>99 %). Therefore, a calcium score of 0, denoting no evidence of coronary calcium, can virtually exclude patients with obstructive CAD, making this test an effective screen before invasive angiography. Guerci and associates [37] recently studied 290 men and women undergoing coronary arteriography for clinical indications and concluded that CAC scanning improved discrimination over conventional risk factors in the identification of persons with angiographic coronary disease.
An important point in the interpretation of CAC scores relates to the detection of obstructive CAD. A negative test result, i.e., no evidence of calcified atherosclerotic plaque, can virtually exclude obstructive disease. A positive result, i.e., the presence of CAC, is nearly 100 % specific for atheromatous coronary plaque [38]. However, because both obstructive and nonobstructive lesions have calcification present, CAC is not specific to obstructive disease. Whereas increasing calcium scores are more predictive of obstructive CAD, there is not a 1:1 relationship between calcification and stenosis. The overall specificity of any CAC for obstructive CAD is approximately 66 % [39]. In a study of 1,851 patients undergoing angiography and CAC measurement [40], calcium scanning in conjunction with the pre-test probability of disease derived by a combination of age, gender, and risk factors, could assist the clinician in predicting the severity and extent of angiographically significant CAD in symptomatic patients. In the detection of obstructive CAD, CAC has been shown to be comparable to nuclear exercise testing [41, 42]. As opposed to stress testing, CT CAC testing is not limited by concurrent medications, ability to exercise, or baseline ECG abnormalities. Moreover, scanning for CAC does not require injection of a contrast medium; therefore, a CT technician can perform the study without supervision. The entire procedure takes less than 10 min to perform. However, cardiac CT does not offer assessment of the patient’s functional status, so many physicians may utilize a treadmill test and calcium scan together. This algorithm has been shown to improve the diagnostic accuracy of both tests [43] without significantly increasing the cost.
The Role of Coronary Calcium in Risk Stratification
Disease processes related to atherosclerosis are the primary cause of morbidity and mortality in every industrialized nation. In up to 50 % of patients, the initial manifestation of CAD is MI or death [44]. Most cardiac events occur in the intermediate-risk population, for whom aggressive risk-factor modification is often not often recommended or applied. Unfortunately, traditional risk-factor assessment helps predict only 60–65 % of cardiac risk; therefore, many individuals without established risk factors for atherosclerotic heart disease continue to experience cardiac events [45]. Acute coronary occlusion most frequently occurs at the site of mild to moderate stenoses (<50 % lesion severity) in association with the process of plaque rupture [46, 47]. Therefore, plaque burden, and not stenosis severity, is a more important marker of disease [48]. These studies emphasize the importance of measuring the atherosclerosis burden in the risk stratification for future cardiovascular events, rather than relying solely on evidence of obstructive CAD.
Coronary Artery Calcium Risk Prediction in Symptomatic Individuals
Various studies have shown that CAC has a prognostic significance in symptomatic individuals. Margolis and associates [49] assessed the significance of CAC found on fluoroscopy in 800 patients undergoing coronary angiography. The 5-year survival rate for the patients with CAC was 58 %, compared with 87 % for the patients without CAC. In a study of 192 patients who were observed for an average of 50 ± 10 months after undergoing a CAC study while in the emergency department for chest discomfort, Georgiou and colleagues [50] found that the presence of CAC (calcium score >0) and increasing absolute calcium score values were strongly related to the occurrence of hard cardiovascular events (P <0.001) and all cardiovascular events (P <0.001). Compared to patients with lower scores, the patients with absolute calcium scores in the top two quartiles had a relative risk of 13.1 (95 % CI, 5.6–36; P < 0.001) for new cardiovascular events. The annualized cardiovascular event rate was 0.6 % for subjects with a CAC score of 0 versus 13.9 % for patients with a CAC score of >400 (P < 0.001).
A multicenter study of 491 patients undergoing coronary angiography and CT scanning showed that higher calcium scores were associated with a markedly increased risk of coronary events over the next 30 months [51]. On multivariate analysis, the only predictor of a hard cardiac event was the log calcium score, even with coronary risk factors and angiographic disease included in the model. In another study of symptomatic patients, CAC was a stronger independent predictor of disease and future events than were all the traditional risk factors combined [52]. In following up 288 symptomatic persons who underwent angiography and calcium scanning for a mean of 6.9 years, Keelan and coauthors [53] found that age and CAC score were the only independent predictors of future hard coronary events.
Coronary Artery Calcium in Asymptomatic Individuals
Coronary artery calcium is also a useful predictor of cardiovascular events in asymptomatic individuals. Unfortunately, at least half of all first coronary events occur in asymptomatic individuals who are unaware that they have CAD, and far too often these events involve sudden death or acute MI [48]. Several lipid-lowering trials have shown that substantial risk reduction can be attained with both secondary and primary prevention measures [54].
Multiple prospective trials have shown the prognostic ability of CAC to identify asymptomatic patients at high risk of cardiac events. Arad and colleagues [55] reported a 3.6-year follow-up study of 1,173 patients. Asymptomatic individuals were evaluated with CT, as well as measures of traditional risk factors, and were followed up prospectively for cardiac events. This study showed CAC to be the strongest predictor of future cardiac events, patients in the highest score category being over 20 times more likely to have a cardiac event (odds ratio, 22.3; CI, 5.1–97.4).
Wong and associates [56] followed up 926 asymptomatic patients (mean age, 54 years) for an average of 3.3 years. The presence of CAC and increasing score quartiles were related to the occurrence of new MI (P < 0.05), revascularization (P < 0.001), and total cardiovascular events (P < 0.001). The risk ratio for events in patients whose absolute calcium score was in the upper quartile (>271) compared with individuals whose absolute calcium score was in the lowest quartile (<15) was 12 (relative risk, 8.8 vs. 0.72, respectively; P < 0.001).
In a long-term follow-up evaluation of the South Bay Heart Watch study, Greenland and colleagues [57] demonstrated that CAC was predictive of risk in patients with a Framingham Risk Score of >10 % and that a high CAC score was able to predict risk beyond the Framingham Risk Score alone. Compared to a CAC score of 0, a CAC score of >300 was highly predictive of cardiac events (HR, 3.9; P < 0.001).
In a series reported by Raggi and coauthors [58], 632 asymptomatic individuals with risk factors for CAD were followed up for an average of 32 ± 7 months. The event rate was 0.11 %/year for patients with a CAC score of 0 versus 4.8 %/year for patients with a CAC score of >400. The event rate in patients with calcium scores in the highest quartile was 22 times the event rate in patients with calcium scores in the lowest quartile; therefore, the CAC score significantly outperformed risk-factors in cardiac-event prediction. Multiple logistic regression analyses showed that the calcium-score percentile was the only significant predictor of events and that it provided an incremental prognostic value when added to traditional risk factors for CAD.
Larger trials have revealed an approximately 10-fold increased risk with the presence of CAC. Kondos and associates [59] reported 37-month follow-up results for 5,635 initially asymptomatic low-to-intermediate–risk adults. In men, events (n = 192) were associated with the presence of CAC (relative risk [RR], 10.5; P < 0.001), diabetes mellitus (RR, 1.98; P = 0.008), and smoking (RR, 1.4; P = 0.025), whereas in women, events (n = 32) were linked to the presence of CAC (RR, 2.6; P = 0.037) and not to risk factors.
In a prospective study of 5,585 subjects aged 59 ± 5 years, Arad and coauthors [60] found that a calcium score of ≥100 predicted all atherosclerotic cardiovascular disease events, all coronary events, and the sum of nonfatal MI and coronary death events with an RR of 9.5–10.7 at 4.3 years. The calcium score also predicted events independently of, and more accurately than, measured risk factors. The area under the receiver operating characteristic curve for event prediction with risk factors alone in this study was 0.71, increasing to 0.81 with CAC testing (P < 0.01). In this prospective study, the investigators strongly demonstrated the ability of this test to identify patients who do not require therapy. Only 19 % of patients had calcium scores above the diagnostic threshold (≥100), yet relying on this threshold had a negative predictive power of 99.2 %. Thus, clinicians can focus on a smaller, yet higher–risk population (in this group, risk was increased 10.7–fold in patients with scores of >100) for risk–reduction therapy.
Shaw and colleagues [61] demonstrated the power of CAC to predict all-cause mortality over the next 5 years. A cohort of 10,377 asymptomatic individuals undergoing cardiac risk-factor evaluation and CAC measurement was followed up for a mean period of 5.0 years. In a risk-adjusted model, CAC was an independent predictor of mortality (P < .001). Coronary calcium was a better predictor than traditional cardiovascular risk factors, and very high scores (>1,000) were associated with a 13-fold increased risk of death as compared to lower scores.
More recently, large population-based studies, such as MESA, the Rotterdam Study, and others, all have shown that CAC is a strong independent predictor of future cardiovascular events and adds incremental prognostic value to traditional cardiovascular risk factors.
In the Heinz Nixdorff Recall (HNR) Study [62], a large population-based study with nearly 5,000 participants, 5-year follow-up evaluation has shown that CAC testing resulted in a high net reclassification rate (30.6 %) in participants at intermediate risk and that the adjusted RR increases with increasing CAC scores. Also, a CAC score of 0 indicates an excellent prognosis, with an event rate of only 0.16 %/year. These results compare favourably with those of MESA, in which the net reclassification improvement was 25 % (CI: 16–34 %).
The Rotterdam Study [63] started 10 years earlier than HNR and MESA and included a prospective population based on a subject age range of 62–85 years. After exclusion of subjects with CAD, 1,795 (49 %) of 3,370 asymptomatic subjects remained in the study. During a mean follow-up period of 3.3 years, 40 (2.2 %) of 1,795 asymptomatic participants had a hard coronary event, including MI and cardiac death. The relative risk of events was calculated by using a CAC score of 0–100 as a referent, yielding a value of 2.7 (1.0–7.7) for those with a CAC score of 101–400; a value of 4.1 (1.4–11.6) for those with a CAC score of 401–1,000; and a value of 8.1 (2.9–22.3) for those with a CAC score of >1,000. The Rotterdam Calcification Study [64] showed that the upper percentile range reflects a 12-fold increased risk of MI—independent of the classical risk factors—even in elderly people.
In the MESA study [65], major coronary events (MI or cardiac death) were observed in 89 (1.3 %) of 6,712 participants within 3.8 years. Those with a CAC score of >100 had a 7-fold increase in the odds for developing events, and those with a CAC score of >400 had a 10.3-fold increase in events. In the MESA and Rotterdam trials, CAC was shown to be a much more robust predictor of events than C-reactive protein (CRP) levels, carotid intima-media thickness (IMT), and the ankle-brachial index—three other tests advocated for screening in an asymptomatic population.
Coronary Artery Calcium: Guidelines and Applications
The above-mentioned studies show the ability of CAC to provide risk stratification in asymptomatic and symptomatic populations by supplying incremental prognostic information beyond traditional risk factors. Based on the results of these studies, some researchers have suggested that the Framingham Global Risk Score be modified by using a weighted factor based on the patient’s individual calcium score percentile [66]. With this modification, the Framingham Risk Score assigned to a subject undergoing CAC screening for asymptomatic CAD is increased if the calcium score is elevated.
The prevalence and extent of CAC increases with age, and both of these factors are higher in men than in women at any age. A comparison of the prognostic value between the absolute CAC score and the calcium “percentile”—relative to age and gender—has been reported by the MESA investigators [67]. In this study, although both scoring methods yielded effective risk stratification, the absolute measurement approach performed better than the percentile approach. Therefore, reporting of the absolute CAC score is currently recommended for clinical practice.
The greatest potential for CAC detection could be as a marker of CAD prognosis in asymptomatic persons at risk for CAD, beyond that detected by conventional coronary risk factors. Since 2000, when the American College of Cardiology (ACC)/American Heart Association (AHA) expert consensus document on EBCT reported that risk-stratification evidence was inconclusive on CAC scanning [68], a number of studies have shown that the presence and severity of CAC has an independent and incremental value when added to clinical or historical data in measuring the risk of death or nonfatal MI. Since those early recommendations, the National Cholesterol Education Program (NCEP) has made recommendations specifically regarding the use of CAC to assist in risk stratification of elderly and intermediate-risk patients. The new NCEP guidelines (ATP III) [69] support the conclusions of the AHA Prevention Conference V [70] and the ACC/AHA report [68] that high coronary calcium scores signify, and confirm, an increased risk of future cardiac events. The new guidelines state, “Therefore, measurement of coronary calcium is an option for advanced risk assessment in appropriately selected persons. In persons with multiple risk factors, high coronary calcium scores (e.g. >75th percentile for age and sex) denotes [sic] advanced coronary atherosclerosis and provides [sic] a rationale for intensified LDL-lowering therapy.” New guidelines for prevention of CAD recommend coronary calcium scoring as a method of risk stratification; positive CAC scores place individuals at intermediate risk according to the Framingham model (10–20 % 10-year risk), and high CAC scores place individuals at high risk for future cardiac events [71].
The absence of CAC in asymptomatic patients identifies a very low risk of events over the next 3–5 years. An annual event rate of only 0.11 % has been reported for patients with CAC scores of 0 [58]. Both the ACC/AHA writing group and the Prevention Conference V group agreed that the negative predictive value of CAC is very high for short-term events [68, 70]. Whether a calcium score of 0 will allow therapy to be withheld remains to be prospectively tested.
Current guidelines suggest that intermediate-risk patients would benefit most from further risk stratification, as most cardiac events occur in this population [56]. Recent work suggests that EBCT can also improve risk prediction in intermediate-risk patients. Thus, in virtually all patients with a previous probability of a coronary event in the intermediate range (>6 % in 10 years but <20 % in 10 years), a calcium score would yield a post-test probability of >2 % per year, i.e., a level similar to that in secondary prevention, or a “coronary risk equivalent.” Furthermore, CAC screening has been shown to be a cost-effective screening strategy in asymptomatic individuals between 45 and 65 years of age [72]. The ability of CAC scoring to identify patients who require aggressive risk-factor modification—coupled with the effectiveness of cholesterol-lowering medications, aspirin, and other therapies—should allow physicians to focus aggressive preventative treatment on individuals with underlying atherosclerosis who are at highest risk of having cardiovascular events.
Several potential specific applications of CAC assessment deserve mention. Based on the fact that a CAC score of 0 is associated with a <1 % chance of obstructive CAD, the use of EBCT before angiography has been recommended for certain persons who have a low-to-intermediate risk of obstructive CAD. In symptomatic patients, calcium scanning may be more cost effective than traditional noninvasive testing for diagnosing CAD, especially in women [72–74].
Another potential application of cardiac CT relates to the triage of patients with chest pain. Electron-beam CT has been shown to be an efficient screening tool for patients with chest pain who are admitted to the emergency department to rule out MI [75, 76]. These studies show that EBCT has a sensitivity of 98–100 % for identifying patients with acute MI and that persons with negative test results have very low subsequent event rates. The high sensitivity and negative predictive value may allow early discharge of patients with nondiagnostic electrocardiograms and negative calcium scans. Exclusion of coronary calcium may, therefore, be an effective screening method before invasive diagnostic procedures or hospital admission.
In patients with cardiomyopathy, CAC has been shown to be useful in determining the etiology of this condition. The clinical manifestations of ischemic cardiomyopathy are often indistinguishable from those of nonischemic dilated cardiomyopathy. In 120 patients with heart failure of unknown etiology, Budoff and colleagues [77] demonstrated that the presence of CAC was associated with a 99 % sensitivity for ischemic cardiomyopathy.
Position of the Professional Societies and Guidelines
Fortunately, the AHA and ACC have taken responsible positions on this issue. Given the strong literature in support of risk stratification with CAC scanning, this issue is currently undergoing a revision and should have stronger support by both organizations, especially given the incremental and independent predictive value found in all studies to date.
Recent guidelines and expert consensus documents have recommended the use of CAC (or other tests of the atherosclerosis burden) in clinically selected patients at intermediate risk for CAD (e.g., those with a 10–20 % Framingham 10–year risk estimate) to refine clinical risk prediction [70, 78, 79] and to select patients who could benefit from altered targets for lipid–lowering therapies [69, 80].
The most recent guidelines (ACC/AHA 2010) [81] for cardiovascular risk stratification of asymptomatic individuals recommend measurement of CAC as a class IIa indication for individuals at intermediate risk (10–20 % 10-year risk) and a class IIb indication for individuals at low-to-intermediate risk (6–10 % 10-year risk).
The Fifth Joint Task Force of the European Society of Cardiology and Other Societies on Cardiovascular Disease Prevention in Clinical Practice reviewed the role of CAC scoring in risk assessment. In the resulting guideline [82], published in 2012, the Task Force noted that the Agatston score is an independent risk marker regarding the extent of CHD and its prognostic impact. Like the American guidelines, the European ones state that calcium scoring is especially suited for patients at moderate risk (class IIa recommendation).
Contrast-Enhanced Computed Tomography Angiography
The ability to visualize the coronary artery lumen has revolutionized CT imaging. An alternative, less expensive, and noninvasive test for use as a diagnostic tool before possible intervention could have a major impact on healthcare practice and cost containment [4]. Contrast-enhanced CT angiography is an emerging technology with the potential for obtaining essentially noninvasive coronary arteriograms.
Electron-Beam Angiography
In the first reported studies, the investigators used contrast-enhanced, ECG-triggered, 3D electron-beam angiography (EBA) for detecting and grading coronary stenosis [14, 83–87]. Coronary EBA was first introduced in 1995 [88], and since that time, it has improved due to technologic and methodologic advances. Electrocardiographic triggering is used so that each image is obtained at the same point in diastole. An iodinated contrast agent is injected through an antecubital or a jugular vein at a rate of approximately 4 mL/s and with a total volume of 80–160 mL, depending on the scanner version used. Images are obtained during a single breath-hold, usually over a period of approximately 30 s. This entire protocol can be performed within 15–20 min. Image processing is rapid, with detailed analysis through the assessment of 2-dimensional (2D) and 3D views, as well as maximum intensity projections in which serial overlapping thin slices are viewed in unison (Figs. 14.3, 14.4, and 14.5) [89]. Compared to invasive angiography, this modality has been shown to identify significant coronary luminal narrowing (>50 % stenosis) with an overall sensitivity of 87 % and specificity of 91 % for the ten or so studies now reported [4].
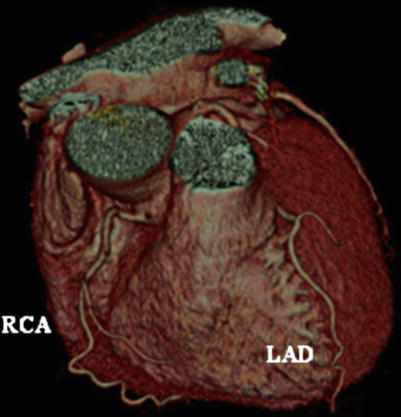
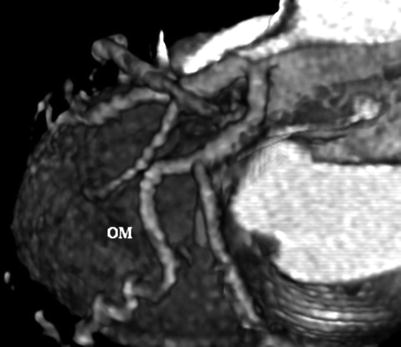
Fig. 14.3
Electron-beam angiogram (e-Speed; General Electric, San Francisco, California, USA), showing the left and right coronary arteries, without evidence of obstructive coronary artery disease. LAD left anterior descending coronary artery, RCA right coronary artery
Fig. 14.4
Electron-beam angiogram showing the obtuse marginal (OM) and circumflex arteries, without evidence of obstructive coronary artery disease
Fig. 14.5
Computed tomography angiogram showing the left and right coronary arteries, without evidence of obstructive coronary artery disease. The conus artery, right ventricular vein (RV), and acute marginal (AM) branches are well visualized. 1st Diag. first diagonal artery
In another study, Budoff and colleagues [90] documented the improvement in image quality and diagnostic accuracy offered by newer techniques. Eighty-six patients were studied, and EBA correctly classified 49 (92 %) of 53 patients as having at least 1 coronary stenosis. Overall, 103 stenoses exceeding 50 % diameter reduction were present; of these, 93 lesions were correctly detected by EBA (sensitivity: 90 %; specificity: 93 %; positive predictive value: 84 %; and negative predictive value: 96 %). Only 5 % of vessels could not be assessed, predominantly due to significant calcification.
Multidetector Computed Tomography Angiography
The explosive growth of cardiovascular imaging over the past few decades has facilitated the noninvasive detection of CAD. Although the CAC score correlates well with the disease burden, calcified plaques represent only a portion of the total atherosclerosis plaque burden [15]. With the advent of multislice computed tomography technology, coronary CTA gained the potential to provide comprehensive information regarding the location, severity, and characteristics of atherosclerotic plaque. However, early studies using 4 slices showed diminished sensitivity, as well as artifacts due to collimation. Use of 64 or more detectors, widely available since 2004, has markedly improved spatial resolution by decreasing slice thickness and allows higher sensitivity and specificity due to increased volume coverage (Figs. 14.6, 14.7, and 14.8).
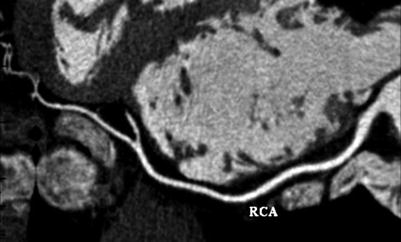
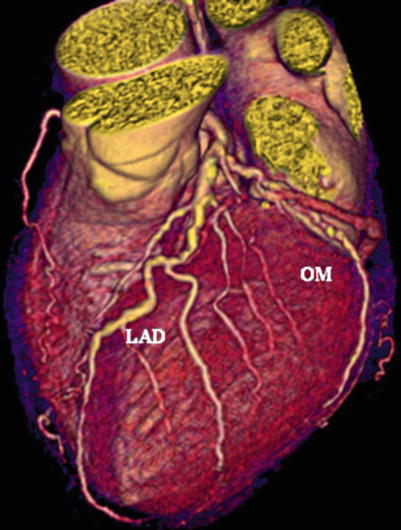
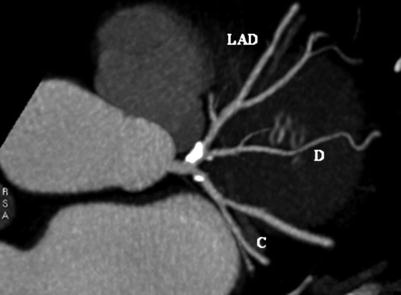
Fig. 14.6
Multidetector computed tomography image (Quantum 64; Toshiba America Medical Systems, Tustin, California, USA) showing a multiplanar reconstruction of the right coronary artery (RCA). This allows the entire vessel to be viewed in one image
Fig. 14.7
Volume-rendered image of the left coronary system. Multidetector computed tomogram image (Lightspeed 16; General Electric, Milwaukee, Wisconsin, USA) showing mild, nonobstructive disease. LAD left anterior descending artery, OM obtuse marginal artery
Fig. 14.8
Multidetector computed tomography image. Maximal-intensity projection showing significant disease at the origin of the left anterior descending artery (LAD). C circumflex coronary artery, D diagonal artery
Studies using detectors with 64 slices or more have shown an average sensitivity of more than 90 % and an average specificity of more than 90 % as well; therefore, CTA is the most accurate noninvasive test available today. In addition to enhancing diagnostic accuracy, CTA is able to differentiate plaques that are calcified, noncalcified, and mixed (containing both components) [91]. Now that the reliability of MDCT in detecting and grading coronary artery stenosis has been established, researchers are addressing the current challenge: to define the ability of this diagnostic tool to distinguish coronary artery plaques prone to rupture (vulnerable plaques) by finding evidence of plaque instability.
Image Acquisition
In MDCT, scanners produce images by rotating an X-ray tube around a circular gantry through which the patient advances on a moving table. The pitch is the speed of the table relative to the speed of the gantry rotation, which allows each cross-sectional level of the heart to be imaged during more than one cardiac cycle. The number of image slices acquired during each gantry rotation (4–320 slices) determines the overall duration of the MDCT scan. Developments in MDCT technology led to rapid advancement from the 4-slice machines available in 1998 to the 64-multislice scanners available for clinical use by 2004. The current 64-slice MDCT systems are capable of simultaneously acquiring 64 sections of the heart at the fastest gantry speed of 330 ms per rotation. The increased numbers of detectors provide greater cranio-caudal coverage per rotation, resulting in faster scan times and allowing the entire cardiac anatomy to be imaged in less than 10 s.
Like EBT, which originated decades earlier, cardiac CT is performed with ECG gating in a prospective or retrospective mode. Electrocardiography gating synchronizes image acquisition with the cardiac cycle. The optimal phase or interval for image analysis is the period during which the heart is least mobile (usually mid-diastole, focused around 70–75 % of the R-R interval) and least degraded by motion artifacts. In prospective ECG gating, scanning is initiated at a defined interval after the R wave, continues for a prespecified duration, and then stops until the same optimal period is reached in the subsequent cardiac cycle, at which time scanning resumes.
In retrospective ECG gating, images are continuously acquired throughout the cardiac cycle. The images from multiple consecutive heartbeats are then reconstructed at various percentages of the R-R interval (e.g., from 0 to 90 % of an R-R cycle at 10 % intervals). With retrospective gating, several thousand images can be acquired during a single cardiac study, allowing the interpreting physician to select the images that have the least amount of motion-related distortion before final image reconstruction is performed. Gating has the most advantages at slow heart rates (<60 beats/min), when the R-R interval is >1,000 ms and the fastest imaging protocols are used.
Cardiac motion is minimized with the use of oral and/or intravenous beta blockers before scanning, thereby reducing the heart rate and prolonging the time during the cardiac cycle at which coronary artery velocity is low. For individuals without a contraindication to beta blockade, these drugs are the medication of choice: they not only decrease the heart rate by reducing sympathetic tone but may also reduce the number of premature atrial or ventricular beats, which adversely affect the overall quality of the images. For individuals with high heart rates and contraindications to beta blockers (i.e., allergy or bronchial asthma), calcium-channel blockers with chronotropic effects are used (diltiazem or verapamil). Another crucial element for obtaining high-quality coronary images is to maximally dilate coronary vessels by administering nitroglycerin (sublingual tablets or spray). Respiratory motion is excluded by performing the scan during a breath-hold.
Coronary CTA requires the intravenous administration of an iodinated contrast medium (which is contraindicated in persons with renal impairment). Approximately 50–100 mL of contrast medium is necessary for adequate coronary artery enhancement. The accurate timing of image acquisition relative to the contrast injection is a major determinant of overall image quality. A test bolus or bolus-tracking technique is used to optimize this timing by determining the amount of time necessary to achieve peak enhancement in the aorta.
Advancements in MDCT technology have led to shorter scan times, a reduced breath-hold duration, smaller intravenous contrast injections, and decreased motion-related artifacts, resulting in lower radiation exposure and improved diagnostic accuracy.
Image Interpretation
With cardiac CTA, the coronary vasculature is evaluated through axial images, multiplanar (coronal, sagittal, or oblique) reformations, and 3D datasets constructed from information obtained at specific phases during the cardiac cycle. Maximum-intensity-projection images allow evaluation of longer segments of the coronary vessels, but these images can be limited by overlapping structures adjacent to the artery of interest. Curved multiplanar reformations are reconstructed on a plane to fit a curve and allow the entire vessel to be displayed in a single image. Three-dimensional volume rendering is useful for selecting images with the least motion artifact and for assessing the relationships among different anatomic structures. Most assessments of plaque, however, have been qualitative; there is not yet any reliable software that can reproducibly quantitate the soft or mixed plaque burden and that is easy to use.
Recently, three large multicenter studies comparing 64-channel coronary CTA with conventional angiography have been completed. In the first study, Assessment by Coronary Computed Tomographic Angiography of Individuals Undergoing Invasive Coronary Angiography (ACCURACY), the investigators prospectively enrolled 245 patients with typical or atypical chest pain who were referred for invasive coronary angiography at 16 (predominantly nonacademic) sites in the United States [92]. On a per-patient basis, the sensitivity of coronary CTA was 94–95 %, depending on the cutpoint chosen to represent a positive invasive coronary angiographic result, and the specificity was 82 %. The post-test probability after a negative test (negative predictive value) was 99 % for both disease definitions, but the post-test probability after a positive test ranged from 48 % (with a disease prevalence of 14 %) to 64 % (with a disease prevalence of 25 %). The Coronary Artery Evaluation Using 64-Row Multidetector Computed Tomography Angiography (CORE 64) study was conducted at nine international centers and involved 316 symptomatic patients, age 40 years or more, with suspected or known coronary disease. Patients with calcium scores of <600 were referred for invasive coronary angiography; 291 (92 %) of them completed coronary CTA before undergoing invasive coronary angiography [93]. The prevalence of obstructive CAD as assessed by quantitative coronary angiography was 56 %. More than 99 % of 3,782 coronary segments were suitable for quantitative evaluation by CT. On a per-patient– based analysis, the sensitivity of quantitative coronary CTA for detecting a ≥50 % diameter stenosis was 0.85, and the specificity was 0.90. The post-test probability of significant CAD after a positive test was 0.91, while the post-test probability that disease was truly absent after a negative test was 0.83. This method was similar to invasive coronary angiography in its ability to identify, based on the presence of ≥50 % obstructive stenosis, patients who were subsequently referred for revascularization.
Three university hospitals in the Netherlands prospectively enrolled 433 symptomatic patients age 50–70 years who were referred for invasive coronary angiography [94]. The prevalence of significant coronary obstructive disease was 68 %; sensitivity for CTA was 99 % with a specificity of 64 %. Only two patients with single-vessel disease were missed.
Overall, core-laboratory and multicenter studies, even those involving blinded investigators and multiple vendors, continue to confirm that CTA has a 99 % negative predictive power for ruling out obstructive CAD in symptomatic persons. Therefore, CTA is the most sensitive noninvasive test available for this purpose.
Computed Tomography Angiography After Revascularization
Because CT angiography may also play a role in the assessment and follow–up observation of patients who have undergone coronary interventions, this method could potentially replace some invasive angiographic procedures. The utilization of CTA to detect coronary artery bypass graft (CABG) patency was reported as early as 1986 [95]. Saphenous vein grafts, which are generally of large caliber and have minimal cardiac motion, are especially well suited for noninvasive imaging with CT angiography (Figs. 14.9 and 14.10). Recent studies of both CT techniques have revealed a sensitivity of 92–100 % and specificity of 91–100 % for establishing the patency of saphenous vein grafts as compared to coronary angiography [96–98]. These studies showed a sensitivity of 92–100 % and a specificity of 94–100 % for establishing the patency of the left internal mammary artery.
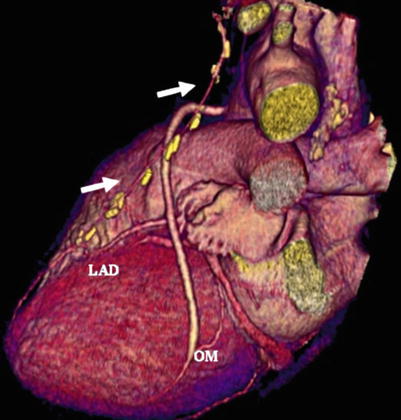
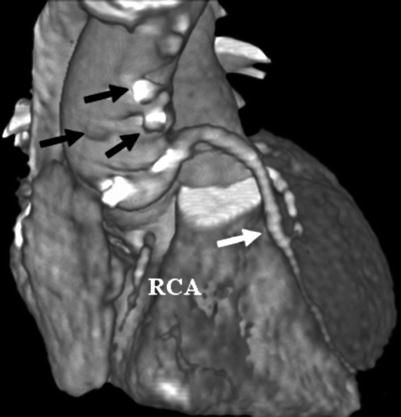
Fig. 14.9
Noninvasive angiogram revealing patent saphenous vein grafts to the first obtuse marginal artery (OM) and a patent internal mammary artery (white arrows) to the left anterior descending coronary artery (LAD)
Fig. 14.10
Noninvasive angiogram revealing multiple closed saphenous vein grafts (black arrows) and a right coronary artery occlusion (RCA) with a patent saphenous vein graft to the left anterior descending artery (white arrow)
In patients who experience chest pain after stenting or angioplasty, visualization of the angioplasty site to assess for restenosis is often required. A noninvasive method to visualize the site of angioplasty could potentially be used for less typical presentations of acute closure (without typical angina or ECG changes suggestive of ischemia). Computed tomography angiography has been shown to permit imaging of the coronary arteries and detection of high-grade restenosis after percutaneous coronary intervention (PCI). The widespread utilization of metal stents during revascularization procedures initially limited clinical assessment of the involved arterial segment by MDCT and magnetic resonance angiography. Pump and colleagues [99] reported a sensitivity of 78 % (18 of 23 stenoses detected) and a specificity of 98 % (189 of 193 stents correctly assessed to be free of stenosis) for the detection of significant in-stent restenosis by flow measurements. Currently, due to improved spatial and temporal resolution with more modern scanners, the only difficulty in imaging stents (with scatter from the metal, coupled with motion artifacts) involves those with small interior diameters (<2.5 mm) (Fig. 14.11) [100]. Newer studies consistently show higher sensitivities and specificities. Abdelkarim et al. [101] demonstrated a sensitivity of 90.9 % and specificity of 95.2 %; the optimal stent diameter cutoff value was ≥2.5 mm, with a sensitivity of 91.8 % and specificity of 93.8 %. Thus, the accuracy of evaluating moderate-to-large stents is similar to that of native coronary assessment with MDCT. Newer CT advances, including high- definition scanners (HD750 Discovery; GE Healthcare, Milwaukee, Wisconsin) with improved spatial resolution, should improve accuracy even more.
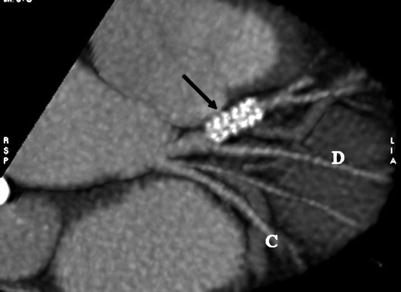
Fig. 14.11
Noninvasive angiogram using Lightspeed 16 multidetector computed tomography (General Electric), showing a stent (arrow) in the left anterior descending artery. It is not possible to determine whether the stent is patent or partially occluded. C circumflex coronary artery, D diagonal artery
Assessment of Noncalcified Plaque
The ability of CT angiography to visualize and characterize “soft” noncalcific coronary plaque is an emerging area of interest (Fig. 14.12). Autopsy and coronary intravascular ultrasound (IVUS) studies have shown that angiographically “normal” coronary artery segments may contain a significant amount of atherosclerotic plaque [102]. Coronary IVUS allows direct, 360° visualization of the coronary atheroma within the vessel wall and identifies both plaque distribution and composition [103]. In recognizing these smaller plaques, however, the utility of IVUS versus coronary angiography is somewhat limited by a higher procedural complication rate related to IVUS’s more invasive nature.