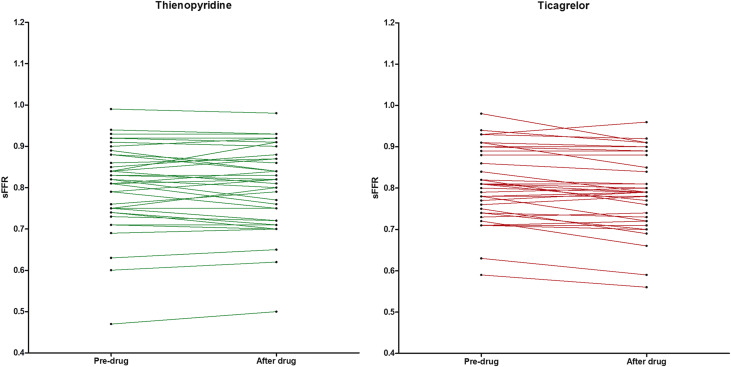
Ticagrelor loading dose (LD) increases adenosine plasma levels, which might interfere with fractional flow reserve (FFR) assessment because the latter is based on adenosine-induced hyperemia. In a prospective study, consecutive patients who underwent coronary angiography with at least 1 de novo stenosis >50% and <90% in severity amenable to intervention underwent FFR assessment using intravenous adenosine 140 μg/kg/min for 3 minutes. Patients were subsequently randomized to either ticagrelor 180 mg (n = 38) or control thienopyridine (n = 38) (prasugrel 60 mg [n = 28] or clopidogrel 600 mg [n = 10]), followed by a second FFR assessment of the target lesion 2 hours after drug. Pre-drug, steady hyperemia FFR (sFFR, median, first to third quartiles) was 0.82 (0.75 to 0.88) and 0.81 (0.75 to 0.88), p = 0.9, whereas post-drug, 0.82 (0.72 to 0.87) and 0.79 (0.73 to 0.86), p = 0.5, in thienopyridine and ticagrelor-treated patients, respectively. The primary end point of percent relative change in sFFR between pre- and post-drug periods was greater in ticagrelor- than thienopyridine-treated patients, −1.24 (−5.54 to 0.0) versus −0.51 (−3.68 to 3.21), p = 0.03, respectively. Absolute change in sFFR between pre- and post-drug periods was marginally higher in ticagrelor- than thienopyridine-treated patients −0.01 (−0.04 to 0.0) versus −0.005 (−0.03 to 0.02), p = 0.048, respectively. Reclassification of treatment decision at the sFFR ≤0.80 cutoff post-drug occurred in 6 (15.8%) versus 5 (13.2%) of ticagrelor- and thienopyridine-treated patients, respectively. In conclusion, after ticagrelor LD, an absolute and relative reduction in sFFR compared with thienopyridine LD is observed. Administration of ticagrelor should be considered as a potential source, albeit minor, of FFR variability.
Fractional flow reserve (FFR) is an established invasive method for assessing the physiological significance of a coronary artery stenosis. The conditions of stable hyperemia required for FFR measurement are usually achieved by adenosine, an important endogenous regulator of coronary blood flow during both stress and ischemia. Ticagrelor is a novel non-thienopyridine antiplatelet agent with adenosine-like molecular structure. In patients with an acute coronary syndrome (ACS), a beneficial effect on mortality has been reported with ticagrelor compared with clopidogrel, partially attributed to its possible adenosine-mediated pleiotropic action. Studies in healthy volunteers and in patients with ACS after percutaneous coronary intervention (PCI) also revealed a differential coronary blood flow velocity response during increasing doses of adenosine in ticagrelor compared with placebo- or prasugrel-treated subjects. Moreover, increased plasma adenosine levels have been described 6 hours after ticagrelor loading. Hence, it is reasonable to speculate that the degree of hyperemia obtained with adenosine infusion may be greater in patients on ticagrelor. In the present study, we aimed to assess possible differential effects of loading with ticagrelor compared with a thienopyridine on FFR measurement.
Methods
In this prospective, single-center, randomized study of parallel design, consecutive patients with stable coronary artery disease or ACS who underwent coronary angiography were considered as candidates if they presented with an angiographically significant de novo stenosis (>50% and <90% diameter stenosis by visual assessment) in at least 1 major epicardial coronary artery amenable to PCI. Exclusion criteria were age >80 years, a history of coronary artery bypass surgery, acute myocardial infarction within the previous 5 days, previous intracranial hemorrhage, creatinine clearance <30 ml/hour, contraindication to adenosine, left main disease, anatomy suitable for coronary artery bypass surgery, angiographically visible thrombus at a target lesion, extremely tortuous coronary arteries, left ventricular ejection fraction <40%, previous Q-wave myocardial infarction in the area of target vessel or presence of collaterals, primary myocardial or valvular heart disease, heart failure as defined by the New York Heart Association class III or IV, hypotension (blood pressure <90 mm Hg), significant arrhythmia (e.g., excessive premature ventricular contractions or atrial fibrillation), tachycardia (>120 beats/min), bradycardia (<50 beats/min), previous treatment with ticagrelor or prasugrel, xanthine or xanthine derivatives consumption, or smoking within the previous 24 hours. A history of stroke/transient ischemic attack, body weight <60 kg, and age ≥75 years were also contraindications to prasugrel. All patients were on aspirin (100 mg).
Coronary angiography was performed with the femoral approach. Heparin was administered at the beginning of the procedure (maximum 5,000 U), and nonionic contrast material was used for all patients. For each patient, only 1 lesion was assessed by FFR. In cases of suitable lesions in >1 vessel, the left anterior descending artery was preferably selected. Intracoronary nitroglycerin (0.3 mg) was administered before coronary angiography and before each FFR measurement, except in the case of blood pressure <100 mm Hg. A 0.014-inch high-fidelity pressure-recording guidewire (PressureWire; St. Jude Medical Inc., St. Paul, Minnesota) was introduced through a 6 Fr end-hole guiding catheter into the coronary artery. Standard techniques of calibration/equalization between pressures were used. The pressure wire was advanced into the coronary artery with the pressure sensor placed beyond the lesion site under study. Infusion of adenosine (140 μg/kg/min) was given through a central femoral vein using a rate-controlled infusion pump for 3 minutes, with continuous pressure signals recording for 30 seconds before and throughout the infusion. The response to adenosine was confirmed by changes in heart rate and blood pressure and development of typical symptoms. After adenosine discontinuation, a pullback recording was performed to exclude wire drift.
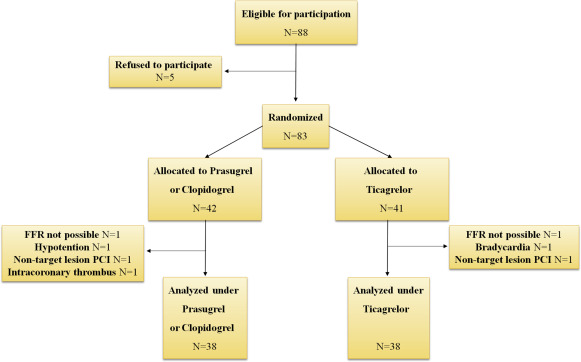
On completion of the first part of the protocol, patients were randomly assigned to receive either 180 mg of ticagrelor loading dose (LD) or 60 mg of prasugrel LD blindly to the interventional cardiologist performing the FFR. In case of a contraindication to prasugrel, 600 mg of clopidogrel were administered. Thereafter, femoral sheaths were heparinized and sutured in place, and patients were moved to the catheterization laboratory recovery room for monitoring. Approximately 2 hours after ticagrelor or thienopyridine LD, heparin and intracoronary nitroglycerin were administered as mentioned earlier, and the sequence of FFR measurements was repeated. The same pressure-recording guidewire was used in all but 2 cases, where a new wire had to be selected. The same angiographic view was used to ensure the exact same position of the pressure-monitoring guidewire. After completion of study protocol, patients received ad hoc PCI, medical therapy, or coronary artery bypass surgery on the basis of the overall findings. Intervention to a nontarget lesion was not allowed before FFR measurements completion. A study flow chart is shown in Figure 1 .
In a blinded fashion, offline analysis was performed to calculate aortic (Pa) and distal (Pd) intracoronary pressures, at baseline (before adenosine infusion), peak, and steady-state hyperemia. Peak hyperemia FFR (pFFR) was defined as the lowest Pd/Pa ratio within the first 60 seconds of adenosine infusion. Steady-state hyperemia FFR (sFFR) was calculated as the average of Pd/Pa values recorded per 3 consecutive heart beats during the hyperemic plateau. The latter was determined by visual inspection of each hemodynamic trace. Lowest FFR (lFFR) was defined as the value provided by the automated FFR console at the end of adenosine infusion. The time from infusion onset to reach pFFR and lFFR was recorded. Pd/Pa ratio was measured every 5 seconds during adenosine infusion to create an area under the curve (AUC) for each patient. Reproducibility of FFR values between pre- and post-drug measurements was assessed in thienopyridine-receiving patients.
The prespecified primary end point was the percent relative change in sFFR, measured as (sFFR post-drug − sFFR pre-drug) × 100/sFFR pre-drug, between the 2 treatment arms. Secondary end points were the percent relative change in pFFR, lFFR, time to pFFR, time to lFFR, AUC of Pd/Pa ratio, and baseline Pd/Pa ratio. Additional secondary end points were the absolute differences in the earlier mentioned parameters between pre- and post-drug periods. Differences in secondary end points were assessed between the 2 treatment arms.
Based on pilot data analysis, we hypothesized that ticagrelor administration would produce a decrease in sFFR compared with thienopyridine, with a percent relative change of −2.0 and 0.0, respectively, with an estimated SD of 3.5 in both groups. Choosing a power of 80% and using a 2-sided Mann-Whitney test (assuming that the actual distribution is double exponential) at an alpha-level of 0.05, at least 34 patients in each group would be required to reach statistical significance.
Categorical data are presented as frequencies and group percentages. Continuous data with normal distribution are presented as means ± SD or medians (first to third quartile) in case of abnormal distribution. Two-sample t test and the Fisher’s exact test were used for comparison of normally distributed continuous and categorical data, respectively. Continuous data without normal distribution were analyzed with Mann-Whitney test. Individual AUCs of Pd/Pa versus time during the 3-minute adenosine infusion were calculated by the linear trapezoidal rule. Correlation and reproducibility of sFFR measurements in the control group were evaluated using Pearson correlation coefficient and the Bland-Altman method for assessing the limits of agreement between repeated measurements. All tests were 2 tailed, and statistical significance was considered for p values <0.05. Analyses were performed using SPSS for Windows (version 16.0; SPSS Inc., Chicago, Illinois) and GraphPad Prism v.5 (GraphPad Software, Inc., La Jolla, California).
The study protocol was approved by the institutional review board and was conducted according to the principles of the Declaration of Helsinki. All patients provided written informed consent before enrollment. The study has been registered at the clinicaltrials.gov (unique identifier: NCT02108808 ).
Results
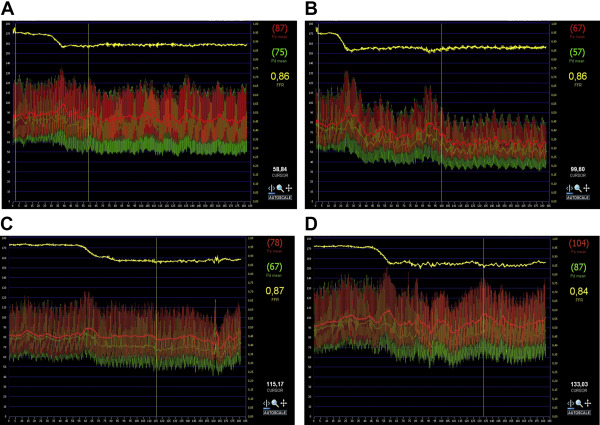
Of the 83 randomized patients, 7 did not complete all study’s measurements and excluded from further analysis ( Figure 1 ). Finally, we analyzed 76 patients who were randomized to either ticagrelor LD or control thienopyridine LD (prasugrel n = 28 and clopidogrel n = 10). Among them, 19 and 20 patients were receiving maintenance dose of clopidogrel in ticagrelor or thienopyridine group, respectively. There were no significant differences in patients’ demographic and clinical characteristics between groups ( Table 1 ). Overall, a functionally significant lesion, defined as sFFR ≤0.80, was present in 32 patients (42.1%) at baseline and in 37 patients (48.7%) 2 hours after drug. A representative illustration of Pd/Pa tracing produced during 3-minute adenosine infusion recordings, before study drug administration and 2 hours after thienopyridine or ticagrelor LD is shown in Figure 2 .
| Variables | Prasugrel or Clopidogrel (N=38) | Ticagrelor (N=38) | p-value |
|---|---|---|---|
| Men | 36(95%) | 29(76%) | 0.05 |
| Age (years) | 64.7±10.1 | 63.6±9.0 | 0.6 |
| Weight (kg) | 83.2±13.7 | 81.4±15.1 | 0.6 |
| Body mass index (Kg/m 2 ) | 28.3±4.1 | 27.8±4.3 | 0.7 |
| Hyperlipidemia | 23(61%) | 24(63%) | 1.0 |
| Hypertension | 23(61%) | 19(50%) | 0.5 |
| Diabetes mellitus | 9(24%) | 3(8%) | 0.1 |
| Current smoker | 14(37%) | 14(37%) | 1.0 |
| Prior myocardial infarction | 12(32%) | 8(21%) | 0.4 |
| Prior percutaneous coronary intervention | 15(40%) | 8(21%) | 0.1 |
| Clinical presentation | 0.4 | ||
| Unstable angina pectoris | 6(16%) | 10(26%) | |
| ST-elevation myocardial infarction | 3(8%) | 1(3%) | |
| Non ST-elevation myocardial infarction | 13(34%) | 16(42%) | |
| Myocardial ischemia in provocative test | 16(42%) | 11(29%) | |
| No. of coronary arteries narrowed | 0.5 | ||
| 1 | 16(42%) | 14(37%) | |
| 2 | 17(45%) | 15(40%) | |
| 3 | 5(13%) | 9(24%) | |
| Coronary narrowing location | 0.9 | ||
| Left anterior descending | 24(63%) | 23(61%) | |
| Left circumflex | 6(16%) | 5(13%) | |
| Right | 8(21%) | 10(26%) | |
| Diameter stenosis (%) | 72.5±10.5 | 71.8±10.5 | 0.8 |
| Lesion quantitative coronary angiography | |||
| Reference diameter (mm) | 2.7±0.8 | 2.9±0.6 | 0.5 |
| Minimum lumen diameter (mm) | 1.1±0.4 | 1.2±0.3 | 0.3 |
| Stenosis (%) | 59.2±11.3 | 57.1±10.1 | 0.4 |
| Lesion length (mm) | 12.3±5.1 | 12.5±6.3 | 0.9 |
| Medication | |||
| Statin | 34(90%) | 33(87%) | 1.0 |
| Calcium channel blockers | 12(32%) | 6(16%) | 0.2 |
| Nitrate | 8(21%) | 9(24%) | 1.0 |
| Beta-blocker | 29(76%) | 26(68%) | 0.6 |
| Proton-pump inhibitors | 21(55%) | 22(58%) | 1.0 |
| Angiotensin converting enzyme inhibitor | 16(42%) | 16(42%) | 1.0 |
| Angiotensin receptor blocker | 8(21%) | 7(18%) | 1.0 |
| Insulin | 2(5%) | 1(3%) | 1.0 |
| Oral hypoglycemic agent | 5(13%) | 1(3%) | 0.2 |
| Hematocrit (%) | 41.5±4.9 | 42.4±4.8 | 0.4 |
| Platelets (x1000/mm 3 ) | 214.0±71.0 | 245.9±98.5 | 0.1 |
| Creatinine Clearance (ml/min) (Cockroft-Gault formula) | 86.1±29.4 | 88.4±24.4 | 0.7 |
Baseline Pd/Pa ratio and FFR measurements by treatment group, for pre- and post-drug periods, are listed in Table 2 and Figure 3 . During pre-drug period, no significant differences were observed in baseline Pd/Pa ratio, sFFR, pFFR, lFFR, time to pFFR, time to lFFR, or AUC of Pd/Pa ratio, between groups. During post-drug period, no significant differences were found in analyzed parameters between groups. Absolute and percent relative changes in baseline Pd/Pa ratio, sFFR, pFFR, lFFR, time to pFFR, time to lFFR, and AUC of Pd/Pa ratio between pre- and post-drug periods, by treatment group are depicted in Tables 3 and 4 , respectively. The absolute change in sFFR, between pre- and post-drug periods, was marginally higher in ticagrelor- than thienopyridine-treated patients ( Table 3 ). The primary end point of percent relative change in sFFR, between pre- and post-drug periods, was significantly higher in ticagrelor- than thienopyridine-treated patients ( Table 4 ).
| Prasugrel/ Clopidogrel (N=38) | Ticagrelor (N=38) | p-value | |
|---|---|---|---|
| Pre-drug period | |||
| Baseline Pd/Pa ratio | 0.94 (0.88 to 0.96) | 0.94 (0.90 to 0.98) | 0.9 |
| Steady hyperemia fractional flow reserve | 0.82 (0.75 to 0.88) | 0.81 (0.75 to 0.88) | 0.9 |
| Peak hyperemia fractional flow reserve | 0.81 (0.73 to 0.88) | 0.80 (0.74 to 0.90) | 0.9 |
| Lowest fractional flow reserve | 0.79 (0.72 to 0.86) | 0.79 (0.73 to 0.86) | 0.9 |
| Time to peak hyperemia fractional flow reserve (sec) | 52 (45 to 57) | 53 (41 to 55) | 0.5 |
| Time to lowest fractional flow reserve (sec) | 77 (56 to 134) | 105 (49 to 153) | 0.7 |
| AUC of Pd/Pa ratio | 155.1 (142.1 to 162.4) | 152.8 (140.1 to 164.0) | 0.5 |
| Post-drug period | |||
| Baseline Pd/Pa | 0.94 (0.89 to 0.97) | 0.94 (0.89 to 0.95) | 0.9 |
| Steady hyperemia fractional flow reserve | 0.82 (0.72 to 0.87) | 0.79 (0.73 to 0.86) | 0.5 |
| Peak hyperemia fractional flow reserve | 0.82 (0.69 to0.89) | 0.79 (0.73 to 0.87) | 0.5 |
| Lowest fractional flow reserve | 0.78 (0.68 to 0.84) | 0.77 (0.71 to 0.83) | 0.9 |
| Time to peak hyperemia fractional flow reserve (sec) | 50 (39 to 58) | 52 (43 to 57) | 0.6 |
| Time to lowest fractional flow reserve (sec) | 81 (55 to 111) | 94 (57 to 137) | 0.3 |
| AUC of Pd/Pa ratio | 154.2 (140.3 to 162.0) | 149.8 (139.1 to 160.5) | 0.4 |