The aim of our study was to evaluate 3-dimensional (3D) color Doppler proximal isovelocity surface area (PISA) as a tool for quantitative assessment of mitral regurgitation (MR) against in vitro and in vivo reference methods. A customized 3D PISA software was validated in vitro against a flowmeter MR phantom. Sixty consecutive patients, with ≥mild MR of any cause, were recruited and the regurgitant volume (RVol) was measured by 2D PISA, 3D peak PISA, and 3D integrated PISA, using transthoracic (TTE) and transesophageal echocardiography (TEE). Cardiac magnetic resonance imaging (CMR) was used as reference method. Flowmeter RVol was associated with 3D integrated PISA as follows: y = 0.64 x + 4.7, r 2 = 0.97, p <0.0001 for TEE and y = 0.88 x + 4.07, r 2 = 0.96, p <0.0001 for TTE. The bias and limit of agreement in the Bland–Altman analysis were 6.8 ml [−3.5 to 17.1] for TEE and −0.059 ml [−6.2 to 6.1] for TTE. In vivo, TEE-derived 3D integrated PISA was the most accurate method for MR quantification compared to CMR: r 2 = 0.76, y = 0.95 x − 3.95, p <0.0001; 5.1 ml (−14.7 to 26.5). It was superior to TEE 3D peak PISA ( r 2 = 0.67, y = 1.00 x + 6.20, p <0.0001; −6.3 ml [−33.4 to 21.0]), TEE 2D PISA ( r 2 = 0.54, y = 0.76 x + 0.18, p <0.0001; 8.4 ml [−20.4 to 37.2]), and TTE-derived measurements. It was also most accurate by receiver operating characteristic analysis (area under the curve 0.99) for the detection of severe MR, RVol cutoff = 48 ml, sensibility 100%, and specificity 96%. RVol and the cutoff to define severe MR were underestimated using the most accurate method. In conclusion, quantitative 3D color Doppler echocardiography of the PISA permits a more accurate MR assessment than conventional techniques and, consequently, should enable an optimized management of patients suffering from MR.
Mitral regurgitation (MR) is second to aortic stenosis as valvular heart disease requiring surgical treatment. Assessment of MR severity is of great importance to allow optimal timing for surgery but, so far, consists of semiquantitative grading instead of actual quantitative measurement. Accordingly, MR is recommended to be graded on the basis of color Doppler–derived vena contracta (VC) sizing and transmitral and pulmonary vein pulsed-wave Doppler flow velocity profiles. The theoretically quantitative MR measurement method of effective regurgitant orifice area (EROA) and regurgitant volume, using 2-dimensional (2D) proximal isovelocity surface area (PISA), is hampered by erroneously assuming a circular regurgitant orifice and a hemispheric PISA. The latter is inherent in the actually 1-dimensional PISA radius measurement requiring the assumption of a geometrical PISA instead of its direct measurement. Consequently, the availability of 3-dimensional (3D) color Doppler echocardiography with its potential of directly measuring the PISA is appealing. So far, there have been only very limited, partly uncontrolled attempts to evaluate the promising instrument of 3D PISA for MR quantification. Using both transthoracic echocardiography (TTE) and transesophageal echocardiography (TEE), the aim of our study was to evaluate 3D color Doppler PISA as a tool for quantitative measurement of MR of any kind against in vitro and in vivo reference methods.
Methods
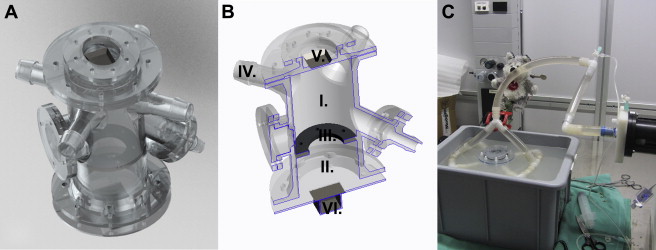
A test bench ( Figure 1 ) was 3D printed using the plastic material WaterShed (DSM, Elgin, IL). The phantom consisted of a “left ventricle” (LV) and “left atrium” (LA), separated by an annulus, where different regurgitant orifices were attached ( Figure 1 ). The LV was connected to a pulsatile piston pump (SuperPump head; Vivitro Labs Inc., Victoria, CA) mimicking the cardiac cycle with a frequency of 60/min. A blood analogue consisting of 40% glycerin, 60% water, and 1% cornstarch (ultrasound scatterers) was used in an open system ( Figure 1 ). Four different regurgitant orifice shapes (circular and elliptical with different long- to short-axis ratio: 1 × 2, 1 × 3, and 1 × 4), each with 3 different areas (15, 30, and 50 mm 2 ) were used. Increasing stroke pump amplitudes were selected, and the main tube flow rate was recorded by a Doppler flowmeter: Transonic 16PXL (Transonic System Inc., Ithaca, NY). The stroke volume (SV) was calculated on the basis of flow velocity time integral. To permit a triggered acquisition, an electrocardiographic (ECG) signal was generated (Agilent 33220A Function Waveform Generator; Agilent Technologies, Santa Clara, CA).
An iE33 Doppler echocardiography platform (Phillips Healthcare, Zurich, Switzerland) was used for the acquisition of the TEE (X7-2t transducer) and TTE (X5-1 transducer) color Doppler pyramidal volumes. All the loops were recorded using ECG-triggered multiple beats (6 beats). A Nyquist limit permitting an optimal visualization of the PISA, usually from 20 to 40 cm/s, was chosen. The base of the PISA on the mitral valve was set on 2 perpendicular image planes. After suppression of the black and white component, the volume was cut in 16 slices from top to base of the PISA using the iSlice module of QLAB (Philips Healthcare, Andover, MA; Figure 2 ). The exported *.tif files were then imported in our custom software (MATLAB, MathWorks Inc., Natick, MA) for analysis.
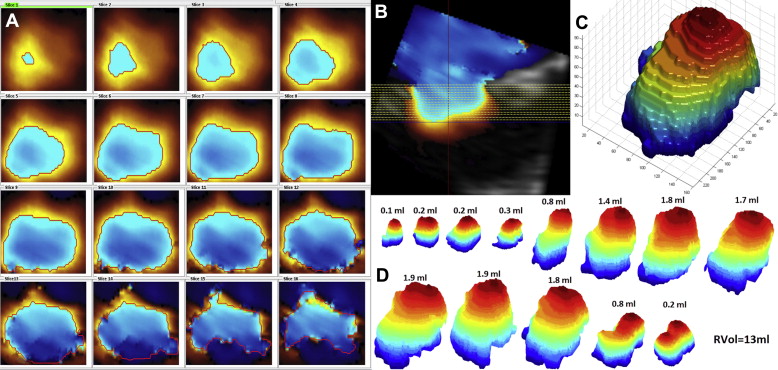
The software was originally programmed to analyze TEE volumes. Therefore, the QLAB option “color invert” was activated for the TTE volumes. Usually *.tif pictures are coded using 256 different levels of red, green, and blue; the first aliasing (red to blue shift) was detected by a function evaluating the difference in blue and red levels inside and outside the PISA. The detected borders were then marked with a red line on each slice ( Figure 2 ). Sometimes, color flow velocity signals inside the ventricle also showed aliasing and were incorrectly recognized as PISA segments; this error was correctable by clicking inside the correctly detected border(s). After detection and correction, the pixels inside the PISA borders were converted into white-on-black surfaces, and the latter were stacked up to build a 3D object. The 16-voxel-thick 3D object was then “stretched,” along the z axis, to reach the real thickness of the PISA shape, and the “isosurface” function of MATLAB was used to compute a triangular mesh onto this object ( Figure 2 ). Finally, the surface of the mesh was calculated.
All 3D PISA shapes visible during systole were measured to calculate the integrated RVol ( Figure 2 ). For each PISA i , the regurgitant flow rate (Qr i = PISA i × Nyquist limit i ) and the regurgitant volume (RVol i = Qr i × 1/volume rate) were computed. The whole regurgitant volume was calculated as RVol = ∑ i = 1 n RVol i (n = number of PISA extracted). Alternatively, RVol was estimated using the biggest mitral regurgitant 3D PISA, V max , and VTI as obtained by continuous wave Doppler.
The echocardiography database at our institution was screened for candidates, from January 2011 to December 2012, and if eligible (age ≥18 years, ≥mild valve MR, stable cardio pulmonary conditions, sinus rhythm), they were recruited by telephone. During the in vivo study, from January 2013 to October 2013, eligible patients were also recruited in our outpatient clinic. Exclusion criteria were defined as oxygen saturation while breathing ambient air <93%, dyspnea New York Heart Association IV, contraindication for transesophageal echocardiography, and contraindication for cardiac magnetic resonance imaging (CMR). The study was approved by the ethics committee of the Kanton of Bern, Switzerland, and all study subjects gave written informed consent to participate in the study.
After inclusion, 3 examinations, TEE, TTE, and CMR, were performed on the same day, the patients fasting for the duration of the entire procedure. Using TEE and TTE, a standard 2D evaluation of the MR was carried out according to the European Association of Cardiovascular Imaging guidelines; volumes focused on MR-PISA were acquired using ECG-triggered multiple beats (6 beats), during a short apnea. The postprocessing of the color Doppler volumes acquired in vivo followed the same methods used for the in vitro volumes. The 2 evaluators were blinded to the CMR results.
ECG-gated CMR was performed using a 3.0-T CMR system (Magnetom Skyra or Magnetom Verio; Siemens Healthcare, Erlangen, Germany) and 36-channel coils. LV short-axis cine images from base to apex were acquired with cine steady-state free precession sequence with 8-mm slice thickness, no gap, and retrospective ECG-gating under breath-hold. Standard long-axis planes of the LV and the LV outflow tract (LVOT) or ascending aorta were assessed as recommended. Through-plane breath-hold phase-contrast flow velocity encoding sequences of the cross-sectional ascending aorta at the level of the right pulmonary artery were acquired. The encoding velocity value was adjusted according to the velocity of blood flow starting from 150 cm/s. Ventricular volumetric quantification and aortic flow analysis were performed immediately after CMR image acquisition by 2 experienced observers, blinded to the echocardiographic results, using dedicated and commercially available software (Argus version 4.01, Syngo MR B13; Siemens Healthcare, Erlangen, Germany). LV end-diastolic and end-systolic volumes and the difference between them (LV SV) were obtained using the Simpson method by manually tracing the endocardial borders in each ventricular slice at end-diastole and end-systole including papillary muscles. For ascending aortic flow volumes, aortic cross-sectional areas were traced on the magnitude image in all 25 frames of the RR interval. MR volume was calculated as LV SV-aortic forward volume.
To evaluate the reproducibility of our semiautomatic method for the measurement of 3D integrated PISA, the TEE volumes of the first 30 patients were evaluated by 2 independent observers and the TEE volumes of the last 30 patients were reevaluated by the same observer 2 months after the first measurements.
Data were analyzed using SPSS 21 (IBM Corporation, Armonk, NY), XLSTAT 2014 (Addinsoft; New York, NY), and MedCalc 13.0.1.0 (MedCalc Software bvba, Ostend, Belgium). Normality distribution of continuous variables was analyzed using the Kolmogorov–Smirnov test. Continuous data were expressed as mean ± SD, and categorical data were expressed as absolute number and percentage. Mean values of RVol as measured by the different techniques were compared by analysis of variance for repeated measures with Bonferroni post hoc analysis. Categorical data were analyzed using the chi-square test. Pearson correlation coefficient, linear regression, and Bland–Altman bias and limit of agreement (LOA [−1.96 SD to +1.96 SD]) were used to estimate the agreement between the different imaging modalities. Intraobserver and interobserver variabilities were assessed by Pearson correlation coefficient, Bland–Altman bias and LOA, and the coefficient of variation. The accuracy of the techniques was evaluated by receiver operating characteristic (ROC) analysis and the cutoffs with the biggest area under the ROC curve (AUC) were chosen.
Results
Sixty-four regurgitant volumes were simulated (12 to 62 ml/beat) and evaluated with both echocardiographic modalities using integrated 3D PISA. RVol by flowmeter was associated with Doppler-derived RVol as follows: y = 0.64 x + 4.7, r 2 = 0.97, p <0.0001 for TEE and y = 0.88 x + 4.07, r 2 = 0.96, p <0.0001 for TTE. The LOAs in the Bland–Altman analysis were 6.8 ml (−3.5 to 17.1) for TEE, and −0.059 ml (−6.2 to 6.1) for TTE. TEE significantly underestimated the RVol when compared to the flowmeter (26 ± 9 vs 32 ± 14 ml, p <0.0001), whereas the mean value of RVol evaluated by TTE was not different from that by flowmeter (33 ± 13 vs 33 ± 14 ml, p = 1).
Sixty patients suffering from chronic MR were included (baseline characteristics see Table 1 ), 75% had organic MR: prolapse (n = 25), flail leaflet (n = 5), degenerative (n = 12), cleft anterior leaflet (n = 1), status after mitral valve repair (n = 2), dilatation of the mitral annulus (n = 9), and papillary muscle dysfunction (n = 6). The 3 examinations were performed without complication in all participants during a maximum period of 4 hours. Blood pressure was not different between TTE and TEE (142 ± 21/75 ± 12 vs 141 ± 21/75 ± 12 mm Hg, respectively, p = 0.434). SV across the LVOT during TTE and in the aorta using CMR were not significantly different (72 ± 14 vs 68 ± 21 ml, p = 0.054). Heart rate was significantly higher during TEE than TTE and CMR (66 ± 10 vs 63 ± 10 vs 62 ± 10 per minute, respectively, p = 0.009).
| mean ± SD | ||
|---|---|---|
| n (%) | ||
| Patients’ characteristics | ||
| Age (years) | 67±16 | |
| Men | 39 (65%) | |
| Body mass index (kg/m²) | 24.7±3.5 | |
| Cardiac magnetic resonance imaging | ||
| Left ventricle ejection fraction (%) | 59±12 | |
| Left ventricle end diastolic volume index (ml/m²) | 99±30 | |
| Left ventricle mass index (g/m²) | 70.8±15.5 | |
| Cardiac index ∗ (l/min/m²) | 2.3±0.5 | |
| Regurgitant volume (ml) | 36±19 | |
| Mitral regurgitation severity | Regurgitant volume | |
| mild | <30 ml | 25 (42%) |
| moderate | 30-59ml | 29 (48%) |
| severe | ≥60ml | 6 (10%) |
| Three dimensional echocardiography | ||
| Left atrium volume Index (ml/m 2 ) | 45±16 | |
| Type of mitral regurgitation | ||
| organic | 45 (75%) | |
| functional | 15 (25%) | |
| ischemic | 11 (73%) | |
| non-ischemic | 4 (27%) | |
| Characteristics of the mitral regurgitation | ||
| Single PISA | 37 (62%) | |
| Multiple PISA | 23 (38%) | |
| Central Jet | 31 (52%) | |
| Eccentric Jet | 29 (48%) | |
∗ Cardiac output as measured by aortic stroke volume times heart rate.
Ninety-five percent of the TEE volumes were analyzable versus 78% (p = 0.001) of the TTE volumes. The time resolution was similar (TEE 32 ± 7 vs TTE 31 ± 7 fps, p = 0.567), but the number of PISA shapes visible per systole was significantly greater using TEE (12 ± 4 vs 10 ± 4 PISA per systole, p = 0.018). Because of flow artifacts in the aorta, the CMR RVol could not be calculated in 2 patients. Therefore, a total of 55 patients were included in the final analysis comparing the TEE techniques and 45 patients in the final analysis comparing the TTE techniques against the reference method.
The interobserver variability (Bland–Altman bias and LOA) for RVol by integrated 3D PISA was 3.2 ml (−12.4 to 18.8) with a Pearson correlation coefficient of r 2 0.93 (p <0.0001), and a coefficient of variability of 19%. The intraobserver variability was 1.3 ml (−8.2 to 10.9) with a Pearson correlation coefficient of r 2 0.95 (p <0.0001) and a coefficient of variability of 12%.
TEE-RVol calculated by integrated 3D PISA was associated with CMR RVol as shown in Figure 3 . The comparison of the means showed a significant underestimation of the RVol: TEE 30 ± 21 versus CMR 36 ± 20 ml (p = 0.001). The 3D peak PISA method was less accurate than the integrated 3D PISA method, r 2 = 0.67, y = 1.00x + 6.20 (p <0.0001), had larger LOAs, −6.3 ml [−33.4; 21.0], and overestimated RVol compared to the reference technique: TEE 42 ± 24 versus CMR 36 ± 20 ml (p = 0.008). RVol by the standard 2D PISA technique was associated as follows with the reference: r 2 = 0.54, y = 0.76 x + 0.18 (p <0.0001); bias and LOA 8.4 ml (−20.4 to 37.2), with an underestimation of RVol comparable to the 3D integrated PISA: TEE 27 ± 20 versus CMR 36 ± 20 ml (p = 0.001).


