The aim of this study was to determine if left atrial (LA) phasic function evaluated by Doppler tissue imaging–derived strain and strain rate would be differentially decreased in patients with hypertrophic cardiomyopathy (HC) compared to patients with hypertension and to normal controls. Thirty-seven patients with HC were compared to 44 patients with systemic hypertension (SH) and 65 normal controls using transthoracic echocardiography. Maximal and minimal LA volume and LA volume just before active atrial contraction (pre-P LA volume) were measured, and phasic LA volumes were calculated. Global and segmental systolic strain rate, early diastolic strain rate, and late diastolic strain rate (A-Sr) and strain were measured from Doppler tissue imaging. Left ventricular mass was increased in the HC and SH groups compared to normal controls, but diastolic dysfunction was greater in the HC group. LA volumes were increased in patients with HC compared to those with SH and to normal controls, with corresponding reductions in A-Sr and atrial strain in the HC group. In contrast, only early diastolic strain rate was decreased in the SH group compared to controls. A-Sr remained reduced in patients with HC compared to the SH group, even after adjusting for left ventricular mass. When left ventricular mass, parameters of diastolic function (peak E and E′ velocity), and the effect of patient group (SH vs HC) were examined in a stepwise regression model, patient group (SH vs HC) was the only independent determinant of A-Sr. In conclusion, HC results in LA enlargement with reduced LA phasic function that is reflected in reductions in A-Sr and atrial strain. Atrial enlargement is a likely consequence of the greater diastolic dysfunction in the HC group.
Doppler tissue imaging has enhanced the noninvasive assessment of regional myocardial function. Strain and strain rate, derived from Doppler tissue imaging, examine myocardial deformation and rate of deformation, respectively, and are largely independent of the tethering effect of the myocardium compared to Doppler tissue imaging. Although initially used for quantifying regional ventricular deformation, this technique has more recently been used to evaluate atrial function, in normal subjects and in conditions with atrial dysfunction. The objectives of this study were to examine left atrial (LA) function using strain and strain rate in patients with hypertrophic cardiomyopathy (HC) compared to patients with systemic hypertension (SH) and to determine whether atrial strain and strain rate could differentiate the increasing severity of LA dysfunction. We hypothesized that LA reservoir, conduit, and contractile function measured by systolic strain rate (S-Sr), early diastolic strain rate (E-Sr), and late diastolic strain rate (A-Sr), respectively, would be significantly altered in patients with HC because of greater diastolic dysfunction and consequent LA enlargement. We further hypothesized that in HC, atrial contractile function measured by A-Sr may be differentially reduced because of coexistent atrial myopathy.
Methods
This study was approved by Human Research Ethics Committees at Westmead Hospital and Royal Prince Alfred Hospital (Sydney, Australia). Sixty-six patients with HC were recruited from the HC clinic at Royal Prince Alfred Hospital and compared to 44 patients with hypertension and 65 normal controls. All patients with HC had New York Heart Association class I or II symptoms and had echocardiographic LV wall thickness >13 mm in the absence of SH, with left ventricular outflow tract obstruction present in 6. Patients were excluded if they had previous myectomy or alcohol septal ablation (n = 6), were pacemaker dependent (n = 11) or were in permanent or paroxysmal AF (n = 12). Thus, 37 patients with HC were included in the final analysis. Twelve patients with HC (32%) were not taking any medication, 8 (22%) were taking calcium antagonists, 17 (46%) were taking β blockers, and 2 (5%) were taking both.
The SH population had documented blood pressure recordings >140/90 mm Hg and was recruited from the cardiology and renal departments at Westmead Hospital and from the community. Patients with more than mild valvular regurgitation or stenosis, histories of atrial arrhythmias, ejection fractions of <50%, previous cardiac surgery, or implanted devices were excluded. In the SH group, 8 patients (23%) were untreated, 14 (33%) were taking calcium antagonists, 4 (10%) were taking β blockers, 2 (5%) were receiving both, 10 (24%) were taking angiotensin-converting enzyme inhibitors, 27 (64%) were taking angiotensin receptor blockers, and 9 (21%) were taking diuretics. All recruited patients remained on their regular medications as determined by their treating physicians.
The normal population consisted of healthy volunteers recruited from the hospital staff and the community who had no histories of SH, ischemic heart disease, significant valvular disease, peripheral vascular disease, cerebrovascular disease, or diabetes; none were taking antihypertensive or other cardiac medications.
Comprehensive Doppler, M-mode, and 2-dimensional echocardiography was performed according to established laboratory practice using commercially available machines (Vivid 5 and Vivid 7; GE Vingmed Ultrasound AS, Horten, Norway) and offline measuring station EchoPAC (GE Vingmed Ultrasound AS) using harmonic 3.5-MHz variable-frequency phased-array transducers. LA diameter and left ventricular wall thickness were measured by M-mode echocardiography. Biplane left ventricular end-diastolic and end-systolic volumes were determined using the method of disks; the American Society of Echocardiography recommended area-length method was used to determine left ventricular mass. Left ventricular volumes and mass were indexed to body surface area. Mitral regurgitation was graded qualitatively using color flow jet area, jet density, and contour using continuous-wave Doppler according to guidelines.
Left ventricular diastolic function was determined using standard echocardiographic parameters, including peak E velocity, peak A velocity, the E/A ratio, deceleration time, and isovolumic relaxation time. Early diastolic E′ velocity and late diastolic A′ velocity were measured by Doppler tissue imaging as an average of 3 beats. Care was taken to place the sample volume parallel to the direction of motion, and the Nyquist limit was set to 16 cm/s and gains were adjusted to minimize noise.
Maximal, minimal, and “pre-P” LA volumes were measured from the apical 4- and 2-chamber zoomed views using Simpson’s biplane method of disks from an average of 3 cardiac cycles. The following LA phasic parameters were derived and indexed to body surface area: (1) LA total emptying volume = LA maximum volume − LA minimum volume; (2) LA total emptying fraction = LA total emptying volume/LA maximum volume; (3) LA passive emptying volume = LA maximum volume − pre-P LA volume; (4) LA passive emptying fraction = LA passive emptying volume/LA maximum volume; (5) LA active emptying volume = pre-P LA volume − LA minimum volume; (6) LA active emptying fraction = LA active emptying volume/pre-P LA volume; and (7) LA conduit volume = left ventricular stroke volume − (LA maximum volume − LA minimum volume).
Transmitral peak A-wave velocity and its velocity-time integral were measured. The atrial fraction was estimated as A-wave velocity-time integral divided by the total velocity-time integral of mitral inflow. Late diastolic A′ velocity was estimated using Doppler tissue imaging as previously described. All parameters were measured as averages of 3 beats. The LA ejection fraction was calculated as LA total emptying volume divided by maximal LA volume.
The methods for measuring strain and strain rate have recently been published. Color Doppler tissue images were obtained in the apical 4- and 2-chamber views with appropriate changes in sector width to maintain frame rates of >110 frames/s and were analyzed off-line using commercial software (EchoPAC version 6.2) as an average of 3 cardiac cycles. If the angle of interrogation exceeded 30°, the patient was excluded from the final analysis. Because active atrial contraction occurs in diastole, the strain curves were gated in diastole by moving the gating marker to the end of the T wave on the electrocardiogram.
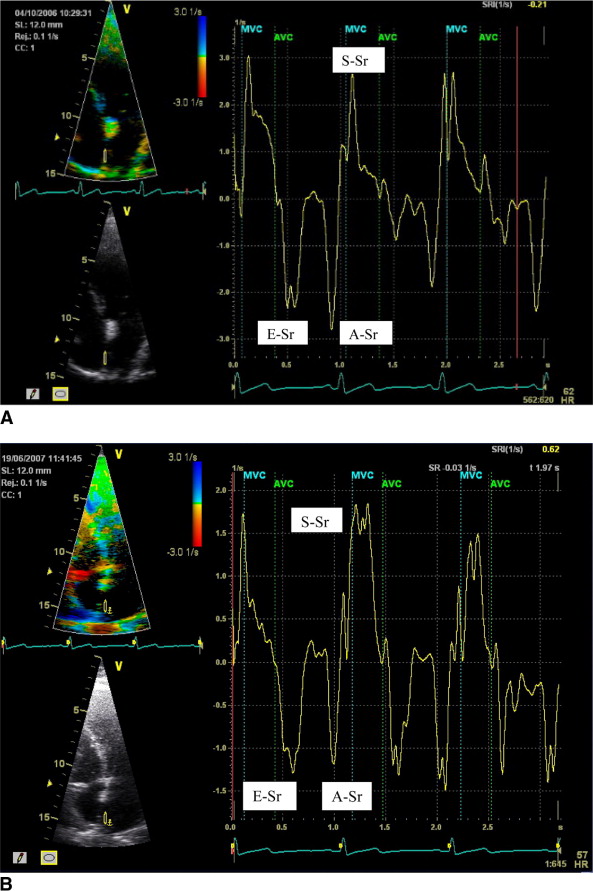
Strain and strain rate were measured from the mid to superior segments at 4 sites, the septal and lateral walls (apical 4-chamber view) and the inferior and anterior walls (apical 2-chamber view) ( Figure 1 ). The sample volume (10 × 2 mm) was tracked frame by frame to maintain its position within the LA walls. The peak strain rate was measured in each segment in systole (S-Sr), early diastole (E-Sr), and late diastole (A-Sr), applying Gaussian 60 smoothing. Global strain and strain rate were also calculated by averaging values from the septal, lateral, inferior, and anterior walls. The timing of atrial activity was also measured as the duration from aortic valve closure to peak A-Sr as a marker of intra-atrial dyssynchrony. Intra-atrial delay was defined by the SD of the timing of atrial activity among the septal, lateral, inferior, and anterior walls.
Ten subjects were randomly selected from the groups for interobserver and intraobserver variability analysis. Peak strain and strain rate were remeasured by the same observer and by a second independent observer from the stored digital data.
All values are expressed as mean ± SD. Differences in continuous variables between multiple groups were assessed using analysis of variance with a post hoc Bonferroni correction. Categorical variables were analyzed using chi-square tests or Fisher’s exact tests as appropriate. Correlations between 2 variables were assessed using Spearman’s rank correlation coefficient. Backward stepwise regression was used to determine independent predictors of A-Sr. Bland-Altman analysis was performed to analyze intra- and interobserver variability. Data were analyzed using SPSS version 15 (SPSS, Inc., Chicago, Illinois). Data were considered significant at p ≤0.05.
Results
Tables 1 and 2 list the demographic and echocardiographic variables of the normal, HC, and SH groups.
| Variable | Controls (n = 65) | Patients With SH (n = 44) | Patients With HC (n = 37) | Overall p Value |
|---|---|---|---|---|
| Age (years) | 57 ± 7 | 57 ± 9 | 51 ± 15 | NS |
| Men | 51% | 50% | 57% | NS |
| Heart rate (beats/min) | 68 ± 10 | 69 ± 12 | 60 ± 9 ⁎ , † | 0.001 |
| Body surface area (m 2 ) | 1.9 ± 0.2 | 1.9 ± 0.2 | 1.9 ± 0.2 | NS |
| Systolic blood pressure (mm Hg) | 122 ± 11 | 140 ± 17 ⁎ | 125 ± 15 | 0.001 |
| Diastolic blood pressure (mm Hg) | 76 ± 8 | 81 ± 10 ⁎ | 73 ± 11 | 0.001 |
| Mean arterial pressure (mm Hg) | 91 ± 8 | 100 ± 10 ⁎ | 90 ± 11 | 0.001 |
| Diabetes mellitus | 0% | 12% | 3% | NS |
| History of hypertension | 0% | 100% | 30% | — |
| Medications | ||||
| Aspirin | — | 14% | 32% | NS |
| Angiotensin-converting enzyme inhibitors | 0% | 24% | 8% | NS |
| Angiotensin receptor blockers | 0% | 64% | 3% ⁎ | 0.001 |
| Calcium antagonists | 0% | 33% | 22% | NS |
| β blockers | 0% | 10% | 46% ⁎ | 0.001 |
| Diuretics | 0% | 21% | 16% | NS |
| Other | 0% | 19% | 5% | NS |
| Variable | Normal Controls (n = 65) | Patients With SH (n = 44) | Patients With HC (n = 37) | Overall p Value |
|---|---|---|---|---|
| 2 dimensional echocardiographic parameters | ||||
| LA diameter (M-mode) (mm) | 38 ± 5 | 41 ± 5 ⁎ | 45 ± 8 ⁎ , † | 0.001 |
| LA maximum volume (ml) | 44.1 ± 13.1 | 50 ± 18 | 78.0 ± 25.4 ⁎ , † | 0.001 |
| Indexed LA maximum volume (ml) | 23.6 ± 5.8 | 25 ± 8 | 40.4 ± 11.6 ⁎ , † | 0.001 |
| LA minimum volume (ml) | 18.9 ± 7.1 | 21 ± 10 | 42.5 ± 19.5 ⁎ , † | 0.001 |
| Indexed LA minimum volume (ml) | 10.1 ± 3.2 | 11 ± 4 | 21.9 ± 9.2 ⁎ , † | 0.001 |
| Ventricular septal thickness (mm) | 9.7 ± 1.8 | 11.2 ± 1.9 ⁎ | 19.3 ± 4.8 ⁎ , † | 0.001 |
| Posterior wall thickness (mm) | 9.6 ± 1.7 | 11.3 ± 1.7 ⁎ | 11.3 ± 2.7 ⁎ | 0.001 |
| Left ventricular mass index (g/m 2 ) | 68 ± 15 | 88 ± 19 ⁎ | 129 ± 42 ⁎ , † | 0.001 |
| Left ventricular ejection fraction (%) | 60 ± 6 | 58 ± 5 | 63 ± 7 ⁎ , † | 0.002 |
| Doppler parameters | ||||
| Peak E velocity (m/s) | 0.70 ± 0.16 | 0.74 ± 0.16 | 0.78 ± 0.21 ⁎ | 0.052 |
| Peak A velocity (m/s) | 0.64 ± 0.15 | 0.72 ± 0.18 | 0.65 ± 0.28 | NS |
| E/A ratio | 1.1 ± 0.31 | 1.1 ± 0.33 | 1.4 ± 0.61 ⁎ , † | 0.002 |
| Mitral A velocity-time integral (cm) | 9.1 ± 2.9 | 9.6 ± 2.7 | 8.1 ± 3.5 ⁎ | NS |
| Deceleration time (ms) | 214 ± 47 | 238 ± 51 | 251 ± 63 ⁎ | 0.002 |
| Isovolumic relaxation time (ms) | 95 ± 14 | 103 ± 16 | 118 ± 26 ⁎ , † | 0.001 |
| Atrial fraction (%) | 40.2 ± 8.0 | 38.7 ± 8.1 | 31.4 ± 10.1 ⁎ , † | 0.001 |
| LA ejection fraction (%) | 57.2 ± 9.0 | 57.2 ± 8.0 | 48.0 ± 10.3 ⁎ , † | 0.001 |
| LA stroke volume (ml) | 25.2 ± 8.1 | 28.6 ± 9.5 | 36.4 ± 10.9 ⁎ , † | 0.001 |
| Septal S′ (cm/s) | 7.0 ± 1.4 | 7.5 ± 2.2 | 5.9 ± 1.9 ⁎ , † | 0.001 |
| Septal E′ (cm/s) | 7.6 ± 1.9 | 6.6 ± 2.0 ⁎ | 5.1 ± 2.0 ⁎ , † | 0.001 |
| Septal A′ (cm/s) | 9.8 ± 1.8 | 9.8 ± 2.1 | 7.9 ± 2.4 ⁎ , † | 0.001 |
| Septal E/E′ | 10.2 ± 3.9 | 12.0 ± 4.4 | 18.3 ± 10.0 ⁎ , † | 0.001 |
Indexed maximal LA volume was increased in the HC group (HC vs SH vs normal controls: 40.4 ± 11.6 vs 25 ± 8 vs 23.6 ± 5.8 ml/m 2 , p <0.001; Table 2 ). The passive emptying fraction and conduit volume were reduced in the HC group compared to controls, while in the SH group, an increase in active emptying fraction was noted compared to the HC group ( Table 3 ). Although peak A velocity was similar, other traditional parameters of atrial function (A-wave velocity-time integral, atrial fraction, the LA ejection fraction, and A′ velocity) were reduced in the HC group ( Table 2 ).
| Variable | Normal Controls (n = 65) | Patients With SH (n = 44) | Patients With HC (n = 37) | Overall p Value |
|---|---|---|---|---|
| Active emptying volume (ml) | 11.1 ± 5.6 | 13.0 ± 5.9 | 19.1 ± 9.9 ⁎ , † | 0.001 |
| Indexed active emptying volume (ml/m 2 ) | 5.9 ± 2.6 | 6.7 ± 3.0 | 9.9 ± 5.0 ⁎ , † | 0.001 |
| Active emptying fraction (%) | 36.5 ± 11.2 | 38.4 ± 10.1 | 31.3 ± 11.6 ⁎ , † | 0.02 |
| Conduit emptying volume (ml) | 26.0 ± 11.5 | 22.8 ± 16.5 | 15.5 ± 6.3 ⁎ | 0.002 |
| Indexed conduit emptying volume (ml/m 2 ) | 14.1 ± 6.1 | 11.4 ± 7.6 | 8.8 ± 8.2 ⁎ | 0.001 |
| Passive emptying volume (ml) | 14.1 ± 6.1 | 15.8 ± 7 | 17.6 ± 8.2 ⁎ | 0.05 |
| Indexed passive emptying volume (ml/m 2 ) | 7.7 ± 3.3 | 8.0 ± 3.2 | 9.2 ± 4.1 | NS |
| Passive emptying fraction (%) | 32.0 ± 10.8 | 31.7 ± 9.1 | 22.9 ± 10.2 ⁎ , † | 0.001 |
Stay updated, free articles. Join our Telegram channel

Full access? Get Clinical Tree


