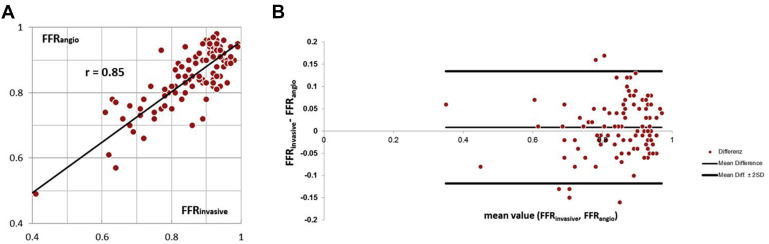
Invasive fractional flow reserve (FFR invasive ), although gold standard to identify hemodynamically relevant coronary stenoses, is time consuming and potentially associated with complications. We developed and evaluated a new approach to determine lesion-specific FFR on the basis of coronary anatomy as visualized by invasive coronary angiography (FFR angio ): 100 coronary lesions (50% to 90% diameter stenosis) in 73 patients (48 men, 25 women; mean age 67 ± 9 years) were studied. On the basis of coronary angiograms acquired at rest from 2 views at angulations at least 30° apart, a PC-based computational fluid dynamics modeling software used personalized boundary conditions determined from 3-dimensional reconstructed angiography, heart rate, and blood pressure to derive FFR angio . The results were compared with FFR invasive . Interobserver variability was determined in a subset of 25 narrowings. Twenty-nine of 100 coronary lesions were hemodynamically significant (FFR invasive ≤0.80). FFR angio identified these with an accuracy of 90%, sensitivity of 79%, specificity of 94%, positive predictive value of 85%, and negative predictive value of 92%. The area under the receiver operating characteristic curve was 0.93. Correlation between FFR invasive (mean: 0.84 ± 0.11) and FFR angio (mean: 0.85 ± 0.12) was r = 0.85. Interobserver variability of FFR angio was low, with a correlation of r = 0.88. In conclusion, estimation of coronary FFR with PC-based computational fluid dynamics modeling on the basis of lesion morphology as determined by invasive angiography is possible with high diagnostic accuracy compared to invasive measurements.
Although stenosis degree is an insufficient marker of the hemodynamic relevance of coronary artery lesions, invasive measurement of the fractional flow reserve (FFR) provides assessment of hemodynamic relevance, and current guidelines assign a class-IA recommendation to perform FFR in stenoses between 50% and 90% unless there is noninvasive proof of ischemia. Registry data show that using FFR substantially alters management as compared to angiographic assessment alone. Because its invasiveness and need for adenosine medication limits the widespread clinical use of FFR, a noninvasive method to derive the hemodynamic effect of coronary stenoses on the basis of their angiographic morphology alone would be of major interest. Indeed, such approaches have become possible using computational fluid dynamics (CFD) modeling. Initial results were obtained in relatively small patient cohorts and without consideration of the patients’ individual hemodynamic parameters. We developed and validated a method to derive lesion-specific FFR values on the basis of coronary angiographic anatomy using a PC-based CFD model, while including patient-specific heart rate and blood pressure (BP) values.
Methods
Data of 86 patients were retrospectively analyzed for this proof-of-concept study over the course of 8 months. All patients had undergone invasive coronary angiography because of known (n = 44) or suspected (n = 42) coronary artery disease and the operator had identified a clinical need to perform an invasive FFR measurement because of a coronary stenosis with a diameter reduction between 50% and 90%. A total of 113 coronary lesions underwent FFR analysis. After exclusion of 13 lesions (in 13 patients) for lack of adequate visualization in invasive angiography, 100 coronary lesions in 73 patients remained that were depicted in 2 projections separated by at least 30°, with sufficient contrast and without superposition of other branches. These lesions were included in this trial. Patients with an ostial left main or right coronary artery stenosis or with previous bypass surgery that included grafting of the interrogated vessel were not considered for this study.
Coronary angiography was performed through a transradial (n = 54) or transfemoral (n = 19) approach, in all cases using 6Fr diagnostic catheters after intracoronary injection of 0.2-mg nitroglycerin according to routine practice in our hospital and recommended for FFR measurements, with manual contrast injection and cine acquisition at a frame rate of 10 to 15 images/second. At least 5 acquisitions in different angulations were obtained for the left coronary artery, and at least 2 acquisitions were obtained for the right coronary artery. Diastolic, systolic and mean aortic pressure, as well as heart rate during invasive coronary angiography were recorded at the time of angiographic acquisition.
Measurement of invasive FFR (FFR invasive ) was performed according to routine clinical practice, using a 6Fr guiding catheter. A 0.014′ coronary wire with a pressure tip (Volcano Corporation, San Diego, CA) was advanced until the pressure sensor passed the orifice of the guiding catheter. Transcatheter aortic and intracoronary pressure tracings were equalized. Subsequently, the guidewire was advanced into the respective coronary artery until the pressure sensor passed the index lesion. The ratio of the mean pressure in the coronary artery distal to the lesion over the mean pressure in the aorta (P d /P a , averaged over 5 cardiac cycles) was continuously recorded. Adenosine was either injected intravenously at a constant rate of 140 μg/kg/min or as an intracoronary bolus (40 μg for the right coronary artery and 80 μg for the left coronary artery), and the lowest P d /P a value in steady state after adenosine application was documented to obtain FFR invasive .
The determination of lesion-specific FFR derived from invasive angiography (FFR angio ) was based on anatomy (extracted from invasive angiography) as well as physiological parameters, namely the heart rate and systolic and diastolic BP. Two angiographic acquisitions showing the index lesion in projections at least 30° apart were selected and processed offline to generate a 3-dimensional (3D) model of anatomy of the coronary lesion, using a commercially available 3D reconstruction tool (“syngo IZ3D”; Siemens AG, Healthcare, Forchheim, Germany). The main vascular branch and, if appropriate, one side branch could be included in the model. After loading the angiographic scenes into “syngo IZ3D,” 2 corresponding frames were chosen that showed the index lesion in identical phases of the cardiac cycle and without overlap by other vessels. In these frames, the vessel centerline was traced manually. Vessel contours were then automatically detected and manually corrected if needed. Subsequently, a 3D anatomic model was automatically generated on the basis of the delineated vessel contours and geometric information about the lesion, such as length and area-based as well as diameter-based stenosis, were derived after manual identification of the proximal and distal border of the lesion. Subsequently, the 3D anatomic model was exported in a dedicated format (Standard Tessellation Language) for further processing and determination of FFR angio .
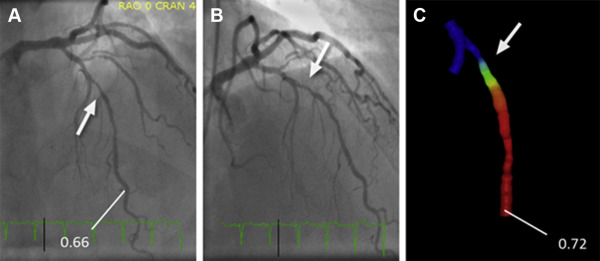
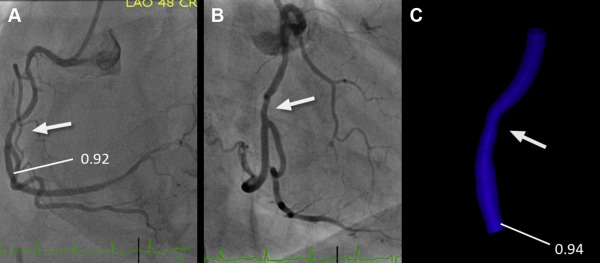
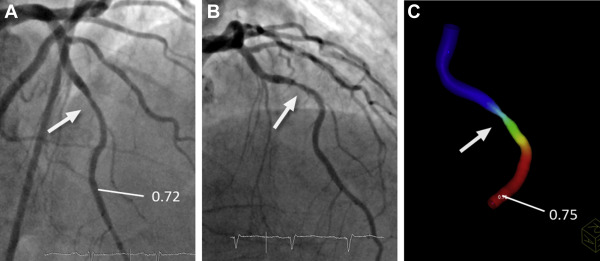
PC-based CFD modeling prototype software (Siemens Healthcare GmbH, Forchheim, Germany) was used for the computation of FFR angio . The model used personalized boundary conditions estimated from angiographic anatomy, heart rate, and BP. More precisely, the software used the mean aortic pressure and heart rate, the vessel cross section of the nondiseased proximal segment of the modeled coronary vessel, Murray’s law to distribute assumed flow over more than one outlet, if present, and known estimates of coronary microvascular resistance to determine flow at rest. Subsequently, changes in arterial pressure and coronary flow under maximal hyperemia were estimated under the assumption of normal physiology, which allowed to determine FFR angio values throughout the complete coronary vessel segment for which 3D anatomy had been modeled on the basis of the ratio of computed pressures at the location of interest and at the inlet. Mean calculation time was approximately 40 seconds (see Appendix and see Figures 1, 2, and 3 ).
FFR values obtained by invasive measurement (FFR invasive ) and by CFD modeling on the basis of angiographic anatomy (FFR angio ) were compared using correlation and Bland–Altman analysis. A paired t test was used to test for significant differences between FFR invasive and FFR angio , with a p value <0.05 considered to indicate statistically significant differences. Using FFR invasive ≤0.80 as a standard of reference, diagnostic performance of FFR angio (also using a threshold of ≤0.80) was determined by calculating sensitivity, specificity, negative and positive predictive values as well as overall accuracy, and by receiver operating characteristic curve analysis.
In a subgroup of 25 randomly selected lesions, FFR angio was determined by 2 separate operators, with all steps of the evaluation (including selection of angiographic frames) performed independently in a blinded fashion.
Results
Seventy-three patients (48 men and 25 women) with 100 intermediate coronary lesions were included in this study. Mean age was 67 ± 9 years with a minimum of 36 and a maximum of 91 years. The mean body weight was 81 ± 9 kg, the mean body mass index 27.7 ± 2.9 kg/m 2 . In 38 patients, coronary artery disease was previously known, 35 had a history of cardiovascular revascularization, including 6 patients with previous bypass surgery and 12 patients had a myocardial infarction. Patient baseline characteristics and risk factors are listed in Table 1 , and hemodynamic data in Table 2 .
| Male | 48 (66%) |
| Female | 25 (34%) |
| Age (years) | 67±11 |
| Height (cm) | 171±7 |
| Weight (kg) | 81±11 |
| Hypertension | 64 (88%) |
| Dyslipidemia | 71 (97%) |
| Diabetes mellitus | 17 (23%) |
| Current smoker | 11 (15%) |
| Family history of premature coronary artery disease | 27 (27%) |
| Percutaneous coronary revascularization only | 29 (40%) |
| Coronary bypass grafting only | 2 (3%) |
| Both PCI and CABG | 4 (5%) |
| Previous myocardial infarction | 12 (16%) |
| Stable Coronary Artery Disease | 51 (70%) |
| Unstable Angina pectoris | 18 (25%) |
| Non-ST-Elevation Myocardial Infarction | 4 (5%) |
| Mean value | range | |
|---|---|---|
| Heart rate (beats∖min) | 74±11 | 54-110 |
| Systolic blood pressure (mmHg) | 140±21 | 90-195 |
| Diastolic blood pressure (mmHg) | 71±13 | 33-97 |
| Mean aortic pressure (mmHg) | 94±14 | 59-130 |
Hundred coronary vessels (left anterior descending artery: 46, left circumflex artery: 23, right coronary artery: 31) were studied (see Table 3 ). Most vessels had a focal lesion with a length of <20 mm (66%). Thirty-eight lesions (38%) were classified as “type A”, 42 lesions (42%) as “type B”, and 20 lesions (20%) as “type C”. Bifurcation lesions with an estimated side branch reference diameter ≥2.0 mm were present in 25 cases. The mean stenosis degree (visually estimated in 5% increments) was 56 ± 14%. In 62% of lesions, it was between 50% and 70%.
| Coronary artery | |
| Left anterior descending | 46 |
| Left circumflex | 23 |
| Right | 31 |
| Lesion Characteristics | |
| “Type A” Stenosis | 38 |
| “Type B1” Stenosis | 28 |
| “Type B2” Stenosis | 14 |
| “Type C” Stenosis | 20 |
| Bifurcation with side branch ≥ 2.0mm | 25 |
Twenty-nine of 100 coronary lesions were hemodynamically significant (FFR invasive ≤0.80). The mean value for FFR invasive was 0.84 ± 0.11 (0.32 to 0.98), and the mean value for FFR angio was 0.85 ± 0.12 (0.38 to 0.99). FFR angio showed close correlation to FFR invasive (r = 0.85). The mean absolute difference between FFR angio was 0.05 ± 0.04. Mean bias in Bland–Altman analysis was 0.0082 with a standard deviation of 0.063 (−0.017 to +0.134). No statistically significant difference between both measurements was observed (p = 0.59, see Figure 4 ). A total of 12 lesions showed an absolute difference between FFR angio and FFR invasive ≥0.10 (“outliers”). Stenosis degree was higher for outliers, but not significantly so (64 ± 14% vs 55 ± 17%), and the length of the diseased and modeled coronary segment was significantly longer (61 ± 19 mm vs 41 ± 18 mm, p = 0.03). No other parameter, including heart rate, affected vessel, or stable versus unstable presentation was significantly different.