To date, there has not been a large systematic examination of the hypertrophic cardiomyopathy (HC) phenotype in blacks versus whites. In this study, we investigate differences in presentation of HC between blacks and whites. We included 441 consecutive patients with HC seen at the Johns Hopkins HC clinic in the period from February 2005 to June 2012. We compared 76 blacks for clinical presentation, electrocardiogram, exercise capacity, left ventricular morphology, and hemodynamics by echocardiography to 365 whites. Black patients with HC more often presented with abnormal electrocardiogram (93% vs 80%, p = 0.009), driven by a significant difference in repolarization abnormalities (79% vs 56%, p <0.001). Apical hypertrophy was more common in blacks (26% vs 9%, p <0.001); however, blacks had less severe systolic anterior movement of the mitral valve and had significantly lower left ventricular outflow tract gradients at rest (9 mm Hg; interquartile range [IQR] 7 to 19 vs 16 mm Hg; IQR 8 to 40, p <0.001) and during provocation (36 mm Hg; IQR 16 to 77 vs 59 mm Hg; IQR 26 to 110, p = 0.002). Despite the nonobstructive pathophysiology, blacks had lower exercise capacity (adjusted difference 1.45 metabolic equivalents [0.45 to 2.45], p = 0.005). In conclusion, blacks have an HC phenotype characterized by lower prevalence of the well-recognized echocardiographic features of HC such as systolic anterior movement of the mitral valve and left ventricular outflow tract obstruction and display worse exercise capacity.
Hypertrophic cardiomyopathy (HC) is the most common inherited cardiac disease affecting 1 in 500 subjects worldwide regardless of age, gender, and race. However, there is a knowledge deficiency with regards to HC in blacks. Two population studies report the prevalence of HC in blacks to be at least as high or even higher than in whites. Limited data suggest that black patients with HC may have disproportionately higher risk of sudden cardiac death (SCD) compared with other groups. In an autopsy study by Maron et al, blacks constituted 55% of SCDs in athletes attributed to HC. However, in a comparison group of close to 2,000 patients with confirmed HC followed in high-volume clinics, only 8% were black, compared with 14% of the general population in the United States. Therefore, despite evidence of higher prevalence and event rates, HC diagnosis rates and population under treatment for HC are lower in blacks. Although several factors may potentially contribute to low HC diagnosis rates in blacks, there has not been a systematic examination as to whether the HC phenotype in blacks is distinct from that of whites. The aim of this study was to characterize the anatomic and functional features of HC in blacks relative to that of whites.
Methods
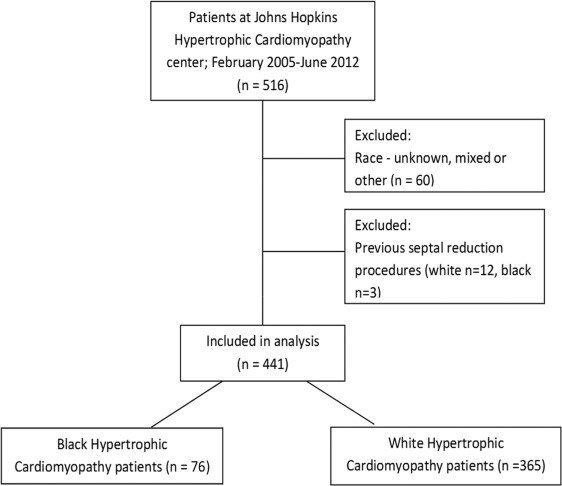
This cross-sectional study was developed from a prospective HC registry approved by the Johns Hopkins Institutional Review Board. We consecutively enrolled patients aged 18 years and older evaluated at the Johns Hopkins HC Clinic in the period February 2005 to June 2012 ( Figure 1 ). The patients were enrolled at the time of their initial diagnosis of HC at the Johns Hopkins HC clinic. All patients fulfilled the American College of Cardiology (ACC)/American Heart Association (AHA) guidelines criteria for a diagnosis of HC defined as unexplained left ventricular hypertrophy (LVH) with a maximal wall thickness above 15 mm by echocardiography in the absence of other cardiac or systemic condition capable of producing a similar degree of LVH. Patients with a maximal wall thickness of 13 to 15 mm and those with concomitant hypertension were diagnosed with HC only if other features suggestive of HC were present such as regional rather than global hypertrophy, systolic anterior motion of the mitral valve (SAM), elevated left ventricular outflow tract (LVOT) gradients, a family history of HC and positive HC genotype. All subjects self-reported race during clinical registration as one of the following: African-American, Caucasian, Asian, American-Indian, and other.
All patients underwent evaluation according to a standardized institutional HC protocol as detailed in the following section: symptoms, co-morbidities, medications were noted. The family history of HC and SCD were defined as one or more first-degree relative with HC or SCD, respectively. Hypertension was defined based on Joint National Commitee 8 criteria, patients on antihypertensive medications (diuretics and angiotensin converting enzyme-inhibitors/angiotensin II receptor blockers receptor) or blood pressure ≥140/90 mm Hg.
The electrocardiograms (ECGs) were analyzed according to published European Society of Cardiology guidelines. Left atrial abnormality was defined as negative p wave ≥1 mm and ≥40 ms in duration in lead V1, and right atrial abnormality was defined as peaked p wave ≥2.5 mm in lead II, III, or aVF. Left anterior hemiblock was defined as axis (−30°:−90°), left posterior hemiblock as axis (>120°), right ventricular hypertrophy as RV1 + SV5 ≥10.5 mm. Pathologic Q waves were defined as Q or QS-waves ≥25% of R wave or ≥3 mm in 2 consecutive leads. A prolonged QTc interval was defined as >470 ms for men and >480 ms for women.
ECG-LVH was defined using the Sokolow–Lyon criterion and Cornell product, but ECG-LVH alone was not considered pathological. Patients with QRS width ≥120 ms were considered having bundle branch block and divided according to configuration into left bundle branch block, right bundle branch block, or nonspecific intraventricular conduction delay. However, all QRS widening ≥110 ms was considered pathologic in accordance with guidelines. Cardiac repolarization was carefully analyzed in patients without bundle branch block, ST depression and ST-elevation were defined as ST-segment depression or elevation of least ≥1 mm in 2 contiguous leads respectively, T-wave inversion was defined as T-wave inversion ≥1 mm in at least 2 contiguous leads. Normal repolarization was defined as QRS <110 ms and lack of any of the previously mentioned repolarization abnormalities. Normal ECG was defined as lack of any abnormalities except ECG-LVH alone.
Transthoracic echocardiography was performed with a Vivid 7 or E-9 cardiac ultrasound machine (GE Ultrasound, Horten, Norway) with a 3.5-MHz broadband transducer. The following conventional parameters were obtained and measured according to the recommendations of American Society of Echocardiography ; left ventricular dimensions and wall thickness, left ventricular ejection fraction by modified biplane Simpson’s method. Local echo laboratory practice standards were implemented such that all patients with suboptimal endocardial definition in ≥2 segments underwent left-sided echocardiography contrast imaging (Definity; Lantheus Medical Imaging, North Billerica, Massachusettsor Optison GE Healthcare, Milwaukee, Wisconsin). Apical thickness was measured in the contrast-enhanced apical 4-chamber image by default and in noncontrast images in those with clearly defined endocardial borders (n = 74). Apical hypertrophy was defined as apical thickness ≥15 mm. True apical HC was defined per Eriksson et al as apical hypertrophy ≥15 mm, with the apex being the thickest segment and an apical/posterior wall ratio ≥1.5. Left atrial volume was measured in end systole in the 4-chamber image. Systolic anterior movement of the mitral valve was evaluated in 2-dimensional echocardiography images and defined as incomplete if there was anterior movement of the valve with no contact to the septum and complete if there was anterior movement with contact between the leaflet and the septum.
Diastolic function was evaluated using mitral diastolic inflow velocities (E/A ratio), deceleration time and E/e′. LVOT gradients were measured using continuous wave Doppler in the optimal apical view at rest and during provocation with Valsalva maneuver, treadmill exercise, and amyl nitrite administration. Peak provoked LVOT gradients were defined as the maximum gradient obtained by any of these provocative maneuvers. Patients were grouped according to resting and provoked LVOT gradients into nonobstructive, labile obstructive, and obstructive groups according to the ACC Foundation/AHA guidelines.
Exercise testing was performed after a standard Bruce protocol unless patients reported low exercise tolerance in which case a modified Bruce protocol was used. Treadmill exercise testing was performed in 83% of the patients at their initial visit. Exercise capacity was expressed as metabolic equivalents (METs).
All statistical analysis was performed with Stata/IC 12.1 statistical software (StataCorp, College Station, Texas). Continuous data are summarized as mean and SD, nonnormal continuous data are summarized as median and interquartile range. Categorical data are summarized as number and percentage. The Student t test or Wilcoxon rank-sum test was used to compare continuous variables in the 2 groups. The chi-square test was used to compare categorical data. A p value of <0.05 was considered significant. We used stepwise forward regression to adjust difference in LVOT gradients and achieved METs for potential confounders. We adjusted LVOT gradients for gender, age, body mass index (BMI), hypertension, and medications. Achieved METs were adjusted for variables known to influence exercise capacity: age, gender, BMI, hypertension, LVOT gradients, and diastolic parameters E/A ratio, deceleration time, E/e′. All variables with p <0.05 were included in the model. All LVOT gradients were skewed and therefore log transformed to achieve normal distribution before entered into the models. The transformed results are presented as ratio of geometric mean.
Results
We consecutively enrolled 516 patients with HC in this study, evaluated at the Johns Hopkins HC clinic from February 2005 to June 2012. Of these, 60 were excluded for race (not black or white; uncertain or mixed ethnic background) and 15 excluded for previous septal reduction procedure. Therefore, 441 patients (76 black and 365 white) were left for analysis ( Figure 1 ). Baseline characteristics of the 441 patients are presented in Table 1 . Black patients with HC were significantly younger, had a higher BMI, and less commonly had a family history of HC compared with whites.
| Variables | Blacks (n=76) | Whites (n=365) | Total (n=441) | P-value |
|---|---|---|---|---|
| Age (years) | 49±17 | 53±15 | 52±15 | 0.05 |
| Female | 30(39%) | 123(34%) | 153(35%) | 0.34 |
| Body mass index (kg/m 2 ) | 32±9 | 29±6 | 29±7 | 0.02 |
| Family history of Hypertrophic Cardiomyopathy | 6(10%) | 84(24%) | 90(22%) | 0.009 |
| Coronary artery disease | 7(11%) | 32(10%) | 39(10%) | 0.79 |
| Hypertension | 41(55%) | 160(44%) | 201(46%) | 0.07 |
| Systolic blood pressure (mmHg) | 132±20 | 131±18 | 131±18 | 0.45 |
| Diastolic blood pressure (mmHg) | 78±12 | 76±11 | 77±11 | 0.22 |
| New York Heart Association class | 1.6±0.7 | 1.6±0.7 | 1.6±0.7 | 0.86 |
| Syncope | 13(19%) | 56(16%) | 69(16%) | 0.60 |
| Angina pectoris | 26(37%) | 87(25%) | 113(27%) | 0.04 |
| Dyspnea | 35(51%) | 196(56%) | 231(55%) | 0.42 |
| Exercise capacity (METs) | 8.9±4.0 | 10.0±4.0 | 9.8±4.0 | 0.05 |
| β-blocker | 52(70%) | 258(71%) | 310(71%) | 0.86 |
| Calcium channel blocker | 19(26%) | 102(28%) | 121(28%) | 0.66 |
Angina was more common in black patients with HC; despite of similar prevalence of coronary artery disease, however, the prevalence of dyspnea and syncope was similar between the 2 groups. Although subjective functional status expressed as New York Heart Association class was similar, treadmill testing revealed significantly lower exercise capacity in the black population ( Table 1 ). After adjusting for several potential confounders as age, BMI, LVOT gradients at rest, gender, and E/e′, the difference in exercise capacity was augmented.
Electrocardiographic data were available in 416 of the patients (94%) and are presented in Table 2 . Patients with active ventricular pacing were excluded from analysis (n = 22). Electrocardiographic abnormalities were noted in a majority of our patients but more commonly in black patients with HC. Repolarization abnormalities were more common in black patients with HC because of a higher prevalence of T-wave inversions. The prevalence of ECG-LVH defined by either one of the used methods was higher in black patients with HC (60% vs 37%, p = 0.001), driven by a difference in ECG-LVH by the Sokolow–Lyon voltage criteria, whereas the prevalence by the Cornell product criteria was the same. Right bundle branch block was also more common in black patients with HC. We found no intergroup differences between the remaining ECG abnormalities.
| Variables | Blacks (n=71) | Whites (n=324) | Total (n=395) | P-value |
|---|---|---|---|---|
| Atrial fibrillation | 1(1%) | 13(4%) | 14(4%) | 0.25 |
| Left ventricular hypertrophy (Cornell) | 17(27%) | 76(26%) | 93(26%) | 0.83 |
| Left ventricular hypertrophy (Sokolow-Lyon) | 27(44%) | 54(19%) | 81(23%) | <0.001 |
| Left atrial abnormality | 28(41%) | 111(36%) | 139(37%) | 0.46 |
| Right atrial abnormality | 9(13%) | 34(11%) | 43(11%) | 0.62 |
| Left anterior hemiblock | 3(5%) | 26(9%) | 29(8%) | 0.22 |
| Left posterior hemiblock | 3(5%) | 12(4%) | 15(4%) | 0.50 |
| Q-waves | 6(10%) | 59(20%) | 65(18%) | 0.06 |
| Right ventricular hypertrophy | 10(16%) | 38(13%) | 48(14%) | 0.49 |
| QRS ≥110 ms | 11(15%) | 58(18%) | 69(17%) | 0.63 |
| Left bundle branch block | 1(1%) | 7(2%) | 8(2%) | 0.56 |
| Right bundle branch block | 7(10%) | 12(4%) | 19(5%) | 0.03 |
| Interventricular conduction defect | 1(1%) | 14(4%) | 15(4%) | 0.21 |
| Long QT | 11(18%) | 39(13%) | 50(14%) | 0.37 |
| ST-elevation | 3(5%) | 9(3%) | 12(3%) | 0.35 |
| ST-depression | 16(26%) | 66(23%) | 82(23%) | 0.60 |
| T-wave inversion | 47(76%) | 132(45%) | 179(51%) | <0.001 |
| Repolarization abnormalities | 56(79%) | 183(56%) | 239(61%) | <0.001 |
| Normal | 5(7%) | 65(20%) | 70(18%) | 0.009 |
The apical thickness and likewise the prevalence of apical hypertrophy (apex ≥15 mm) were significantly higher in black patients with HC ( Table 3 ). LVOT gradients at rest and peak provoked LVOT gradients were significantly lower in blacks compared with whites ( Tables 4 and 5 ). Accordingly, obstructive HC was less frequent in blacks. Black patients with HC had less severe SAM: with decreased prevalence of complete SAM (12% vs 23%, p = 0.03), whereas the prevalence of incomplete SAM (67% vs 57%, p = 0.40) and no SAM (21% vs 20%, p = 0.83) was similar. Maximal wall thickness, left ventricle ejection fraction, septum/posterior wall ratio, and diastolic function were similar between black and white patients with HC.
| Variables | Blacks (n=76) | Whites (n=365) | Total (n=441) | P-value |
|---|---|---|---|---|
| Maximal wall thickness (cm) | 2.2±0.6 | 2.1±0.5 | 2.1±0.5 | 0.38 |
| Maximal wall/post wall ratio | 2.0±0.6 | 2.0±0.6 | 2.0±0.6 | 0.57 |
| Left ventricular ejection fraction (%) | 65±8 | 64±9 | 64±9 | 0.69 |
| Apex thickness (cm) | 1.1±0.5 | 0.9±0.4 | 0.9±0.4 | 0.003 |
| Apical hypertrophy | 19(26%) | 33(9%) | 52(12%) | <0.001 |
| Apical hypertrophic cardiomyopathy | 7(10%) | 17(5%) | 25(6%) | 0.10 |
| E/A-ratio (n=392) | 1.2±0.5 | 1.4±0.7 | 1.3±0.7 | 0.07 |
| Deceleration time (n=392) (ms) | 249±82 | 243±77 | 244±77 | 0.58 |
| Left atrium volume (ml) | 71±40 | 73±31 | 73±32 | 0.73 |
| E/e’-ratio (n=341) | 18±8 | 20±13 | 19±12 | 0.11 |
Stay updated, free articles. Join our Telegram channel

Full access? Get Clinical Tree


