Clinical Pharmacology for the Cardiologist
Satish R. Raj
David Robertson
Overview
Contemporary drug therapy for the cardiac patient is often limited by potential adverse events that include an exacerbation of the condition under treatment. Therapy is further complicated by altered disposition of drugs as a result of concomitant disease processes, active metabolites, drug interactions, and poorly defined therapeutic ranges with a large interpatient variability.
Clinical pharmacology is the study of the principles that underlie the prescribing process. With an understanding of basic pharmacologic principles, medications can be used in a safe, effective, and rational way. At the heart of clinical pharmacology is the interaction between the patient and the drug. Each patient has a unique profile comprising many factors that include age, weight, race, gender, disease states, and pregnancy status. Each drug can similarly be described with a profile that includes its mechanism of action, pharmacokinetic characteristics, adverse events, and drug interactions. A grasp of these principles is required to choose the optimal drug, the dose, and the establishment of an optimal risk-to-benefit ratio for the individual patient.
Basic Principles of Clinical Pharmacology
Pharmacokinetics versus Pharmacodynamics
There is often confusion between two important but different concepts involved in drug effects and drug interactions: pharmacokinetics and pharmacodynamics.
Pharmacokinetics: The study of the movement of drugs within the body, and out of the body. This can be thought of as the effect of the patient on the drug.
Pharmacodynamics: The study of a drug’s effect and mechanisms of action for a given amount of drug in the body. This can be thought of as the effect of the drug on the body.
We first address key pharmacokinetic variables and principles and then take up pharmacodynamic variables in the last portion of this chapter.
A certain plasma (or tissue) drug concentration is usually required to achieve a desired effect from the drug. This is known as the minimal effective concentration (MEC). As the drug concentration keeps increasing, eventually a point of toxicity is reached. This is known as the minimal toxic concentration (MTC). The window of plasma drug concentrations between the MEC and the MTC is known as the therapeutic index. A drug is said to have a narrow therapeutic index if there are not many plasma drug concentrations that are effective and nontoxic. A wide therapeutic index is desirable when working with a particular drug.
To rationally prescribe and dose a drug, the most important pharmacokinetic variables are the drug clearance (Cl), the volume of distribution (VD) of the drug, and the elimination half-life (t1/2) of the drug.
Drug Clearance
Cl from plasma is the volume of plasma cleared of drug per unit time (the usual units are L/hour). Most drugs undergo “first-order elimination,” which means that the rate of drug elimination varies with the plasma drug concentration (exponential decay). Cl is a constant that relates the rate of elimination to the plasma drug concentration. When different organs play a role in Cl (e.g., liver and kidney), the overall clearance is the sum of all of the individual clearance processes. Cl determines the maintenance dose rate, or the dose of a drug required to maintain a target plasma concentration.
For a few drugs (including ethanol), drug elimination involves a linear decline in the plasma concentration of the drug. The rate of elimination is not related to the plasma drug concentration. This is known as “zero-order elimination.”
Pathways of elimination (e.g., biotransformation, renal tubular secretion) may become saturated at high doses of drug, and elimination may change from a first-order to a zero-order process. This is the case for elimination of propranolol (1) and phenytoin (2), which exhibit first-order elimination at low
doses and zero-order elimination at high doses, thus leading to disproportionately large increases in plasma concentration with increasing dose.
doses and zero-order elimination at high doses, thus leading to disproportionately large increases in plasma concentration with increasing dose.
Volume of Distribution
The VD is one of the most misunderstood concepts in clinical pharmacology. It is the volume into which a drug appears to be distributed with a concentration equal to that of plasma. Rather than being a real “volume,” it is actually a proportionality constant that relates the amount of drug in the body and the plasma drug concentration. The units of VD are those of volume (often liters), but it has no real anatomic meaning. Highly lipid-soluble drugs, drugs with intracellular binding, or drugs with tissue sequestration, all of which result in only a small amount of drug’s being left in the body’s extracellular water space, will result in low plasma drug concentration and a high VD (VD = [drug in body]/[plasma drug concentration]). Examples of drugs with a high VD include digoxin (500 L) and mexiletine (600 to 700 L). In contrast, very polar and highly water-soluble drugs such as heparin, which remain almost exclusively in the extracellular water, have a very low VD (5 L).
The VD determines the loading dose of a drug. The loading dose can be calculated as the product of VD and target plasma drug concentration.
Elimination Half-Life
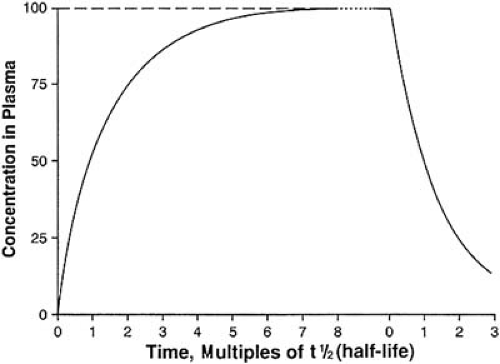
The elimination t1/2 is the time for the concentration of the drug in plasma (or in the body) to decrease to half the original level. This is measured in units of time. The elimination t1/2 provides an index of both the time course of drug elimination and the time-course of drug accumulation. The elimination t1/2 is also the most important parameter in determining the choice of drug interval. If a drug is discontinued after an intravenous infusion, the plasma concentration will decrease to less than 10% of the starting value after four t1/2s and to less than 5% of the starting value after five t1/2s. Conversely, when infusing a drug, the plasma concentration will reach more than 90% of the steady-state value after four t1/2s and more than 95% of the steady-state value after five t1/2s (Fig. 40.1). By convention, the drug concentration at five t1/2s is accepted as being “close enough” to the steady-state value.
The elimination t1/2 is dependent on the Cl and the VD. If the VD is larger, and thus more drug is sequestered outside of the extracellular water space, then the t1/2 is also longer. Conversely, if the Cl were greater, then the t1/2 would be shorter. Thus, the t1/2 varies linearly with the VD and varies inversely with Cl. The constant in the equation is the natural logarithm of one half (the final concentration), or 0.693.
Oral Availability (Bioavailability)
Bioavailability is the proportion of an administered dose that reaches the systemic circulation. By definition, a drug is 100% bioavailable following intravenous injection. Bioavailability after oral administration is determined as the fraction of the drug that enters the body after oral versus intravenous administration. Technically, this is measured by comparing the area under the plasma concentration–time curves following oral and intravenous dosing.
Absorption
Absorption refers to the ability of a drug to cross a biologic barrier into the blood. Following administration of nonintravenously given drugs, the agent first must be absorbed from the gut, oral mucosa, muscle, skin, or subcutaneous tissue and must enter the systemic circulation before it can reach its site of action. Several factors influence the rate and extent of absorption from these sites, including the physicochemical properties of the drug, the surface area available for absorption, and regional blood flow. In general, lipid-soluble drugs penetrate cell membranes more readily than hydrophilic agents; a nonionized drug permeates more readily than an ionized drug. Because many drugs are either weak acids or weak bases, differences in the pH of the gastrointestinal tract (strongly acid stomach, nearly neutral small intestine) determine the extent of ionization and thus the rate of absorption following oral administration. The greatest amount of absorption occurs in the small intestine by virtue of the large surface area available.
Gastrointestinal disease can influence the amount of drug absorbed. Diarrhea and extensive small bowel resection, both of which reduce intestinal transit time, can result in markedly diminished absorption, especially of sustained-release preparations that are designed to allow prolonged absorption. The same principles apply to other routes of administration. For example, following intramuscular injection, absorption is more rapid from deltoid rather than gluteal muscle because the former has a higher blood flow.
Bioavailability can be lowered by incomplete absorption because of problems in the drug’s formulation or the presence or absence of food or by concomitant administration of agents that alter gastric pH (e.g., antacids) or motility (e.g., narcotic analgesics and atropine-like drugs that slow gastric emptying or metoclopramide, which speeds it). Food often decreases the absorption of drugs with low lipid solubility (e.g., atenolol).
First-Pass Metabolism
First-pass metabolism refers to metabolism of drug before it reaches the systemic circulation. This is also referred to as “presystemic elimination.” Presystemic elimination can occur in the gut wall (e.g., estrogens), in the portal circulation (e.g., aspirin), or in the liver (many drugs). Efficient presystemic elimination lowers systemic availability. Some drugs, particularly those that are highly lipid soluble, are so highly metabolized on the “first pass” through the liver that they cannot be used orally (e.g., lidocaine).
Food often increases the oral availability of drugs that have a high first-pass metabolism. Food may increase the portal venous blood flow, thus augmenting the presentation of absorbed drug to the liver, partially saturating the metabolizing pathways, and creating shunts in the liver that allow some drug to bypass the metabolizing pathways. The net result can be an increase in bioavailability (e.g., metoprolol). Some particular foods (e.g., grapefruit juice) compete with drugs for the enzymes involved with the first-pass metabolism (e.g., CYP3A) and result in increased drug bioavailability (e.g., felodipine and lovastatin).
Protein Binding
In plasma, most drugs are reversibly bound to plasma proteins, including albumin, α1-acid glycoprotein (AAG), lipoproteins, and γ-globulins. Although the most abundant protein, albumin, avidly binds acidic drugs, many cardiovascular agents are basic and bind to AAG. AAG is an acute-phase protein whose concentration increases dramatically in response to stresses such as myocardial infarction, burns, or surgery. Increased levels have also been reported in chronic inflammatory diseases such as rheumatoid arthritis, inflammatory diseases, and Crohn disease.
In the case of the majority of drugs, plasma protein binding is only important in the interpretation of measured plasma concentrations. Although drugs may displace each other from protein-binding sites, this is not usually of clinical importance unless some other change occurs (e.g., a decrease in Cl). Free drug concentration is dependent on free Cl, which is not related to plasma protein binding. Thus, in most cases, drug doses do not need to be altered because of alterations in plasma protein binding.
The primary significance of protein binding relates to the interpretation of monitored plasma drug concentrations. When plasma drug concentrations are measured, the total drug (both protein bound and unbound) is usually measured, whereas it is only the free drug that acts on receptors to produce effects. A highly protein bound drug will have a have a higher total drug level (for a given free drug level) than the same drug with a “drug displacer” or a low protein state (e.g., hypoalbuminemia), despite the identical level of “free drug.”
The fraction of drug bound to protein remains constant for most drugs, at least for doses in the therapeutic range. Some drugs show nonlinear saturable protein binding in the range of concentrations attained during routine clinical use. In these cases, the free fraction of drug increases as the total plasma concentration increases. For example, doubling the total disopyramide concentration from 2 to 4 μg/mL may increase the free disopyramide concentration by as much as sixfold (3). The use of a slow-release formulation of disopyramide decreases the impact of saturable protein binding.
Pharmacokinetic Modeling
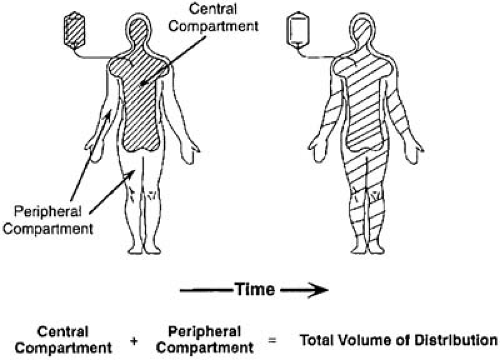
The fate of a drug in the body can be approximated by mathematic models fit to plasma concentration data that, in turn, allow prediction of dosing schedules. The various spaces into which the drug distributes can be viewed as theoretic “compartments” or volumes containing a certain mass of drug, with rate constants for entry and exit of drug from each of these compartments. Entry and exit of drug occur from a central compartment, which in practical terms may be thought of as the plasma (and perhaps highly perfused tissues such as brain, lung, heart, and kidneys). The drug may distribute more slowly into various tissues that can then be regarded as peripheral compartments, with rate constants of entry to and exit from the central compartment (Fig. 40.2). The purpose of partitioning a drug into compartments is simply to allow a convenient mathematic description of the time course of drug disposition and to use knowledge of this time course to determine optional dosing regimens.
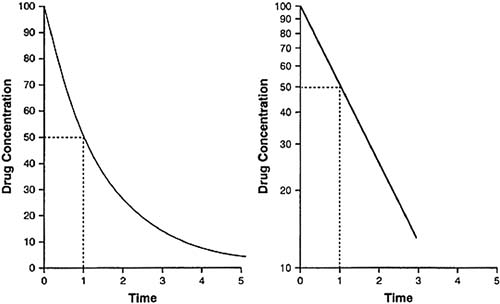
The simplest case is that of rapid, intravenous injection of a drug that is not distributed to other compartments. In this case, a semilogarithmic plot of plasma concentration against time yields a straight line (Fig. 40.3). Such a linear relationship describes a first-order process (i.e., a process dependent on only one parameter). The amount of drug cleared from the plasma depends, at any instant, on one parameter, the amount of drug remaining in the plasma. The elimination t1/2 is the time required for the plasma concentration to decrease by half.
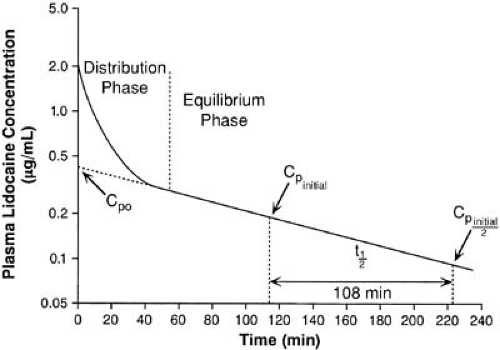
Following intravenous administration of a drug such as lidocaine, a plot of log plasma concentration against time (semilog plot) often shows an initial curvature (Fig. 40.4). This departure from linearity represents the initial dilution of drug within the plasma and its distribution to other tissues. Once distribution is complete, drug in both the central and peripheral compartments is in equilibrium. The curve can be dissected into two straight lines rather than one; the first represents the distribution t1/2 (8 minutes for lidocaine), and the second already is familiar as describing the terminal elimination t1/2 (108 minutes for lidocaine).
This concept of mass action compartments wherein drug is distributed can be extended to multicompartment models. The semilog plot of plasma concentration with time following a single intravenous dose may then be described by a polyexponential equation, with rate constants for entry to and exit from each compartment. Most drugs can be modeled to one or two compartments. It is unusual to require more complex considerations such as a three-compartment model. A prominent example of such complexity is amiodarone, which usually requires three or more exponents to describe its disposition.
A drug administered by a route other than the intravenous first must be absorbed into the circulation. A semilog plot of plasma concentration against time shows an initial increase in concentration as drug is absorbed, followed by equilibration of drug between central and peripheral compartments, and a linear elimination phase with a slope identical to that evidenced with intravenous administration. Absorption, like elimination, is usually a first-order process; a constant fraction of the total drug present is absorbed per unit of time. As the amount of drug remaining to be absorbed diminishes, so does the rate
of absorption. Sustained-release preparations are designed to be roughly analogous to a constant-rate infusion. Absorption may be independent of the total amount of drug (zero-order absorption), such that a constant amount of drug is absorbed per unit of time. Zero-order absorption is the case whenever a reservoir of drug is available to replace the amount absorbed.
of absorption. Sustained-release preparations are designed to be roughly analogous to a constant-rate infusion. Absorption may be independent of the total amount of drug (zero-order absorption), such that a constant amount of drug is absorbed per unit of time. Zero-order absorption is the case whenever a reservoir of drug is available to replace the amount absorbed.
The mathematic relationships describing the previously mentioned processes provide the basis for constructing dosing schedules and are of practical utility in understanding and interpreting plasma drug concentration information (4,5).
Drug Accumulation
Most drugs are given as multiple doses to maintain an effective plasma concentration. In practice, there is fluctuation about a mean plasma concentration between doses. The degree of the fluctuation depends on the length of the dosing interval relative to the elimination t1/2. If the dosing interval is short relative to the t1/2, the fluctuation will be small, but the degree of accumulation will be large. Conversely, a long dosing interval combined with a short t1/2 results in wide fluctuation but little accumulation. By definition, the plasma concentration of a drug administered at intervals corresponding to its t1/2 shows a twofold fluctuation between minimum and maximum plasma concentrations. The acceptability of a dosage regimen depends more on the width of the therapeutic window than on the t1/2.
Steady State
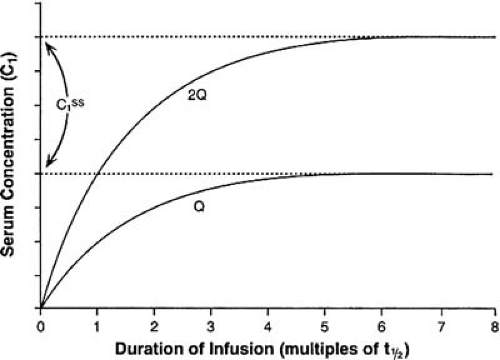
A drug reaches steady state when the rate of entry into the body equals the rate of elimination (a true equilibrium). The time taken to reach steady state or to eliminate the drug completely depends only on the elimination t1/2 of the drug or active metabolites. Figure 40.1 illustrates the relationship between t1/2 and drug accumulation or elimination. After approximately five t1/2s, either process is virtually (>95%) complete. Neither increasing the dose nor increasing the rate of administration hastens the achievement of the plasma concentration plateau; such maneuvers simply increase the final plasma concentration achieved (Fig. 40.5). Loading doses may allow one to reach an effective concentration sooner, but they do not alter the time ultimately required to reach true steady state. It also
follows that factors influencing the elimination t1/2 also affect the time taken to reach steady state.
follows that factors influencing the elimination t1/2 also affect the time taken to reach steady state.
 Get Clinical Tree app for offline access 
|
