Chapter 20 Clinical Electrophysiology Techniques
Indications for an Electrophysiological Study
Not everyone with a known or suspected arrhythmia needs an EPS. A simple electrocardiogram (ECG) or one of the many noninvasive tests may provide definitive information. Guidelines on the indications for EPS and ablation are published from time to time by the American College of Cardiology and the American Heart Association with input from the Heart Rhythm Society.1 These guidelines are likely to be updated in the near future.
Preparing for an Electrophysiological Study
The Electrophysiologist
Performing an EPS is not a routine procedure but must be tailored to the individual patient. As the study proceeds, the electrophysiologist must recognize the implications of each finding and adjust the remainder of the study accordingly. All of this implies an intimate knowledge of the patient and the indications for this specific EPS as well as knowledge of clinical electrophysiology (EP) and testing techniques, including the risks and benefits associated with each test or maneuver. Clinical electrophysiology is recognized as a subspecialty of cardiology that requires substantial training and experience. Diagnostic and therapeutic (interventional or device) EPS should be performed only by physicians who have such a background.2,3
Catheter Electrode Insertion and Positioning
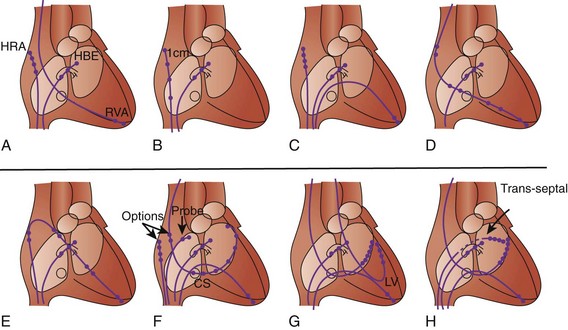
No single “correct rig” exists. Only the use of the Seldinger technique is virtually universal. Sites of insertion include brachial, subclavian, internal and external jugular, and femoral veins. The number of catheters used and the insertion sites also depend on the purpose of the EPS and on any intention of retaining one or more catheter electrodes (“wires”) for subsequent use another day. Some of the common variations are shown in Figure 20-1.
Trans-septal Puncture and Catheterization
The biggest danger associated with the trans-septal technique is tamponade caused by perforation of the left atrium, usually posteriorly. Several techniques have been used to reduce this risk. The literature suggests a comparably low incidence of complications with most techniques.4–6 Approaches to the pulmonary veins, presently a matter of interest in atrial fibrillation ablation, are almost exclusively via the trans-septal route, often with several punctures. It must be emphasized that the trans-septal technique is fraught with many subtleties and potential complications. The details are far beyond the scope of this section, and no one should attempt the technique only on the basis of general experience and a reading of this part of the text.
Epicardial Catheterization
Patients with tachycardia originating from the epicardial surface of the heart require mapping within the pericardial space. This technique was initially described by Sosa et al.7 When performing epicardial ablation, patients typically require general anesthesia. A coronary angiogram is required to avoid ablation of areas adjacent to the coronary arteries. The operator must also be cognizant of the course of the phrenic nerves so as to avoid diaphragmatic paresis.
Stimulation Techniques
Incremental/Decremental: How Fast Is That?
Ramps
With pacing, a series of stimuli is delivered, with each interstimulus interval successively differing from its predecessor. Most often, the interval decreases, resulting in progressively faster pacing during ramps.5 For example, stimulation could begin at a CL of 400 ms (150 beats/min), with each of 10 successive intervals shortening by 10 ms so that at the end of the ramp, the CL would be 300 ms (200 beats/min). Clinically, ramps are used for the assessment of conduction and for the initiation and termination of tachycardias. Ramps that start fast and then slow down are occasionally used in the treatment of tachycardias. The various uses of ramp pacing will be detailed in the sections below.
Stimulus Amplitude and Pulse Duration
These are particularly important during extrastimulus testing. Higher amplitudes and longer pulse durations permit more closely coupled stimuli to “capture” (depolarize) the heart.8,9 Excessively large stimuli may cause fibrillation. For these reasons, most EPSs involve stimuli at two to four times the diastolic threshold (in milliamperes or volts) and 1- to 2-ms pulse duration.10
Ultra-Rapid Train Stimulation
A series of stimuli are delivered at such a rapid rate (typical CLs are 10 to 60 ms) that it is not expected that each of these will capture the tissue being stimulated. The method helps assess vulnerability to inducible ventricular fibrillation (VF) by using progressively higher stimulus amplitudes with successive trains. With stimulus amplitudes in conventional pacing ranges, trains have been used for both initiation and termination of regular monomorphic tachycardias. At very low (subthreshold) amplitudes, trains have been used as a tool to alter local tissue responses, which, in turn, can affect certain tachycardias.11,12
Stimulation Protocols
Protocols did not come fully formed right at the beginning of clinical EP. Different centers around the world developed their own EP protocols. In general terms, broad differences are present in what constitutes a “complete” EPS. In more specific terms, differences exist in the sequence in which extrastimuli are delivered and in the stimulus amplitudes and pulse durations used. These differences can affect the sensitivity and the specificity of protocols and also the time required to complete a protocol. Over the years, demands for a “universal protocol” have been made, but such a protocol is not likely to come any time soon. Guidelines suggest that a given stimulation protocol must be able to reproduce clinical arrhythmia in at least 90% of cases.10
Effect of Signal Filtration and Interelectrode Spacing
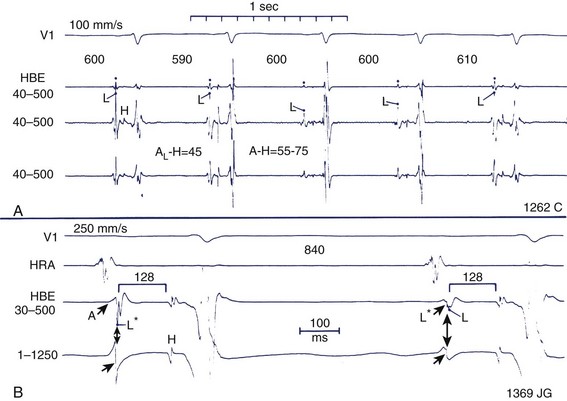
During EPSs, the scale of interest ranges from macro-events (When does the QRS complex start, or what is the QRS duration?) to micro-events (How many milliseconds does it take for a wavefront to move from the His bundle to the right bundle branch?) (Figure 20-2). The ability to distinguish between macro-events and micro-events is based on the effects of signal filtration and interelectrode spacing.
Timing of Electrical Events
Conduction in the heart is ionic rather than electronic or photonic. This means that conduction does not proceed at the speed of light but at millimeters to meters per second. This, in turn, means that it is possible to measure sequences of depolarization rather easily using simple calipers or rulers. As indicated in the previous section, filtration and interelectrode distance affect the ability to record events at varying distances from a given point within the heart. All recorded signals will have characteristics such as duration and amplitude. As a general rule, if one is looking for the first evidence of an electrical event, several simultaneously recorded leads are observed for the onset of a deflection that is used for the relevant measurement, and far-field signals are welcome in some instances. The local timing of an event is important during mapping studies, when the timing of an event at the site where the mapping electrode or probe is located is of interest. Here, far-field signals are unwelcome, and closely spaced electrodes filtered at 30 to 500 Hz are critical. However, for some measurements (e.g., the atrial deflection in the His bundle region) the local timing at 40 to 500 Hz corresponds to the intrinsic deflection of “less filtered” recordings (see Figure 20-2).13
When filtered at 30 to 500 Hz, the recorded electrograms take on a more jagged appearance, often with several sharp changes in direction. The total duration of the electrogram is less than that recorded at 0.5 to 100 Hz because less-far-field information is included. However, as previously indicated, the timing of the maximum or peak deflection can be similar for electrograms recorded at 0.5 to 100 Hz and 30 to 500 Hz.13 Similarly, if recordings are made in areas that are scarred or damaged, overall signal amplitude may be low (<1.0 mV), and a series of low amplitude deflections may be present, and none of them fulfills the criteria for local or intrinsic deflection. Usually, the first of the relatively larger deflections (this can be quite subjective) is used for local timing.
Electrophysiology Study
Choice of Surface Electrocardiogram and Intracardiac Recordings
Monophasic Action Potential Recordings
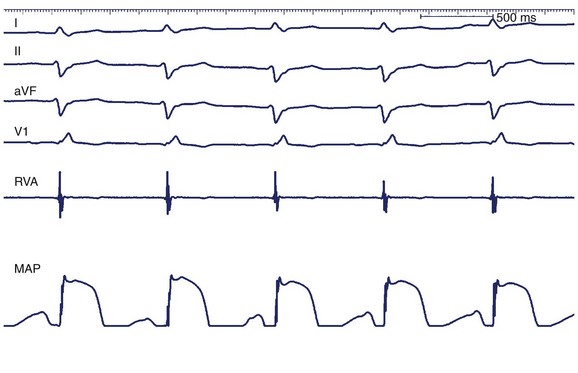
Monophasic action potential (MAP) recordings provide information about local transmembrane depolarization and repolarization. An MAP catheter has 5-mm–spaced, silver-silver chloride matrix electrodes that may be positioned into the atrium or the ventricle. Standard EP recording systems should be set to 0.05 to 1000 Hz to capture lower-frequency components of the action potential. Currently, MAP recordings provide insight into cellular EP and are largely used in clinical research (Figure 20-3).14
Extrastimulus Technique
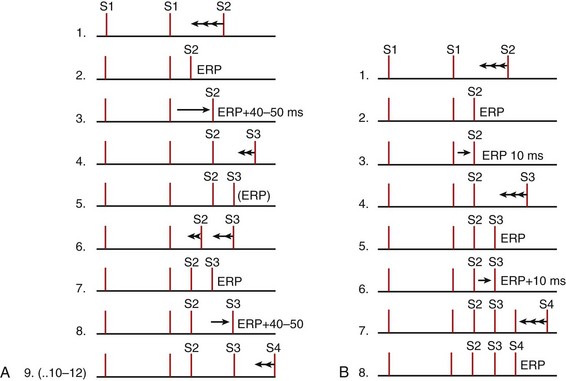
The extrastimulus technique (briefly introduced above) is the heart of EPSs used primarily for assessing refractoriness and tachycardia induction. Typically, the baseline drive comprises 8 beats, which may be sinus rhythm but are usually delivered at a constant CL (S1-S1) by a stimulator. The drive is then followed successively by single, double, and triple extrastimuli, which are designated S2, S3, and S4. Generally, the extrastimuli are initiated at 80% to 90% of the drive CL. All these stimuli are delivered with uniform specifications, usually 1- to 2-ms pulse duration and an amplitude two to four times the diastolic threshold. Of the various methods for shortening (decrementing) S1-S2 intervals and subsequently S2-S3, and S3-S4, most are variations of either the tandem method or the simple sequential method (Figure 20-4).15,16
Simple Sequential Method
A prospective randomized trial has demonstrated that the tandem method and the simple sequential method produce comparable results in terms of inducibility of the clinical arrhythmia, inducibility of “nonclinical” arrhythmias, and noninducibility.15 The simple sequential method takes significantly less time to perform.15
Refractory Periods and Conduction Intervals
Refractory Periods
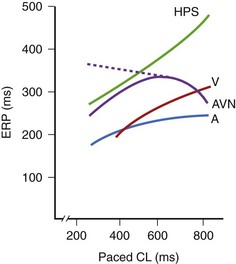
The classic technique is to deliver eight drive stimuli, all designated as S1. After the last S1, an extrastimulus (S2) is delivered at an interval somewhat shorter than the S1-S1 interval. The process is repeated with decrements in the S1-S2 interval, usually until S2 reaches refractoriness, that is, fails to capture. The S1-S2 interval is usually decremented in 10-ms steps, although 20-ms or even 30-ms steps may be used in clinical laboratories for very long S1-S2 intervals. Refractory periods tend to be shorter with shorter S1-S1 intervals. An exception is sometimes seen in the AV node, where refractory periods may be prolonged as the S1-S1 is decreased from 1000 ms to 600 ms but thereafter usually tend to shorten as the S1-S1 is further decreased (Figure 20-5). Depending on the objective of the EPS, refractory period testing may be carried out with stimulation at several atrial or ventricular sites and at two or more drive (S1-S1) CLs. Several different refractory periods warrant further discussion (see below).17–25
Effective Refractory Period
A downstream effect with ERPs occurs. If measured at the site of pacer stimulation, the interval set in the programmable stimulator can be read directly to determine the ERP. Suppose, however, one is interested in the ERP of the His bundle. If stimulation is delivered to the high right atrium (HRA) as is conventional, it may be necessary to reduce the S1-S2 interval to the point where the relative refractory period (RRP) (see below) of the atrium is reached, resulting in a prolonged conduction time from the HRA to the AVN–His bundle region. The impulse may also encounter the RRP of the AVN, further delaying the arrival of the wavefront generated by S2 at the His bundle. Thus, the H1-H2 interval will be substantially longer than the S1-S2 interval. Since in this case the tissue of interest is the His bundle, its ERP is defined as the longest H1-H2 interval that fails to propagate. As indicated, this may differ substantially from the S1-S2 delivered in the HRA. Often, the ERPs at a proximal site (e.g., the HRA) are longer than at distal sites, making it impossible to determine the ERP distally.17–25 The importance of taking the extra steps to correctly measure depends on the nature of the EPS.
Stay updated, free articles. Join our Telegram channel

Full access? Get Clinical Tree


