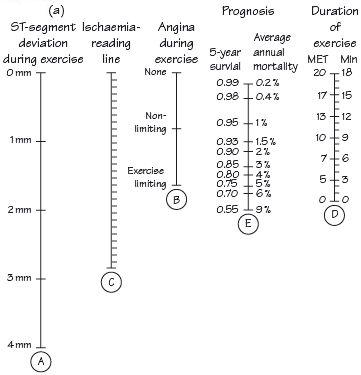
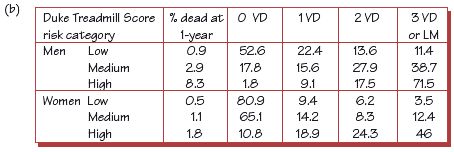
Fig. 19.2 (a) The Duke normogram. An exercise test using the Bruce protocol is undertaken. To obtain the risk of dying, a ruler is held between the mark for the amount of ST depression, and the presence or otherwise of angina during the test. A point is obtained on the ischaemia reading line; this point is then connected with a ruler to the duration of exercise column, allowing the 5-year survival rates to be obtained. The formula for the Duke normogram is Duke treadmill score = exercise time – (5 × max ST depression in millimetres) – (4 × angina index), where the angina index is: 0 = no angina; 1 = non-limiting angina; 2 = exercise limiting angina. Values between –25 (high risk) and 15 are obtained, and translated into 5-year mortality (b)VD, vessels significantly diseased with stenosis 75%; LM, left main stem disease.


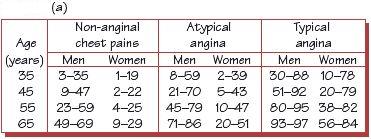
Fig. 19.3 (a) Pre-test probability of significant coronary artery disease (percentage with significant coronary artery disease). The first number is the percentage of patients without diabetes, smoking or hyperlipidaemia, and the second is for the same patients with these three risk factors. This data assumes normal resting ECGs; the probability of coronary artery disease (CAD) with abnormal resting ECGs is higher than here. The probability of coronary disease increases with increasing age, increasing number of CAD risk factors, and increasing typicality of classic anginal symptoms. Women have lower risks for coronary disease at every stage. (b) Severity of CAD related to symptoms. There clearly is a relationship, but it is surprisingly weak. This data emphasizes the need for additional risk stratification (e.g. exercise stress testing) beyond evaluating symptoms in managing chronic stable angina.

Stay updated, free articles. Join our Telegram channel

Full access? Get Clinical Tree


