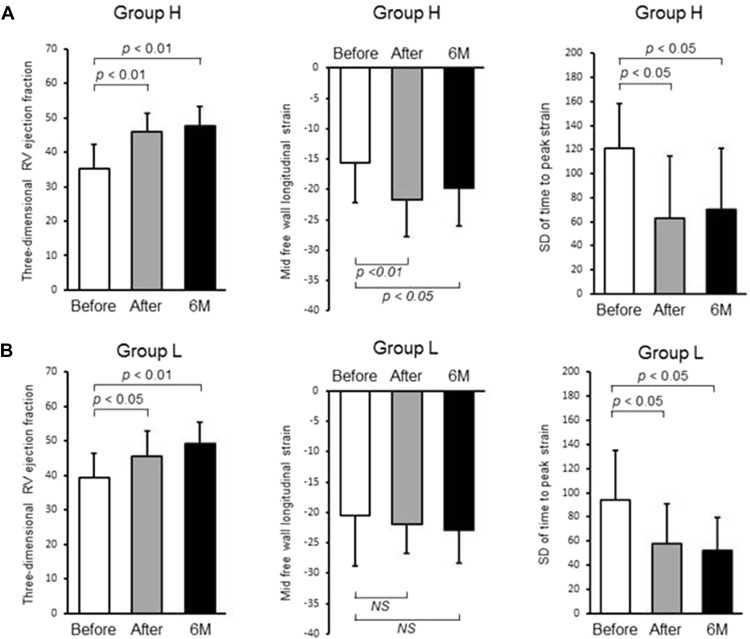
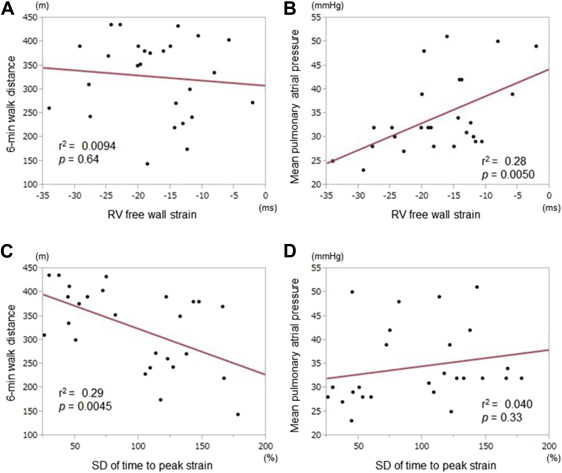
The aim was to investigate the effect of balloon pulmonary angioplasty (BPA) on right ventricular (RV) function in chronic thromboembolic pulmonary hypertension. Twenty-six patients with chronic thromboembolic pulmonary hypertension were enrolled and were divided into 2 groups, group H with high (>30 mm Hg) mean pulmonary arterial pressure and group L with low (25 to 30 mm Hg) mean pulmonary arterial pressure. RV function was assessed using 2-dimensional speckle-tracking echocardiography as well as 3-dimensional echocardiography, and RV dyssynchrony was assessed by the RV strain curves. Exercise capacity was evaluated by the 6-minute walk distance. RV dilatation was significantly reduced after BPA. In group H, RV ejection fraction, RV free wall longitudinal strain and RV dyssynchrony were all impaired before BPA and were ameliorated after BPA. In group L, RV ejection fraction as well as RV dyssynchrony were impaired without the reduction of RV free wall longitudinal strain and were improved after BPA, indicating that RV dysfunction may be attributable to the RV dyssynchrony in group L. Furthermore, RV dyssynchrony at baseline was the only parameter that was correlated with improvement in the 6-minute walk distance after BPA. RV dyssynchrony may affect RV function and could be the useful parameter for clinical outcome after BPA.
Chronic thromboembolic pulmonary hypertension (CTEPH) has a poor prognosis and the increase in vascular resistance due to progressive vascular remodeling can lead to right-sided cardiac failure. Recently, we reported that BPA improved right ventricular (RV) geometric deformation and RV dysfunction in patients with CTEPH and that the RV speckle-tracking technique using echocardiography might be useful for investigations of RV function to evaluate the effects of BPA. However, the precise mechanisms underlying RV dysfunction in patients with CTEPH remain to be determined. The aims were to investigate whether the effects of BPA on RV remodeling and RV function could be maintained at 6-month follow-up and to compare the mechanisms of RV dysfunction between the patients with low and high mean pulmonary arterial pressure before BPA. Finally, we also identified the parameter that could predict the improvement of exercise tolerance after BPA.
Methods
The present study was approved by the Ethics Committee of Keio University Hospital. Twenty-six patients with CTEPH, who underwent BPA from November 2012 to January 2015 and were followed up for at least 6 months, were included in the study. CTEPH was defined as previously described. Patients with lung disease, left-sided heart failure, including those with pulmonary capillary wedge pressure >15 mm Hg, and those with more than mild aortic and/or mitral valvular heart disease were excluded from the study. Patients were divided into 2 groups depending on mean pulmonary arterial pressure, namely those with high (>30 mm Hg) mean pulmonary arterial pressure (group H; n = 16) and those with low (25 to 30 mm Hg) mean pulmonary arterial pressure (group L; n = 10). Right-sided cardiac catheterization and echocardiography, including 2-dimensional speckle-tracking echocardiography and 3-dimensional transthoracic echocardiography, were performed at baseline (before), immediately after, and then again 6 months after BPA.
Pulmonary arterial pressure, right atrial pressure, pulmonary capillary wedge pressure, and cardiac output were measured by right-sided cardiac catheterization. Cardiac output was assessed using the Fick technique. Balloon pulmonary angioplasty (BPA) was performed (6 ± 2 times), as previously described.
Echocardiography was performed using a Vivid-E9 ultrasound system (GE Healthcare, Horten, Norway). To get the RV strain curves, gray scale imaging of the RV-focused 4-chamber view was obtained with a frame rate of 40 to 80 Hz, and recordings were processed with acoustic-tracking software (EchoPAC; GE Healthcare), allowing off-line semiautomated speckle-based strain analysis. Briefly, lines were first manually traced along the RV endocardium, and then an additional epicardial line was automatically generated by the software to create a region of interest. After manually adjusting the region of interest shape, the software divided the RV region into 6 segments and generated the longitudinal strain curve . We set the 0 strain point as the time from the beginning of the QRS wave by electrocardiogram and measured negative peak strain during ventricular systole. In addition, RV dyssynchrony was quantified using the SD of the heart rate–corrected intervals from QRS onset to peak negative strain for the 6 segments (SD of time to peak strain), as described previously. Three-dimensional echocardiographic images were obtained from the apical window, as described previously. Echocardiographic imaging results were stored digitally for offline analysis using TomTec 4D RV Function software (4D analysis; TomTec, Munich, Germany). Within the 3-dimensional data set, 3 orthogonal main cut planes were selected to define the end-diastolic and end-systolic frames within the sequence as well as several landmarks. On the basis of the initial view adjustment and the landmarks, the program automatically provides 4-chamber view, sagittal, and coronal RV views. RV end-diastolic volume, RV end-systolic volume, and RV ejection fraction were measured from each 3-dimensional echocardiographic data set.
Patients were subjected to the 6-minute walk distance test at baseline and 6 months after BPA. At the 6-month time point, patients were divided into 2 groups, those exhibiting a >15% improvement on the 6-minute walk distance (n = 16) and those exhibiting a <15% improvement.
Continuous variables are reported as the mean ± SD. Hemodynamic and RV functional parameters just after BPA and at 6 months were compared with baseline using paired t tests. Associations between variables were assessed by liner regression analysis. Receiver-operating characteristic curves and their area under the curve were estimated based on Mann–Whitney U tests, and the null hypothesis on the area under the curve C ( H 0 : area under the curve = 0.5) was tested. Responders in the analysis were defined as those exhibiting a >15% improvement on the 6-minute walk distance. Two-tailed p <0.05 was considered significant. All statistical analyses were performed using JMP 11.0 software (SAS Institute, Cary, North Carolina).
Results
The baseline clinical characteristics for all patients in the study (n = 26) are given in Table 1 . The changes in clinical, hemodynamic, and echocardiographic parameters immediately after and then again 6 months after BPA are listed in Tables 2 and 3 . World Health Organization functional class and plasma concentrations of brain natriuretic peptide were significantly improved after BPA. Furthermore, mean pulmonary arterial pressure and pulmonary vascular resistance were significantly improved immediately after BPA, and these effects were maintained at the 6-month follow-up (p <0.05 for all). However, there was no change in left ventricular function from baseline to after BPA, although left ventricular end-diastolic diameter was significantly increased. In contrast, echocardiographic parameters of RV systolic function, including RV fractional area change, RV free wall strain, and 3-dimensional RV ejection fraction, were significantly ameliorated after BPA, and these effects were maintained over 6 months. However, no improvements were seen in other conventional RV parameters, such as RV S′, and RV index of myocardial performance ( Table 4 ).
| All patients (n=26) | |
|---|---|
| Age (year) | 63 ± 16 |
| Female | 20 (77%) |
| Body surface area (m 2 ) | 1.6 ± 0.2 |
| Systolic blood pressure (mm Hg) | 113 ± 17 |
| Diastolic blood pressure (mm Hg) | 67 ± 14 |
| Heart rate (beats/min) | 68 ± 13 |
| World health organization functional class I/II/III/IV | 0/5/18/3 |
| Borg dyspnea score | 2.4 ± 2.0 |
| Home oxygen therapy | 23 (88%) |
| Medications at baseline | |
| Phosphodiesterase type 5 inhibitor | 18 (72%) |
| Endothelin receptor antagonist | 12 (46%) |
| Prostanoid | 11 (40%) |
| Calcium channel blockers | 5 (20%) |
| Vitamin K antagonist | 26 (100%) |
| Uric acid (mg/dL) | 6.3 ± 1.4 |
| Brain natriuretic peptide (pg/mL) | 106 ± 176 |
| 6-minute walk distance (m) | 327 ± 84 |
| Balloon pulmonary angioplasty sessions | 6 ± 2 |
| Before balloon Pulmonary angioplasty | Immediately after balloon pulmonary angioplasty | Six months after balloon pulmonary angioplasty | |
|---|---|---|---|
| Mean pulmonary arterial pressure (mmHg) | 38.3 ± 8.4 | 18.0 ± 4.2 ∗ | 18.5 ± 4.2 ∗ |
| Mean right atrium pressure (mmHg) | 6.0 ± 3.1 | 1.9 ± 1.7 ∗ | 3.1 ± 2.1 ∗ |
| Pulmonary capillary wedge pressure (mmHg) | 8.9 ± 3.5 | 6.7 ± 3.5 † | 7.0 ± 3.2 † |
| Pulmonary vascular resistance (dyne • sec • cm -5 ) | 717.2 ± 331.2 | 258.8 ± 121.3 ∗ | 241.8 ± 90.3 ∗ |
| Cardiac index (L/min/m 2 ) | 2.3 ± 0.6 | 2.3 ± 0.5 | 2.4 ± 0.6 |
| Subjects (n = 26) | Before balloon Pulmonary angioplasty | Immediately after balloon pulmonary angioplasty | Six months after balloon pulmonary angioplasty |
|---|---|---|---|
| Systolic blood pressure (mmHg) | 112.8 ± 16.7 | 113.8 ± 15.8 | 116.3 ± 17.9 |
| Diastolic blood pressure (mmHg) | 66.8 ± 14.8 | 65.9 ± 9.5 | 66.8 ± 10.3 |
| Heart rate (beats/min) | 67.0 ± 13.9 | 63.3 ± 9.4 | 62.6 ± 10.3 |
| Left ventricular end-diastolic diameter (mm) | 40.2 ± 5.6 | 43.4 ± 3.8 ∗ | 43.5 ± 4.2 ∗ |
| Left ventricular end-systolic diameter (mm) | 24.8 ± 4.3 | 26.2 ± 3.6 | 26.3 ± 3.2 |
| Left ventricular ejection fraction (%) | 71.9 ± 7.2 | 70.2 ± 7.4 | 70.0 ± 5.7 |
| E (cm/s) | 62.9 ± 17.9 | 62.4 ± 15.9 | 70.3 ± 19.5 |
| A (cm/s) | 74.9 ± 19.5 | 73.7 ± 21.2 | 74.9 ± 20.0 |
| E/A ratio | 0.9 ± 0.4 | 0.9 ± 0.3 | 1.0 ± 0.4 |
| E’ (cm/s) | 8.5 ± 2.7 | 8.9 ± 3.2 | 8.4 ± 2.2 |
| E/E′ ratio | 7.9 ± 2.5 | 7.6 ± 3.0 | 8.6 ± 2.4 |
| Brain natriuretic peptide (pg/mL) | 106.4 ± 176.4 | 27.6 ± 22.2 ∗ | 40.0 ± 41.3 ∗ |
| Uric Acid (mg/dL) | 6.3 ± 1.4 | 6.0 ± 2.1 | 6.1 ± 1.9 |
| World health organization functional class | 2.9 ± 0.6 | 1.2 ± 0.4 † | 1.2 ± 0.4 † |
| 6-minute walk distance (m) | 326.8 ± 83.7 | 400.3 ± 77.4 † |
∗ p <0.05 versus before balloon pulmonary angioplasty.
| Before balloon Pulmonary angioplasty | Immediately after balloon pulmonary angioplasty | Six months after balloon pulmonary angioplasty | |
|---|---|---|---|
| Right ventricular basal diameter (mm) | 33.9 ± 7.0 | 31.3 ± 7.1 | 30.2 ± 7.2 ∗ |
| Right ventricular mid cavity diameter (mm) | 30.8 ± 8.1 | 28.3 ± 7.0 | 26.5 ± 7.6 ∗ |
| Right ventricular longitudinal diameter (mm) | 75.4 ± 9.1 | 71.4 ± 11.3 | 71.8 ± 8.0 ∗ |
| Right ventricular end-diastolic area (cm 2 ) | 25.1 ± 6.7 | 20.2 ± 4.8 † | 20.4 ± 5.2 † |
| Right ventricular end-systolic area (cm 2 ) | 19.7 ± 6.4 | 14.4 ± 3.7 † | 13.7 ± 3.9 † |
| Right ventricular fractional area change (%) | 22.6 ± 7.7 | 29.1 ± 7.6 † | 32.8 ± 6.5 † |
| Tricuspid annular plane systolic excursion (mm) | 15.1 ± 3.7 | 16.7 ± 3.1 † | 17.1 ± 3.2 † |
| Right ventricular S′ (cm/sec) | 10.9 ± 2.0 | 11.7 ± 2.5 | 11.5 ± 1.8 |
| Right ventricular index of myocardial performance | 0.4 ± 0.1 | 0.4 ± 0.0 | 0.5 ± 0.1 |
| Base septal wall right ventricular longitudinal strain (%) | −16.0 ± 3.7 | −16.8 ± 2.9 | −16.1 ± 2.9 |
| Mid septal wall right ventricular longitudinal strain (%) | −16.2 ± 3.8 | −17.8 ± 4.3 | −16.8 ± 2.3 |
| Apex septal wall right ventricular longitudinal strain (%) | −9.3 ± 5.2 | −9.1 ± 5.1 | −10.1 ± 5.3 |
| Base free wall right ventricular longitudinal strain (%) | −18.2 ± 8.3 | −22.8 ± 8.2 | −22.9 ± 8.6 |
| Mid free wall right ventricular longitudinal strain (%) | −17.5 ± 7.6 | −21.8 ± 5.5 ∗ | −21.0 ± 6.0 ∗ |
| Apex free wall right ventricular longitudinal strain (%) | −12.6 ± 5.9 | −13.4 ± 6.3 | −15.2 ± 8.1 |
| Global right ventricular longitudinal strain (%) | −13.3 ± 4.1 | −16.5 ± 3.8 † | −16.3 ± 4.6 ∗ |
| Three-dimensional right ventricular end-diastolic volume index (mL/m 2 ) | 72.3 ± 28.1 | 57.0 ± 15.1 ∗ | 59.0 ± 13.6 † |
| Three-dimensional right ventricular end-systolic volume index (mL/m 2 ) | 47.8 ± 18.0 | 31.1 ± 10.3 † | 30.6 ± 9.1 † |
| Three-dimensional right ventricular ejection fraction (%) | 36.9 ± 7.3 | 45.8 ± 6.1 † | 48.3 ± 5.8 † |
Stay updated, free articles. Join our Telegram channel

Full access? Get Clinical Tree


