The thinner-walled atrial chambers generally respond to both of these overloads with characteristic changes in the electrocardiogram (ECG). The usual terms for enlargement of the atria are right-atrial enlargement (RAE) and left-atrial enlargement (LAE). Indeed, “overload” rather than “enlargement” might be a more accurate general term for the ECG changes seen with enlargement because electrical effects may occur before measurable dilation or hypertrophy of the affected chamber (as can be seen by echocardiography).
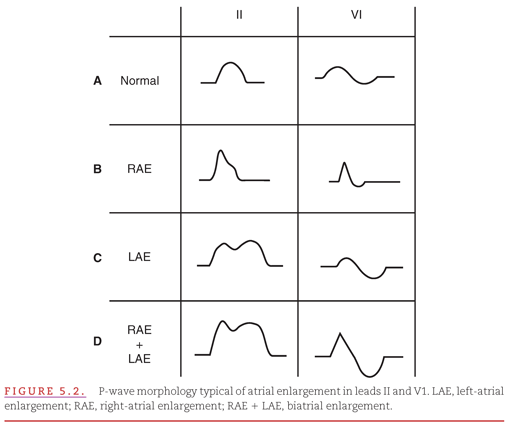
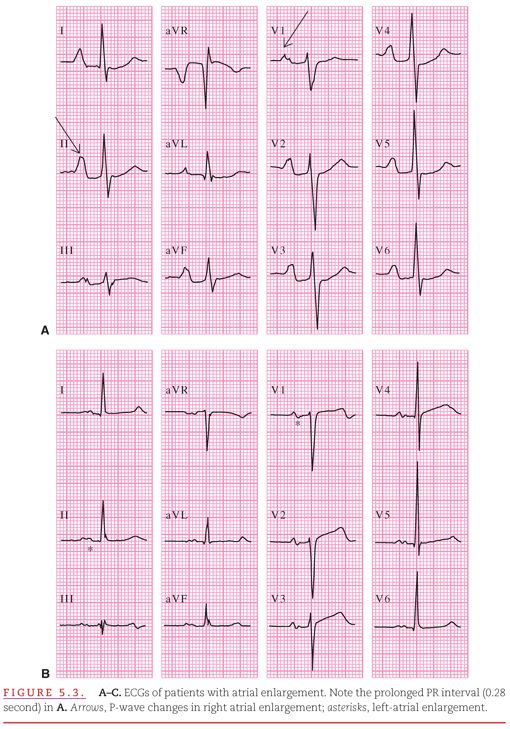
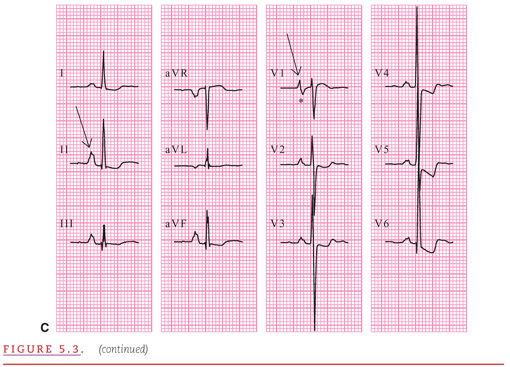
The ECG evaluation of RAE and LAE is facilitated by the differing times of initiating activation of the two atria and by the differing directional spread of activation in each. As indicated in Figure 2.5, the optimal lead for differentiating left versus right cardiac activity is V1, with its positive electrode in the fourth intercostal space at the right sternal border (see Fig. 2.6). Right-atrial activation begins first. It proceeds from the sinoatrial (SA) node in an inferior and anterior direction and produces the initial deflection of the P wave, which has a positive direction in all leads except aVR (Fig. 5.2). Left-atrial activation begins later. It proceeds from high in the interatrial septum in a left, inferior, and posterior direction. This produces the final deflection of the P wave, which is positive in long-axis lead II but negative in short-axis lead V1 (see Fig. 5.2). Therefore, RAE is characterized by an increase in the initial deflection (see Figs. 5.2B and 5.3A) and LAE by an increase in the final deflection of the P wave (see Figs. 5.2C and 5.3B). In most of the other standard leads, both the right- and left-atrial components of the P wave appear as similarly directed deflections. An increase in both the initial and final aspects of the P wave suggests biatrial enlargement (see Figs. 5.2D and 5.3C).
SYSTEMATIC APPROACH TO THE EVALUATION OF ATRIAL ENLARGEMENT
The systematic approach to waveform analysis introduced in Chapter 3 can be applied to the evaluation of atrial enlargement (see Fig. 5.2).
General Contour
The smooth, rounded contour of the P wave is changed by RAE, which gives the wave a peaked appearance. LAE causes a notch in the middle of the P wave, followed by a second “hump.” In leads such as II, the P waves of RAE have an A-like appearance (termed P pulmonale), and the changes of LAE have an M-like appearance (termed P mitrale).
P-Wave Duration
RAE does not affect the duration of the P wave. LAE prolongs the total P-wave duration to >0.12 second. It also prolongs the duration of the terminal, negatively directed portion of the P wave in lead V1 to >0.04 second.
Positive and Negative Amplitudes
RAE increases the maximal amplitude of the P wave to >0.20 mV in leads II and aVF and to >0.10 mV in leads V1 and V2. Usually, LAE does not increase the overall amplitude of the P wave but increases only the amplitude of the terminal, negatively directed portion of the wave in lead V1 to >0.10 mV.
Axis in the Frontal and Transverse Planes
Estimate the axes of the P wave in the two electrocardiographic planes. RAE may cause a slight rightward shift and LAE may cause a slight leftward shift in the P-wave axis in the frontal plane. However, the axis usually remains within the normal limits of 0 degrees to +75 degrees.
With extreme RAE, the P wave may be inverted in lead V1, creating the illusion of LAE. With extreme LAE, the P-wave amplitude may increase and the terminal portion of the wave may become negative in leads II, III, and aVF. Biatrial enlargement produces characteristics of RAE and LAE (see Figs. 5.2D and 5.3C).
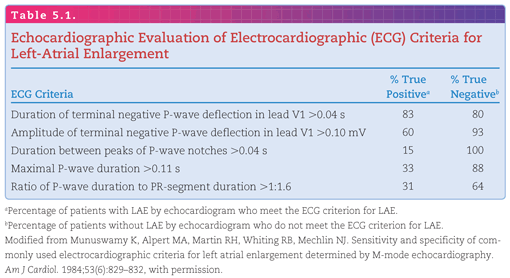
Munuswamy and colleagues,2 using echocardiography as the standard for determining LAE, have evaluated the percentage of patients with truly positive and truly negative ECG criteria for LAE (Table 5.1). They found that the most sensitive criterion for LAE is an increased duration (>0.04 second) of the terminal, negative portion of the P wave in lead V1, whereas the most specific criterion for LAE is a wide, notched P wave that resembles the P wave seen in the case of an intra-atrial block.
The thick-walled ventricles dilate in response to receiving an excess volume of blood during diastole, and they become hypertrophied in response to exerting excess pressure in ejecting the blood during systole (Fig. 5.4). Volume overload in the ventricles may be caused by regurgitation of blood through a leaking outflow valve back into the partially emptied ventricle (see Fig. 5.4A). Pressure overload caused by obstruction to ejection through a narrowed outflow valve is displayed in Figure 5.4B. Enlargement of the right or left ventricle is commonly accompanied by enlargement of its corresponding atrium. Therefore, ECG findings that meet the criteria for atrial enlargement should be considered suggestive of ventricular enlargement.
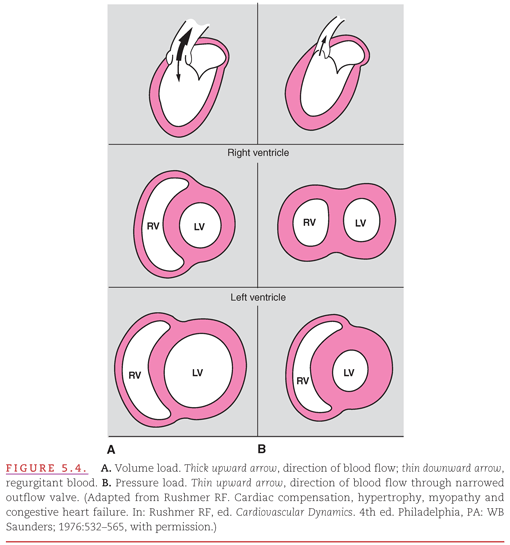
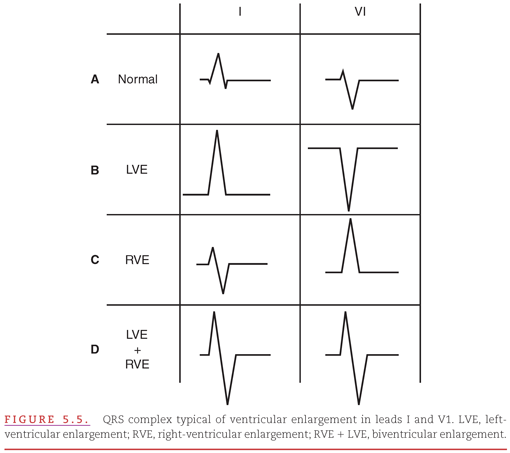
Figure 5.5 illustrates the typical changes in the QRS waveforms that occur with enlargement of the ventricles. In the absence of either right- or left-ventricular enlargement, a predominantly positive QRS complex appears in lead I and a predominantly negative QRS complex appears in lead V1 (see Fig 5.5A). These QRS complexes increase in amplitude but do not change in direction with left-ventricular enlargement (see Fig. 5.5B). With right-ventricular enlargement, however, the directions of the overall QRS waveform reverse to predominantly negative in lead I and predominantly positive in lead V1 (see Fig. 5.5C). With combined right- and left-ventricular enlargement, a hybrid of these waveform abnormalities results (see Fig. 5.5D).
The right ventricle dilates either during compensation for volume overload or after its hypertrophy eventually fails to compensate for pressure overload. Because of this dilation, the right ventricle takes longer to activate than is normally the case. Instead of completing its activation during the midportion of the QRS complex (see Chapter 1), the dilated right ventricle contributes anterior and rightward forces during the time of completion of left-ventricular activation. Thus, the frontal plane QRS axis shifts rightward and an RSR′ pattern appears in leads V1 and V2, with an appearance similar to that in incomplete right-bundle-branch block (RBBB; see Chapter 6). The duration of the QRS complex may become so prolonged that the ECG changes occurring in right-ventricular dilation mimic those in complete RBBB. These ECG changes may appear during the early or compensatory phase of volume overload or during the advanced or failing phase of pressure overload.3
The right ventricle hypertrophies because of compensation for pressure overload. The final third of the QRS complex is normally produced solely by activation of the thicker walled left ventricle and interventricular septum. As the right ventricle hypertrophies, it provides an increasing contribution to the early portion of the QRS complex and also begins to contribute to the later portion of the complex.
Lead V1, with its left-to-right orientation, provides the optimal view of the competition between the two ventricles for electrical predominance. As shown in Figure 5.5A, the normal QRS complex in the adult is predominantly negative in lead V1, with a small R wave followed by a prominent S wave. When the right ventricle hypertrophies in response to pressure overload, this negative predominance may be lost, producing a prominent R wave and a small S wave (see Fig. 5.5C
Stay updated, free articles. Join our Telegram channel

Full access? Get Clinical Tree


