Chapter 12 Cardiac Performance
INTRODUCTION
An assessment of cardiac performance constituted the first nuclear cardiology studies performed in man. As early as 1927, Blumgart and Weiss in a series of elegant papers identified characteristics of hemodynamic performance as measured by circulation times in normals and in patients with significant cardiovascular disease, utilizing injected radon followed by measurements obtained with a modified Wilson cloud chamber over the thorax and contralateral upper extremity.1 These pioneering studies called attention to the potential of utilizing radioisotope technology for answering relevant clinical questions.
Presently, cardiac performance can be evaluated by nuclear cardiology in three general manners. Two involve measurement of radioactivity within the blood pool, while the third applies the principles of electrocardiography (ECG) gating to conventional myocardial perfusion single-photon emission computed tomography (SPECT) studies. This latter technique is discussed in detail in Chapter 13 and consequently will not be developed here. This chapter will concentrate on the initial techniques of equilibrium intravascular labeling, which allows repeated imaging over several hours (equilibrium radionuclide angiocardiography [ERNA]), and the first-pass technique during which analysis of the first transit of a radionuclide bolus through the central circulation is assessed (first-pass radionuclide angiocardiography [FPRNA]). Although the intravascular radionuclide approaches for the evaluation of ventricular function have been challenged by both echocardiography and gated perfusion SPECT, these specific techniques still play a role in the quantitative assessment of cardiac performance. These intravascular approaches and their clinical implications and applications are discussed subsequently.
EQUILIBRIUM RADIONUCLIDE ANGIOCARDIOGRAPHY
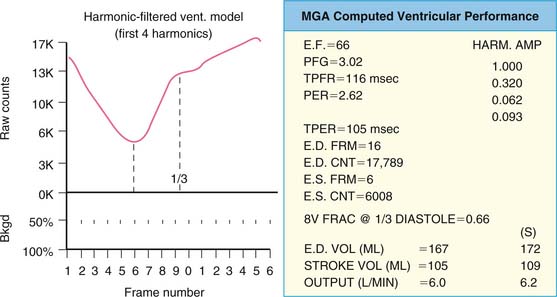
The basic concept of utilizing a physiologic input to “gate” or physiologically control radioisotope-labeled equilibrium cardiac blood pool data to measure left ventricular ejection fraction was first introduced in 1971.2,3 The physiologic signal chosen was the electrocardiogram, and the blood pool was initially labeled with technetium 99mTc human serum albumin. Left ventricular ejection fraction was measured and regional wall motion assessed visually from end-systolic and end-diastolic summed data.2 This approach built on earlier studies whereby “gating” had been achieved with intravenous first-pass or intraventricular injections of radioisotope and left ventricular ejection fraction evaluated from respective maxima and minima of the generated curves.4–7 ERNA uses the electrocardiographic signal to establish the temporal relationships between acquired nuclear data and volumetric events of the cardiac cycle. To accomplish this, sampling is performed during the time of radioisotopic equilibrium within the blood pool such that sequential data can be summed over several hundred cardiac cycles. These data are then segregated physiologically according to their time of occurrence within the cardiac cycle as determined by the simultaneously acquired electrocardiogram (Fig. 12-1). Data are accumulated until the radioactive count density over the cardiac region of interest is of sufficient magnitude for generation of statistically meaningful analysis. The data from the individual components of this temporal segregation of nuclear data are displayed in an endless-loop scintigraphy movie and as a ventricular volume curve for qualitative visual assessment as well as for quantification of global left ventricular function (Fig. 12-2).
Technical Issues
The duration of study necessitated by utilizing the equilibrium technique can be both an advantage and a disadvantage.8 Because studies involve summation of several hundred cardiac cycles, a number of time-related specific issues must be considered. First, the patient must be able to remain relatively still beneath the detector during the period of acquisition. Second, most studies continue to be obtained with the planar technique. Consequently, data are acquired in multiple views in order for complete interpretation. Generally, this involves the anterior, left anterior oblique, and either left lateral or left posterior oblique views. The need for multiple views is inherent in the planar technique to account for superimposed radioactivity in multiple cardiac and noncardiac structures that can at times obscure analysis of a given region of interest. Such views are also important for defining specific regional left ventricular abnormalities such as ventricular aneurysm or severe akinesis. Third, intrinsic to this approach is the assumption that cardiac performance will remain relatively stable during the entire period of acquisition. Such stability is not present in instances of rapidly changing ventricular responses to atrial fibrillation or frequent premature beats of either ventricular or atrial origin. Fourth, the radionuclide label must remain stable during the period of analysis. (For conventional clinical imaging, this is usually not a problem). Fifth, the framing acquisition interval also must be of sufficient duration to allow statistically meaningful data as well as adequate temporal resolution for definition of parameters of systolic and diastolic ventricular performance.
Gated Blood Pool Single-Photon Emission Computed Tomography
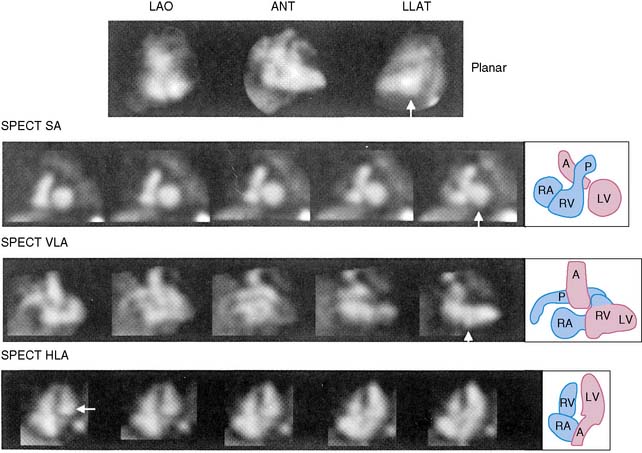
The equilibrium radionuclide technique can also be readily applied to SPECT rather than planar studies.9–14 SPECT blood pool imaging would have some obvious advantages with respect to three-dimensional visualization and elimination of problems induced by overlapping structures (Fig. 12-3). Recently, new algorithms have been developed to improve calculations of both left ventricular ejection fraction and ventricular volumes from gated SPECT studies. It is likely that algorithms such as those recently proposed will enhance the ability to move gated SPECT technology from the research to the clinical environment for assessment of ventricular function.14 However, at the present time, work has been primarily experimental, and advantages have not been of sufficient magnitude to replace the less time-consuming and complex planar approach.
A recent study by Nichols et al. analyzed automated quantitative analysis of gated blood pool SPECT for assessing regional and global wall motion using magnetic resonance imaging as a standard. They found good agreement with independent magnetic resonance imaging calculations and demonstrated that the automated technique was superior to visual analysis.14
Performance
Labeling of the blood pool at equilibrium is obtained using 99mTc fixed to the patient’s own red blood cells.16 This technique is standard and can be done using either an in vitro or modified in vivo technique employing unlabeled stannous pyrophosphate as a facilitator of the labeling process. The in vitro approach has a labeling efficiency of greater than 97% and is the current method of choice.15 A single labeling procedure will involve sufficient radioactivity present in the blood pool to allow for serial studies over a period of 4 to 6 hours. A dose of 25 to 30 mCi is used.
Conventional Anger scintillation cameras are used for these studies. If planar imaging devices are not available, then the single head of a SPECT instrumentation camera can be employed. A 64 ∞ 64 matrix should be used. Pixel size should be less than 4 mm/pixel. No zoom should be applied to a 10-inch field of view camera, and 1.5 to 22 zoom used in a large field of view camera.16 Data are analyzed by computer, either totally automatically or with operator interaction. There must be sufficient radioactivity within the field to allow for quantitative analysis. Generally, studies are acquired over sufficient time to accumulate greater than 4 million counts. At the present time, most studies are performed in the resting state. This evaluation can be performed in multiple views within 15 minutes. Collimation generally involves low-energy high-resolution collimators. If exercise studies are used, high-sensitivity collimators or low-energy all-purpose or low-energy high-sensitivity collimators should be used. Background subtraction is necessary because there is activity throughout the intravascular space. In some programs, the background region is placed 4 pixels outside the lateral border of the left ventricular region of interest. In other programs, this may be done manually. In either case, it is key to be sure that background is not chosen over a very high count area such as the aorta or spleen, since this will lead to erroneous measurements.16
There are two general modes of data acquisition: frame mode or list mode. At the present time, frame mode is most widely used.16–18 In this approach, a specified duration for each portion of the cardiac cycle is established. For resting studies this usually is between 10 and 40 msec or, generally, 16 frames/cycle, depending on the patient’s intrinsic heart rate and the conditions of the study. This same frame duration will be utilized throughout the study, irrespective of any changes in the heart rate. Beat rejection programs are possible, which allow after the fact elimination of pre-specified duration premature and post-extrasystolic beats. A 10% to 15% window around the R-R peak is standard, and beats not falling within this window are rejected. This window will take into account normal physiologic variability. With list mode, analysis is made after acquisition and depends on cycle length. Consequently, with this technique a more accurate evaluation can be obtained in the presence of changes in cardiac cycle length. However, this approach is a bit more complicated and expensive and is for the most part limited to research studies.
where bc = background corrected. With this technique, the lower count of normal is 0.50 (50%).18 In addition to the conventional measurement of left ventricular ejection fraction, other indices of left ventricular ejection as well as ventricular filling can be made. These include ejection time, ejection rate, peak filling rate, and time to peak filling rate. Filling indices are measured in units of end-diastolic volumes per second (EDV/sec, normal < 2.5). To measure diastolic parameters, data must either be acquired at higher temporal resolution (i.e., 24 frames/R-R cycle) or have Fourier filtering applied to the standard 16 frame/cycle ERNA.19 In the generated volume curve, a smooth diastolic upslope concludes with a visible “atrial kick” (see Fig. 12-2).
Ventricular volumes can also be determined by count-based methods. Because at equilibrium blood pool radioactivity is proportional to volume, by using an appropriate region of interest and accounting for attenuation, it is possible to measure chamber volume.20–23 This may be accomplished by either acquisition and counting of a reference blood sample or by measuring pixel size for calibration. Volumes measured in this manner correlate well with other analyses. Because analysis is count-based, the data are free from errors associated with geometric analysis of volume. Ventricular volume measurements are increasingly important clinically with respect to serial monitoring and assessing ventricular remodeling.
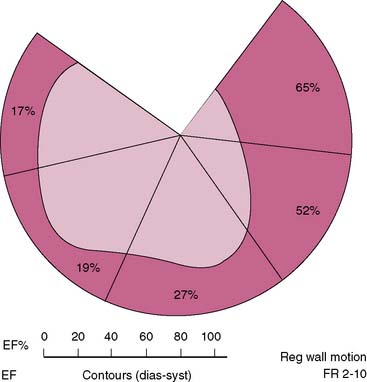
Interpretation of ERNA studies requires both visual and quantitative analysis. Quantitative evaluation of right ventricular function is difficult with this technique because of contamination from anterior overlying right atrial activity. Consequently, right ventricular global function is best evaluated by concomitant first-pass techniques.24,25 The degree of left anterior obliquity chosen for ERNA requires operator interaction to ensure optimal separation of right and left ventricles. This is generally achieved at a 45-degree angle but often requires operator interaction to account for individual anatomic variation. From this view, measurement of global left ventricular function such as LV ejection fraction is obtained. Each of the three views employed provides qualitative information concerning regional contraction. The left anterior oblique view provides views of the septal, inferoapical, and lateral walls. The anterior view provides information concerning contraction of the anterior and apical segments. The left lateral or left posterior oblique views allow insight into contraction of the inferior wall and posterobasal segments. In addition, since the entire intravascular blood pool is labeled, information is derived concerning all cardiac and vascular structures such as the atria, aorta, and pulmonary vasculature. Regional function can also be quantified utilizing regional ejection fraction measurements with this approach; the left ventricular blood pool is divided into four to five segments, and ejection fraction is derived from each segment (Fig. 12-4).26,27 This analysis is also done in the left anterior oblique view.
Phase Imaging
Parametric phase images are derived from the same radionuclide data utilized for standard ERNA measures of right and left ventricular function.28,29 Commercially available computer programs are utilized. A phase angle is assigned to each pixel of the phase image. This is derived from the first Fourier harmonic of time. The phase angle ( ) corresponds to the relative pattern and sequence of contraction in the cardiac chamber of interest throughout a single cardiac cycle. Generally, color coding is used and corresponding histograms are generated in each study. Dyssynchrony of cardiac contraction, whether intraventricular or interventricular, is evaluated from the difference in appropriate mean phase angles (Fig. 12-5). In the case of intraventricular dyssynchrony, right ventricle–left ventricle delays are evaluated. In the case of intraventricular dyssynchrony, this is measured by the standard deviation of the mean phase angle for the left ventricle. The technique has been used to identify sites of bypass tracks, sites of arrhythmogenesis, and altered contraction patterns in cardiomyopathy, and to assess the impact of biventricular pacer resynchronization therapy on the efficiency of cardiac contraction.20–34 The technique has also recently been employed to localize ventricular tachycardia exit sites as well as subsequent contraction sequence and functional effects of arrhythmia. In this very technically challenging study, a total of 26 patients with 32 episodes of ventricular tachycardia were studied. This occurred both in the electrophysiology laboratory and spontaneously. The phase analysis technique was quite accurate when compared to electrophysiologic study for defining exit site of the arrhythmia. In addition, there were good correlations between the imaging findings and the patient’s ability to tolerate the specific arrhythmia.34
Ambulatory Monitoring
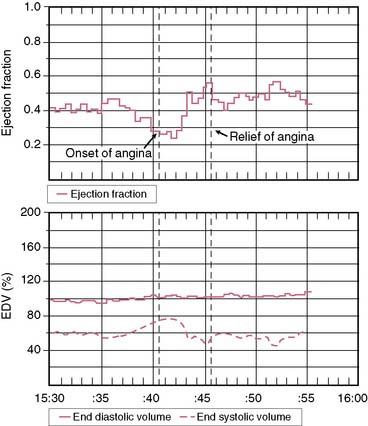
An additional application of the ERNA principle involves utilization of miniaturized portable equipment for monitoring patients during routine activities.35 Instrumentation has been developed that allows for monitoring over several hours following equilibrium blood pool labeling. The device, called the VEST, is worn by patients such that they may be fully ambulatory. Radionuclide and electrocardiographic signals are stored on tapes comparable to Holter monitoring for analysis of arrhythmias. Off-line analysis allows trending of data concerning left ventricular ejection fraction and relative volumes (Fig. 12-6). This approach has been standardized in several laboratories and has been utilized for the assessment of silent myocardial ischemia as well as pharmacologic intervention.36–38 Newer-generation equipment has been developed for this assessment.


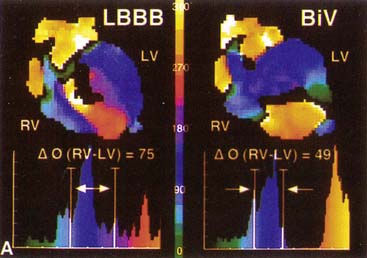
 ) computed for RV and LV blood pools. On the left, an abnormal phase pattern in sinus rhythm with right-to-left ventricular contraction sequence is noted. The left ventricular apex and septum contract with extreme delay in phase with atrial systole (orange segment at top of figure). The histogram illustrates abnormal dispersion of phase angles spanning the cardiac cycle with a Δ
  of 75 degrees. At the right, a characteristic apex to base contraction sequence during biventricular pacing is noted. The phase pattern is more symmetric across the interventricular septum. Despite close proximity to pacing stimulus sites (green), the LV apex (yellow) fails to contract in sequence. A decrease in phase angle occurs with pacing.