Blood-Gas Transport
OXYGEN TRANSPORT
Oxygen is relatively insoluble in aqueous solutions like blood. Dissolved oxygen alone is insufficient to meet the demands of tissue metabolism. Therefore, an alternate means of transporting oxygen is essential. Oxygen binds reversibly to hemoglobin, enhancing the effective solubility of O2 in blood, and enabling the transport of significant amounts of oxygen—approximately 20 mL/100 mL of blood at a hemoglobin concentration of 150 g/L.
 OXYGEN DISSOCIATION CURVE
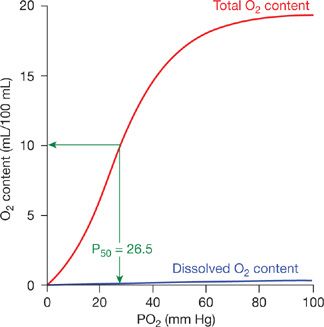
The oxygen dissociation curve represents the relationship between the oxygen content of blood and the partial pressure of oxygen to which it is exposed (Fig. 15-1).1 Oxygen content is expressed as the volume of oxygen contained in 100 mL of blood, but may also be expressed as either volumes % or mL/dL. The standard oxygen dissociation curve (Fig. 15-1) demonstrates the effects of oxygen–hemoglobin interaction at standard pH (7.40), temperature (37ºC), and atmospheric pressure (760 mm Hg). The blue line at the bottom of the graph in Figure 15-1 shows the amount of oxygen dissolved in blood, and the red line shows the total amount of oxygen in blood at any given oxygen tension. Almost the entire quantity of oxygen transported in blood is bound to hemoglobin. However, the role of dissolved oxygen cannot be ignored. Oxygen diffuses across the alveolar–capillary membrane, enters the plasma, traverses the red cell membrane, and enters the erythrocyte interior—all while dissolved in aqueous solutions. It then combines with hemoglobin enabling the transport of large amounts of oxygen to the metabolizing tissues. Dissolved oxygen, although present in very low concentration in blood, is a critical component of the process of O2 exchange.
Figure 15-1 Oxygen dissociation curve. Relationship between oxygen content and pressure in normal human blood. The total oxygen content of blood as a function of the partial pressure of oxygen is indicated by the red line. The blue line indicates the content of dissolved oxygen resulting from changes in PO2. The partial pressure of oxygen (P50) necessary to saturate one-half of hemoglobin in blood is indicated in green.
Changes in the quaternary structure of hemoglobin that accompany oxygen binding result in a sigmoid, rather than hyperbolic, oxygen dissociation curve. The S-shaped dissociation curve is the result of changes in oxygen affinity of unbound heme groups following the binding of oxygen to another heme group in the same hemoglobin molecule. As illustrated in Figure 15-1, once the partial pressure of oxygen reaches 90 to 100 mm Hg, hemoglobin is almost completely saturated with bound oxygen. There is little additional oxygen binding even at higher oxygen tensions. The flatness of the curve in the arterial oxygen tension range is an advantage because reductions in arterial PO2 (as might be caused by lung disease) will still allow for a relatively normal arterial O2 content as long as arterial PO2 remains ≥60 mm Hg. The normal partial pressure of oxygen in mixed venous blood at rest is ∼40 mm Hg with an oxygen content of ∼75% of maximum oxygen capacity. Thus, at rest only one-quarter of the oxygen delivered to body tissues is extracted from blood. However, oxygen extraction varies widely in different tissues. In addition, oxygen utilization changes appreciably during states of increased metabolism. In the tissues, the steep slope of the oxygen dissociation curve between 20 and 60 mm Hg facilitates the release of large amounts of oxygen with relatively moderate decrease in oxygen tension. This permits maintenance of blood oxygen tensions that promote diffusion of oxygen from the capillary blood into metabolizing tissues.
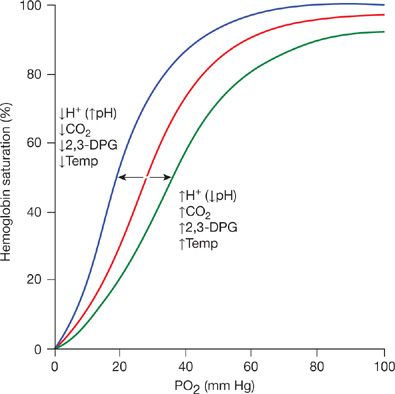
The maximum quantity of oxygen transported in blood is dependent upon hemoglobin concentration, which varies moderately in normal circumstances and substantially in disease states. To facilitate comparison of oxygen dissociation curves with different hemoglobin concentrations, the ordinate of the curve can be normalized by expressing oxygen content at any given pressure as a percentage of the maximum possible oxygen content. This approach substitutes % saturation of hemoglobin for oxygen content, as illustrated in Figure 15-2. Using this format, all normal oxygen dissociation curves are superimposable, regardless of differing hemoglobin concentrations.
Figure 15-2 Oxygen dissociation curve. The ordinate is % saturation, the percentage of the maximum possible oxygen content. The normal oxygen dissociation curve is shown in red. The blue curve is shifted to the left of the normal curve (increased oxygen affinity of hemoglobin) as a result of decreased blood hydrogen ion, decreased carbon dioxide, and 2,3-DPG concentrations or decreased temperature. The green curve is shifted to the right (decreased oxygen affinity) of the normal curve caused by increases of these factors.
 ALTERATIONS OF OXYGEN AFFINITY
The relationship between oxygen content and pressure can be affected by several factors. Increases in temperature, carbon dioxide pressure, hydrogen ions (decreased pH), and 2,3-diphosphoglycerate (2,3-DPG) all shift the oxygen dissociation curve to the right.1 This results in a decrease in the affinity of hemoglobin for oxygen, that is, a greater oxygen tension is required to bind the same amount of oxygen to hemoglobin (Fig. 15-2). Conversely, decreases in temperature, carbon dioxide tension, hydrogen ion (increased pH), and 2,3-DPG shift the curve to the left, that is, increase the affinity of hemoglobin for oxygen.1 The degree of shift of the oxygen dissociation curve is described by the P50, the partial pressure of oxygen required to achieve 50% oxygen saturation of hemoglobin. The normal P50 for human blood is 26.5 mm Hg (Fig. 15-1). The basic sigmoid nature of the relation between oxygen and hemoglobin does not change with alterations in the P50. Rather, the curve is uniformly either stretched or compressed along the PO2 axis.
The human erythrocyte contains large quantities of 2,3-DPG, an organic phosphate that binds to hemoglobin and affects O2 affinity. The normal concentration of 2,3-DPG in erythrocytes is approximately 5 mM. However, this concentration can change significantly, markedly altering the P50. There is a substantial change in the configuration of the hemoglobin molecule between the oxygenated and deoxygenated states. Oxygen and 2,3-DPG bind at different sites on the hemoglobin molecule, and binding of both molecules changes the overall configuration of hemoglobin, but in different ways. The β-chains are more widely separated in the deoxygenated state than in the oxygenated state, and have positive charges surrounding the central cavity of the hemoglobin tetramer. The widened gap between the β-chains of the deoxygenated molecule enables the highly negatively charged 2,3-DPG molecule to enter the cavity between the β-chains and bind electrostatically to positively charged amino acids of the hemoglobin molecule. This tends to stabilize the hemoglobin molecule in the deoxygenated configuration. Higher pressures of oxygen are thus required to force the change in molecular configuration to the oxygenated form, resulting in a shift of the dissociation curve to the right along the PO2 axis.
The Donnan effect results from the presence of charged macromolecules on one side of a semipermeable membrane failing to distribute
Stay updated, free articles. Join our Telegram channel

Full access? Get Clinical Tree


