Hemodynamic and Respiratory Monitoring in Acute Respiratory Failure
GENERAL PRINCIPLES
Critical illness associated with acute respiratory failure (ARF) results from direct and indirect injuries to the lungs. Patients are admitted to the intensive care unit (ICU) for organ support, principally mechanical ventilation, and invasive monitoring. It is widely believed, based on dramatic improvements in perioperative outcomes since the 1960s, that monitoring the critically ill patient, invasively and noninvasively, leads to clear therapeutic goals, detects early manifestations of disease, and reduces morbidity and mortality.
A number of important goals of ICU monitoring can be identified. One is to ensure adequacy of respiratory and circulatory function in patients who appear clinically stable. Another is to provide close surveillance for early signs of respiratory and circulatory instability, with the presumption that early detection improves outcome. In addition, measurement of the response to therapeutic interventions, including intravenous fluids and the application of supportive devices, such as endotracheal tubes (ETTs) and mechanical ventilators, are routinely performed in the ICU. Although life-saving, these devices, like all therapeutic interventions, are associated with risks that must be considered. Finally, monitoring respiratory and hemodynamic derangements over hours to days provides valuable insight about prognosis, since the trend in physiological derangements over time predicts outcomes far better than does the severity of abnormalities on admission. Consequently, failure to improve over days, despite full support and appropriate treatment, suggests the need for alternative therapeutic strategies, including patient comfort as the primary goal of care.
Physiological parameters normally vary in critically ill patients. The devices used to measure these parameters are often imprecise and, at times, inaccurate. Therefore, clinical assessment and decision making should not be based, in general, on single data points. Rather, trends in data collectively add reliability to interpretation of measurements. This chapter reviews methods currently available for monitoring hemodynamics and respiratory function in patients with ARF.
HEMODYNAMIC MONITORING
Discussed in the following sections are important aspects of hemodynamic monitoring, which in its many forms, is routinely utilized in critical care settings. Respiratory monitoring is considered later in the chapter.
 INDICATIONS FOR HEMODYNAMIC MONITORING
Hemodynamic monitoring is used to provide information that is not readily apparent from clinical examination, or when bedside monitoring is unreliable or equivocal.1 Such circumstances include: (1) for the patient with pulmonary edema, determining whether the edema is cardiogenic or noncardiogenic in origin; (2) assessing whether hypoperfusion is causing, or contributing to, the patient’s end-organ dysfunction; (3) deciding whether the patient with ARF who presents with or develops shock be given intravenous fluids, and, if so, how much; (4) deciding for those patients with volume overload, given the risk of causing or exacerbating organ dysfunction, how much fluid should be removed by using diuretics or dialysis to reduce lung water and improve respiratory function.
The first question requires an estimate of ventricular preload, the second an estimate of cardiac output adequacy, and the third and fourth assessment of the interrelationship of both preload and cardiac output. Regrettably, no monitor can provide consistently accurate answers to these questions. Monitors currently available are discussed in subsequent sections.
 BLOOD PRESSURE MONITORING
Considered subsequently are general principles of blood pressure monitoring, as well as various noninvasive and invasive techniques employed in the clinical setting.
General Principles
The mean arterial pressure (MAP) is always monitored with the goal of maintaining it at or above 60 to 65 mm Hg, as cardiac and cerebral organ perfusion may be compromised if it falls below this critical threshold. Exceptions include those patients with pre-existing hypertension, where the MAP goal should be raised proportionately to adjust for the compensatory shift upward in their autoregulatory curve. In contrast, if the baseline MAP is low, for example, as in some patients with end-stage liver disease, a lower goal may be tolerated safely. In early circulatory shock, however, perfusion to other, less vital organs falls well before any reduction in MAP. The importance of understanding, recognizing, and intervening during this early period cannot be underscored. Thus, although essential to monitor, MAP is too insensitive a parameter to use for the detection of circulation dysfunction.
In contrast, in circulatory shock, pulse pressure falls much earlier than MAP. Since pulse pressure changes in proportion to stroke volume (SV), as SV (and cardiac output) declines and compensatory tachycardia ensues, pulse pressure will fall. Consequently, if a patient with shock and tachycardia presents with a preserved or increased pulse pressure, this suggests distributive shock as the cause. Pulse pressure may also vary rhythmically with the phases of mechanical ventilation. This pulse pressure variability (PPV) results, in large part, from the effect of respiratory-associated pleural pressure changes on venous return and occurs exclusively in patients who are hypovolemic. Although only applicable in clinical conditions in which it was validated, this observation can help inform decisions about the value of additional fluid resuscitation, as discussed subsequently.
Noninvasive Blood Pressure Monitoring: Auscultatory Technique
Systolic and diastolic arterial pressures have been measured for over a century based on the auscultatory technique, using a sphygmomanometer, cuff, and stethoscope. The cuff is inflated above the anticipated systolic pressure and, as the cuff is gradually deflated, blood flow returns, generating a series of characteristic turbulent noises (Korotkoff sounds) that can be heard over the artery. The pressure at which the first Korotkoff sound is heard is generally accepted as systolic blood pressure (phase I). The sound character progressively changes (phases II and III), becomes muffled (phase IV), and is finally absent (phase V). Diastolic pressure is recorded at phase IV or V. Phase V may never occur in certain pathophysiological states, such as aortic regurgitation. It is used commonly for BP measurement while patients are managed in general care units.
Although widely used in clinical practice, the auscultation technique is inadequate for critical care. There are considerable interobserver differences based on subjective perception, rate of cuff release, and difficulty in hearing the sounds in shock states. In addition, some inexperienced caregivers have a tendency to “disbelieve” abnormal results, resulting in diagnostic delay. Peripheral edema may artificially inflate the blood pressure reading, as will a cuff that is too narrow for the patient; the width of the cuff should be 20% greater than arm diameter. If the cuff is too small, blood pressure will be overestimated. If the cuff is too loose, blood pressure will be underestimated. Finally, in patients with low output shock, the auscultatory method may underestimate intra-arterial measurements by up to 50 mm Hg.2
Noninvasive Blood Pressure Monitoring: Oscillometry
Oscillometers are automated, noninvasive blood pressure (NiBP) monitoring devices that are routinely used in operating rooms, recovery rooms, endoscopy suites, high-dependency wards, and ICUs. NiBP devices measure mean arterial pressure and use an algorithm to estimate the systolic and diastolic blood pressures. They offer significant advantages over auscultation in that they are time saving, reliable, reproducible, and have high- and low-pressure alarms built in.
The oscillometer is a single-cuffed device that occludes the artery and senses restoration of blood flow. The cuff is inflated above systolic pressure and then deflates either continuously, at a rate about 4 mm Hg per second, or in a stepwise manner. The sensor detects oscillation as blood flow returns. The pulse pressure wave and the gauge pressure in the occluding cuff are detected and converted into electronic signals by a transducer. The peak amplitude of pulsations corresponds to MAP. The systolic and diastolic components are calculated using proprietary algorithms. Systolic blood pressure is identified as the pressure at which pulsations are increasing and are at 25% to 50% of maximum. Diastolic blood pressure is the most difficult value to determine by oscillometry and is commonly recorded when the pulse amplitude has declined from the peak value by 80%.
Oscillometers are generally safe and reliable, but care must be taken with cuff location, size, and frequency of measurement. Many complications have been reported, including pain, petechiae, bruising, venous stasis, limb edema, thrombophlebitis, and peripheral neuropathy. The likelihood of these complications is proportional to the duration and frequency of cuff inflation; they result from extremity ischemia and local trauma. The events occur more often after prolonged periods of excessively frequent cuff inflation/deflation cycling.
Invasive Blood Pressure Monitoring Techniques
The insertion of an intra-arterial cannula provides the intensive care clinician with continuous, beat-to-beat blood pressure monitoring and arterial blood sampling for pH and blood gas analysis, as well as for the medley of blood tests that may be performed on the critically ill patient. It is widely believed that this form of continuous invasive blood pressure (IBP) monitoring is more reliable than noninvasive approaches and facilitates earlier diagnosis and resulting interventions.2,3
Arterial “lines” are constructed of an intra-arterial cannula, fluid-filled tubing, pressure transducer, and microprocessor with display. The pressure transducer is a low-compliance diaphragm that moves in response to pressure changes transmitted through fluid-filled tubing. This movement is converted to an electrical signal using a strain gauge. A pressure waveform is generated, and the mean arterial pressure is calculated by integrating the area under the waveform. The systolic and diastolic pressures are calculated using an algorithm.
Complications of arterial cannulation include infection, air embolism, bleeding, thrombosis, and infarction. The IBP monitor must be zeroed and leveled in the phlebostatic axis (at the level of the right atrium), regardless of the site of the arterial cannula. Inadequate or incorrect zeroing results in incorrect values and inappropriate therapies. The bedside clinician should always check the “zero” before initiating antihypertensive or vasopressor therapy.
Which is more accurate, NiBP or IBP? Mean arterial pressure measurement correlates well between the two techniques.4 Oscillometry generally underestimates intra-arterial systolic blood pressure,5,6 as opposed to diastolic blood pressure, which is overestimated, especially in hypertensive patients.7 IBP is vulnerable to damping. The presence of air bubbles, blood clot, or kinks in the tubing result in a damped signal. Damping decreases the rate of signal change, leading to low pulse pressure, with low systolic and high diastolic pressure readings. Nevertheless, damping will not impact the accuracy of the mean arterial pressure until it is extreme, and only then will it underestimate the true value. Damping is important to recognize, since interventions may be initiated on the basis of reductions in either systolic or pulse pressure; furthermore, pulse pressure is important for estimating cardiac output by several methods (as discussed subsequently). Routine nursing bedside assessments should enable early identification and troubleshooting, including the performance of the “flush test,” which measures the arterial pressure recording systems frequency response to a pulse change in pressure.
 INVASIVE CENTRAL VENOUS PRESSURE MONITORING
Measurement of central venous pressure (CVP) is a critically important component for monitoring many patients in critical care units. Its assessment, as well as parameters derived from venous blood samples obtained from central venous catheters (CVCs), is discussed in the following chapters.
Central Venous Pressure
CVCs are inserted for a variety of reasons, including for administration of vasopressors and hypertonic dextrose solutions (total parenteral nutrition), for long-term venous access, and for measurement of CVP and venous blood gases. CVP is the downstream pressure that governs the rate of venous return to the right heart; it represents a good approximation of mean right atrial (RA) pressure. CVP may be measured accurately through a variety of catheter types, including triple lumen, tunneled, and percutaneously placed catheters. Commonly employed CVP catheter sites include the internal jugular (IJ), subclavian, and femoral veins.
CVP has been used to assess volume status in the diagnosis and management of shock and to infer the etiology of pulmonary edema. There is no “normal” CVP, and small changes in its magnitude may accompany large changes in circulating blood volume.2 Although, in some cases, a very low (<5 mm Hg) or a very high (>20 mm Hg) CVP may be helpful in guiding decisions about circulating blood volume, in most patients, a single CVP value is rarely helpful.8 Numerous studies have failed to show that the CVP value has utility in predicting fluid responsiveness. Nevertheless, the CVP may help in categorizing the pathophysiology of shock and may be a useful parameter to guide protocol-driven resuscitation in an ICU staffed by inexperienced practitioners or trainees. In summary, although CVP has limited utility in volume status assessments, it remains a complementary assessment tool.
One of the most important problems confounding CVP interpretation, which is pertinent to all intravascular pressure measurements taken from within the thorax, is the impact of respiratory-induced intrapleural pressure changes on the interpretation of intravascular pressure. Intravascular pressure is measured relative to atmospheric pressure, providing a zero reference for the transducer. Unless the magnitude of the intrapleural pressure swings are considered, (i.e., referencing intravascular pressure to intrapleural, rather than atmospheric, pressure) intravascular pressures fluctuate despite constancy in the transmural pressure; if the impact of these intrapleural pressure swings are not considered, spurious readings will arise. Consequently, pressures are recorded at end expiration to minimize this potential error. End expiration is easy to determine in spontaneously breathing patients; in patients on mechanical ventilation who are actively breathing, recording and displaying intra-airway pressure and intravascular pressure simultaneously enables accurate timing.
Important clinical questions are whether the CVP or RA pressure is useful in estimating right and left ventricular preload or in determining if pulmonary edema is cardiogenic in origin. Preload is best defined as end-diastolic volume (EDV), which requires an estimate of both the transmural filling pressure (CVP–pericardial pressure) and ventricular compliance, neither of which can be determined reliably at the bedside. Even if CVP correlated with RVEDV, the latter correlates poorly with LVEDV in patients with ARF because of discordance in ventricular afterload and contractility. Indeed, lung disease and the positive end-expiratory pressure (PEEP) used to treat it increase pulmonary vascular resistance and may precipitate right ventricular failure. Furthermore, since the pericardium limits ventricular dilatation, ventricular interdependence further increases the disparity in LVEDV and RVEDV when differential contractility or loading conditions are present. This occurs because ventricular dilatation displaces the septum laterally and compresses the adjacent ventricle. Thus, the CVP is of little or no value in determining ventricular preload or in determining whether pulmonary edema is of cardiogenic or noncardiogenic origin.
The CVP waveform, however, may provide evidence to suggest the presence of specific cardiac or pericardial disorders (Fig. 147-1).
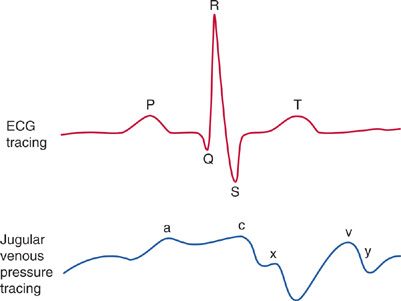
Figure 147-1 CVP waveforms: Since there are no valves between the vena cava and the right atrium, central venous pressure waveform reflects the events of cardiac contraction. Simultaneous display of the ECG allows one to identify and time the CVP waveform. a wave: Increased atrial pressure during right atrial contraction. It occurs following the P wave on an ECG. c wave: During early ventricular contraction the tricuspid valve bulges into the right atrium. It occurs at the end of the QRS segment on an ECG. x descent: Atrial relaxation. It occurs before the T wave on an EKG. v wave: Atrial filling—the right atrium progressively fills while the tricuspid valve is closed. It occurs at the end of the T wave on an EKG. y descent: Following opening of the tricuspid valve in diastole, the atrium empties as blood flows into the right ventricle. It occurs before the P wave on an EKG.
Characteristic findings on the CVP waveform may suggest certain cardiac disorders. For example, a prominent Y descent suggests myocardial restriction; pericardial constriction; or right ventricular ischemia, infarction, or overload. In contrast, the Y descent is greatly attenuated in cardiac tamponade. A large V wave suggests tricuspid regurgitation (TR), which is associated with RV failure. In atrial fibrillation, the A wave disappears. A tall A wave (so-called, “canon A wave”) may be seen in atrioventricular dissociation or a junctional rhythm, due to atrial contraction occurs against a closed tricuspid valve. In patients with diastolic dysfunction, these arrhythmias may cause sudden hypotension, and CVP waveform analysis may be diagnostic.
Mixed Venous Oxygen Saturation
Normally, the circulation delivers oxygen to the tissues at a rate sufficient to maintain an intracellular (mitochondrial) oxygen tension above a critical threshold. If oxygen delivery (DO2) fails to meet tissue oxygen requirements (![]() ), shock occurs and anaerobic metabolism ensues. If prolonged, cell death may occur.
), shock occurs and anaerobic metabolism ensues. If prolonged, cell death may occur.
If DO2 decreases and tissue ![]() remains constant, a reduction in the oxygen content is seen. This increase in oxygen extraction results from both an increased capillary transit time and increased gradient for oxygen diffusion, as mitochondrial and tissue PO2 fall. As most of the oxygen in venous blood is attached to hemoglobin, the mixed venous oxygen saturation (SVO2), as measured in the pulmonary artery, has traditionally been used as a surrogate for oxygen content.
remains constant, a reduction in the oxygen content is seen. This increase in oxygen extraction results from both an increased capillary transit time and increased gradient for oxygen diffusion, as mitochondrial and tissue PO2 fall. As most of the oxygen in venous blood is attached to hemoglobin, the mixed venous oxygen saturation (SVO2), as measured in the pulmonary artery, has traditionally been used as a surrogate for oxygen content.
Since blood flow and metabolic rate vary among organs, so does the venous oxygen content draining from different organs. However, when well mixed in the pulmonary artery, the SVO2 represents a weighted average of the product of blood flow and oxygen content from every organ and reflects the adequacy of “global” oxygen delivery. Thus, SVO2 is insensitive to localized tissue ischemia (e.g., bowel ischemia), reflecting an important limitation in its clinical use.
Based on an understanding of the determinants of SVO2, the clinician can use the Fick equation (Equation 1) to elucidate the mechanism of shock and to select the most appropriate therapy:
![]()
where CO is cardiac output. Recalling that O2 content of either arterial or venous blood is the sum of hemoglobin (Hgb)-bound oxygen (1.34 mL O2/g Hgb × [Hgb]/100 mL blood × % hemoglobin saturation) and dissolved oxygen (0.003 mL O2/mm Hg), the following expression (Equation 2) for mixed venous O2 is derived:
![]()
Thus, if SaO2 is stable, SVO2 will decrease if either CO or [Hgb] decreases or ![]() increases. Since SaO2 and [Hgb] are readily measured and changes in
increases. Since SaO2 and [Hgb] are readily measured and changes in ![]() can be grossly estimated, the cause of a decrease in SVO2 can usually be determined quickly. Compared with alternative methods of monitoring CO, SVO2 reflects the adequacy of CO relative to oxygen requirements. This is more valuable than the absolute CO, since reference values for CO or body surface area–normalized cardiac indices assume that
can be grossly estimated, the cause of a decrease in SVO2 can usually be determined quickly. Compared with alternative methods of monitoring CO, SVO2 reflects the adequacy of CO relative to oxygen requirements. This is more valuable than the absolute CO, since reference values for CO or body surface area–normalized cardiac indices assume that ![]() is normal, which is often not the case in critical illness.
is normal, which is often not the case in critical illness.
Since SVO2 is measured from the pulmonary artery, it requires placement of a pulmonary artery catheter (PAC), which is now rarely performed, because randomized control trials have failed to show a benefit on patient outcome. Consequently, since 2001 there has been considerable interest in using the venous oxygen saturation measured from the superior vena cava (SVC) (SCVO2) as a surrogate for SVO2.9 Since many critically ill patients already have a CVC in place for vasoactive medications, this measurement requires no additional procedures and, therefore, carries no additional risk. To minimize measurement errors, blood should be sampled from the proximal SVC or from within the right atrium via any CVC or device. Importantly, since many hospitalized patients not in critical care units have a CVC or long-term CV access port, SCVO2 may be used for both diagnostic and therapeutic purposes well before transfer to an ICU.10,11
Pulmonary Artery Occlusion (Capillary Wedge) Pressure
The PAC was first introduced into clinical practice in 1970. For many years, the PAC was used widely for hemodynamic measurements in the ICU, particularly in North America. However, more recently, usage has fallen dramatically with the lack of any evidence of meaningful benefit and known complications.12–14
The PAC is used to measure CVP and pulmonary artery occlusion or “wedge” pressure (PAOP) for the estimation of right and left ventricular filling pressures and to determine cardiac output. PAOP closely approximates the left ventricular end-diastolic pressure (LVEDP). If “a” and “v” waves are visible in the transduced pressure recording, the mean value of the “a” wave (halfway between the top of the “a” wave and the bottom of x descent) is used to indicate the PAOP. PAOP is also used to estimate pulmonary capillary pressure to determine whether pulmonary edema is due to increased capillary permeability or hydrostatic pressure. In contrast to when the PAOP is used to estimate LVEDP, the mean of the end-expiratory tracing is always used, even if large “v” waves are present, since the systolic pressure spike (‘v” wave) is transmitted with an equal contribution to the capillary hydrostatic pressure. If the PAOP never exceeds 18 mm Hg, hydrostatic pulmonary edema can be excluded; however, transient spikes in left atrial pressure that can cause pulmonary edema, may occur between normal PAOP measurements, and may be missed. A PAOP >18 mm Hg is consistent with a hydrostatic cause of pulmonary edema, but high-permeability edema cannot be excluded.
The correct interpretation of PAC-derived hemodynamic data remains a major challenge and may be an important reason for studies having failed to show a benefit on patient outcomes.15,16
Does the PAOP provide an estimate of LV preload? Regrettably, this is an equally tenuous proposition, fraught with all the same limitations of those discussed previously regarding CVP as a poor reflection of RV preload.8,17,18 But even if PAOP provided an accurate estimate of ventricular volume (preload), it should not be used to guide volume resuscitation. EDV does not correlate with fluid responsiveness, the important issue when resuscitating a patient. Fluid responsiveness can only be determined from dynamic indices, which are discussed subsequently. Nevertheless the measurement of pulmonary arterial pressure from the PAC is useful. Right ventricular dysfunction not uncommonly complicates acute respiratory distress syndrome (ARDS) and thromboembolic disease.19 The presence of high PA pressures should alert the clinician to these diagnoses. Pulmonary artery pressure is also important to follow when titrating pulmonary vasodilators, diuretics, hemofiltration, inotropes, or other therapies.
 CARDIAC OUTPUT MONITORING
Monitoring cardiac output in critically ill patients has been a central element in clinical management for decades. Underlying principles and techniques are discussed in the following paragraphs.
General Principles
Shock or frank hypotension commonly complicates critical illness and may result from absolute or relative hypovolemia, vasoplegia, or cardiac failure. The ability to measure cardiac output and titrate inotropes, vasopressors, and fluids remains a cornerstone of 21st-century critical care.
In critically ill patients, the history, physical examination, and laboratory testing can help to estimate absolute and relative changes in cardiac output and organ perfusion. In addition, SCVO2 monitoring has become a routine component of hemodynamic monitoring. Although more outcome studies are needed, these routine assessments often provide all the information necessary to categorize the nature of shock and assess the response to early resuscitative interventions. However, in the population of patients who fail to recover fully from shock, these assessments alone may not provide the information necessary for optimal patient management. For instance, additional decisions may need to be made on whether to proceed with more fluid challenges, deciding whether there has been a favorable response to a fluid challenge, or determining when to stop diuresis or ultrafiltration to avoid a reduction in cardiac output. These questions are best addressed by measuring the change in cardiac output in response to an intervention. From a practical standpoint then, accurate determination of trends in cardiac output is more important than absolute values.
Traditionally, thermodilution (TD) using a PAC has used to measure cardiac output. Due to the inherent issues with the use of PACs, a variety of less invasive SV/cardiac output monitors have been developed for this purpose.
Thermodilution and Indicator Dilution Techniques
Measurement of CO with a PAC using a TD-based technique is considered the gold standard to which other CO-measuring technologies are compared. CO can also be measured indirectly with the PAC using the Fick method, based on the principle that CO is equal to oxygen consumption (![]() ) divided by the difference in O2 content across the circulation (i.e., the arteriovenous O2 difference). Since
) divided by the difference in O2 content across the circulation (i.e., the arteriovenous O2 difference). Since ![]() is not usually measured directly and may vary considerably in critically ill patients, inaccuracies may result. Hence, in patients with ARF who have a PAC, CO should be measured using TD, unless significant TR is present. If the values obtained by TD are unexpected, then the Fick method should be used for corroboration.
is not usually measured directly and may vary considerably in critically ill patients, inaccuracies may result. Hence, in patients with ARF who have a PAC, CO should be measured using TD, unless significant TR is present. If the values obtained by TD are unexpected, then the Fick method should be used for corroboration.
Even if we accept that the CO measurement is accurate, more information is needed to make clinical decisions. Oxygen consumption varies significantly within and between patients with ARF. Since CO usually increases in proportion to ![]() and inversely with hemoglobin concentration and O2 saturation, there is no normal or range of normal values for CO in patients with ARF. Similarly, normalizing CO to body surface area for comparison to reference values is unhelpful. In managing a critically ill patient, the relevant questions are whether the measured CO is adequate for the patient’s needs, and if not, whether CO can be improved with intravenous fluids. Alternatively, for the volume-overloaded patient, an important question is how much fluid can be removed by diuresis or dialysis without reducing CO.
and inversely with hemoglobin concentration and O2 saturation, there is no normal or range of normal values for CO in patients with ARF. Similarly, normalizing CO to body surface area for comparison to reference values is unhelpful. In managing a critically ill patient, the relevant questions are whether the measured CO is adequate for the patient’s needs, and if not, whether CO can be improved with intravenous fluids. Alternatively, for the volume-overloaded patient, an important question is how much fluid can be removed by diuresis or dialysis without reducing CO.
Lithium Dilution Technique
Lithium, in low doses, is a nontoxic substance that is not metabolized. When injected, its concentration is easily measured using an ion-selective electrode. Lithium dilution cardiac output (LiDCO) is calculated from the area under the concentration–time curve when lithium is injected into a CVC and measured peripherally in arterial blood. Injection into the antecubital vein appears to be as accurate as injection through a CVC. LiDCO is also used to intermittently calibrate the PulseCO cardiac output monitor.
Dynamic Preload Indices and Pulse Contour Analysis
Positive intrathoracic pressure increases right ventricular (RV) afterload and reduces RV preload. On inspiration, RV stroke volume falls and LV stroke volume increases as a consequence of increased LV filling from enhanced pulmonary venous return, increased LV compliance because of decreased RV dimensions, decreased LV afterload, and external pressure on the LV. The subsequent LV stroke volume is lower, due to the reduction in RV stroke volume. Consequently, blood pressure falls slightly during inspiration and returns to normal during expiration. These cyclic variations are quite sensitive to volume status, such that when the patient is relatively hypovolemic and on the steep part of the Frank–Starling curve, SV and, hence, pulse pressure variation (PPV) are greater.20 Patients on the flat portion of the Frank–Starling curve are insensitive to these cyclic respiratory-related changes in preload.21
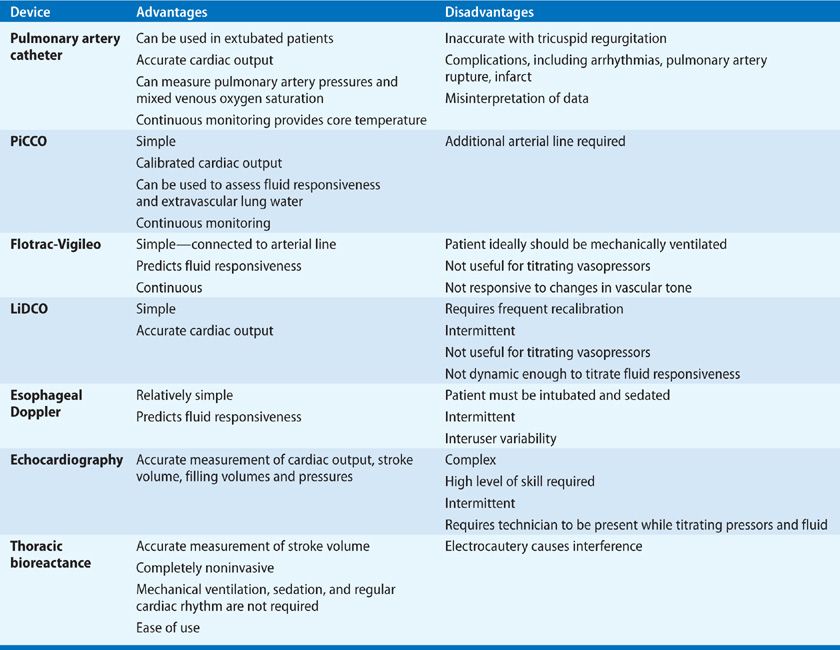
A PPV >13% appears to be a sensitive indicator of fluid responsiveness.22 PPV and stroke volume variability (SVV) have become the major focus of current generation cardiac output monitors (Table 147-1).23 However, these two measurements of fluid responsiveness are only valid under the ideal conditions in which they were validated. These include passive mechanical ventilation with a tidal volume of at least 8 mL/kg IBW, a regular cardiac rhythm, a closed chest, and no evidence of intra-abdominal hypertension or right ventricular failure. Unfortunately, these conditions are met in only a small proportion of patients in ICUs, given their reductions in tidal volume and use of sedation. Thus, for the majority of critically ill patients, alternative approaches to assess fluid responsiveness are required. Most commonly, this involves measuring the change in cardiac output in response to a fluid challenge (bolus) of 250 to 500 cc given rapidly (over 5–10 minutes).
If there is a concern about the safety of giving an additional fluid challenge, measuring the cardiac output response to a passive leg raise (PLR) maneuver should be used. Repositioning from the semirecumbent position (45 degrees) to supine, with the legs raised 45 degrees, provides a rapid endogenous shift of blood volume of approximately 300 cc, mirroring the effect on venous return produced by an exogenous fluid bolus. The technique has been validated under a variety of clinical conditions, albeit in small studies, including those that render other invalid functional hemodynamic assessments, that is, PPV, SVV, and IVC collapsibility.24 This technique is promising, but large validation and outcome studies are needed.
The Flotrac-Vigileo (F/V) device (Edwards Lifesciences, Irvine, CA) calculates SV and cardiac output, using proprietary algorithms, from a single sensor attached to an arterial line at any site. It does not require external calibration or the presence of a CVC or specialized catheter.
F/V combines rapid analysis in real time of the arterial pressure waveform with demographic data (e.g., gender, age, weight, and height) applied to a continuously evolving algorithm to calculate cardiac output. Arterial pulsatility is directly proportional to SV. As changes in vascular tone and compliance occur dynamically, the device appears capable of correcting the changes by analyzing skewness and kurtosis of the arterial waveform. These correction variables are updated every 60 seconds, and the arterial waveform is analyzed and averaged over 20 seconds, thus eliminating artifacts, jitter, and premature contractions. Cardiac output is calculated utilizing the arterial waveform and the heart rate. F/V also calculates accurately SVV and, hence, provides an assessment of fluid responsiveness.25
An increasing number of studies and a meta-analysis26 on performance of this system have been published. While early studies demonstrated poor correlation between F/V and TD methods, with application of newer software the correlation has improved.27 Of note, although TD methods are considered the gold standard for CO measurement, comparison with the F/V device is not ideal, since measurement intervals and averaging times are substantially longer with all TD methods. Hence, F/V may be more sensitive to dynamic changes in cardiovascular function. Obviously, F/V requires an uninterrupted arterial waveform. Thus, in the presence of arterial obstruction, for example, aortic valve disease, aortic coarctation, or use of balloon counterpulsation, the data will be inaccurate and misleading. Care should also be taken in scenarios in which patients are being rewarmed from induced hypothermia (e.g., after cardiac surgery or cardiac arrest) or when intracardiac shunts are present.
Data to date have suggested that F/V is quite accurate at measuring changes in cardiac output associated with volume expansion (i.e., in which there is preload sensitivity),28 but not changes associated with vasopressor use.29–31 Accuracy is also likely dependent on the patient having a regular cardiac rhythm and a consistent tidal volume.25,32
Pulse Contour Cardiac Output
Systolic ejection results in distension of the arterial tree; if the distension pressure is transduced by an arterial line, a characteristic waveform is observed. This waveform reflects the SV and elastic properties of the arterial wall. The shape of the pulse waveform and the area under the curve (AUC) is proportional to the cardiac output. Measurement of the AOC and pulse contour provides clinicians with a bedside cardiac output. However, arterial compliance is not constant or consistent; there is tremendous inter- and intrapatient variability. Since compliance is mathematically defined as the change in volume divided by the change in pressure, external calibration of the pressure signal with an alternative cardiac output technique is required. Pulse contour devices, for example, Pulse CO, LiDCO (LiDCO plus, LiDCO LTD, Cambridge, UK), and PiCCO (Pulsion, Germany), combine pulse contour analysis to calculate SV, and indicator dilution or TD cardiac output measurements to calibrate the system.
In addition to calculating cardiac output, devices that analyze pulse waveforms also analyze and display PPV that can be used for dynamic preload assessment and fluid responsiveness in mechanically ventilated patients.
PiCCO-plus (Pulsion Medical, Munich, Germany) calculates cardiac output continuously from pulse contour analysis of the aortic waveform via an arterial cannula. The cannula can be placed in the femoral (preferably), brachial, or axillary arteries. The system requires the concurrent placement of a CVC, which is required to perform transpulmonary TD cardiac output measurements, and a thermistor in the arterial catheter to calibrate the system. The major advantage of the system over a PAC is that there is no requirement to cannulate the right heart. Conversely, two separate lines are required, and often this involves the placement of a second arterial line.
The PiCCO device measures the area under the aortic waveform; the systolic area is identified as that part of the waveform proximal to the dicrotic notch, which is proportional to the SV. Although beat-to-beat volumes are measured, they are averaged over 30 seconds to avoid inaccuracy associated with anomalous waveforms, interference, and extrasystoles. The continued accuracy of PiCCO depends on the frequency of calibration using TD. The manufacturer recommends recalibration every 8 hours, but this interval may be insufficient in unstable patients.33
In the PiCCO system the temperature differential detected using the arterial thermistor is composed of a series of exponential decay curves as the cold injectate passes through the various compartments of the circulatory system. Unlike the PAC, the receiver is located at a significant distance from the injector. Consequently, a series of exponential decay curves is constructed as the injectate passes along the circulation. Since the injectate is administered centrally and the temperature difference is measured in a proximal artery, the majority of the temperature change occurs in the intrathoracic compartment. As a consequence, it is possible to measure intrathoracic blood volume and extravascular lung water. This provides an advantage of the PiCCO device over the PAC, as the volume of extravascular lung water in patients with ARDS predicts adverse outcomes.34 Finally, the device also purports to measure global EDV, permitting the construction of Frank–Starling curves and volume titration. To date, the PiCCO system appears to correlate very well with TD techniques.35–38
Pulse CO LiDCO (LiDCO plus) combines pulse contour analysis with lithium dilution calibration. The major advantage of LiDCO plus is that no specialized central or arterial catheter is required. The major disadvantage of LiDCO plus is the requirement for lithium injection for the calibration of CO at least every 8 hours. Of note, in patients that are hyponatremic or have recently received neuromuscular blocking agents, the calibration may be inaccurate. As with all of these devices, data are unreliable in the setting of aortic valve disease or balloon counterpulsation therapy. Furthermore, as noted previously, other requirements must be met to mimic the conditions used for validation of the technique.
Esophageal Doppler
While application of esophageal Doppler technology has been widely used in perioperative medicine, it has made little inroads into ICUs.
Given the proximity of the thoracic aorta and esophagus, insertion of an esophageal probe using Doppler ultrasound permits measurement of aortic blood flow parameters that, when entered into an algorithm, allow derivation of SV and cardiac output. There are significant limitations with this technique, particularly in nonoperative venues. Patients must be sedated deeply to tolerate probe positioning, and there is a steep user learning curve and significant interobserver variability. In addition, the technique is contraindicated in the presence of esophageal disease, and it does not provide continuous monitoring, since the probe needs to be refocused for each measurement. Nonetheless, substantial data have been published to support use of the device in the perioperative setting as a component of goal-directed therapy.39 In the appropriate setting, device insertion is rapid and data can be derived that are clinically useful within seconds.
Other Devices
Noninvasive cardiac output (NiCO, Novametrix, Connecticut, USA), a device that uses partial rebreathing of CO2 to derive cardiac output using the Fick principle in mechanically ventilated patients, provides data on both respiratory mechanics and cardiac output. However, the device has not found widespread use in intensive care.
Pulse dye densitometry (Nihon, Kohden, Japan) is a technique that uses transpulmonary dye dilution and transcutaneous signal detection to measure cardiac output. The dye is injected intravenously and, although the system is relatively noninvasive, data to date are limited; the approach cannot be currently recommended.
Thoracic electrical bioimpedance is a noninvasive technique that relies on the electrical conductivity of the chest to measure cardiac output. Each cardiac contraction causes a change in transthoracic impedance that is in direct proportion to the additional volume of blood ejected (SV) and its velocity.40 By placing multiple current-transmitting and voltage-sensing electrodes on the chest, SV can be calculated based on dynamic changes in chest impedance from baseline. The technique has not been shown to be sufficiently accurate in patients in an ICU, in large part due to electrical interference from other equipment and body motion. Inaccuracy also results from variations in electrode placement and conductivity, operator performance, patient body habitus, and variability in electrode conductivity of skin among patients.41
Bioreactance, using the NICOM device (Cheetah Medical, Portland, OR), is a related methodology that has overcome many of the limitations of bioimpedance by processing the data differently. This technique measures the phase shift in voltage across the thorax. The methodology has several advantages over the others, including its noninvasive basis, lack of need for sedation or mechanical ventilation, and applicability in the setting of cardiac arrhythmias; hence, the technique is a promising one for the ICU. Studies performed in the OR, ICU, and ED have shown the technique to be accurate for measuring cardiac output and volume responsiveness, although it cannot be used in the OR while doing electrocautery.42 Confirmatory studies, as well as outcome studies, are needed.
Echocardiography in the ICU Echocardiography in critically ill patients expands the capabilities of intensivists to more accurately and rapidly diagnose hemodynamic instability. Although expertise in echocardiography requires significant training, commitment, and experience, even basic knowledge may provide life-saving bedside diagnoses in certain conditions, such as profound hypovolemia, systolic heart failure, right heart syndromes, or pericardial tamponade.43
Echocardiography plays a key role in the assessment of left and right ventricular function, chamber size, and valvular dysfunction. It may be helpful in preload assessment when intravascular volume determination is difficult. Echocardiography may also be helpful in distinguishing intracardiac from intrapulmonary shunt and for diagnosing cardiac tamponade and aortic dissection.
Transthoracic Versus Transesophageal Echocardiography For the majority of critically ill patients who are hemodynamically unstable, transthoracic echocardiography (TTE) is safe, reliable, and rapidly available.44 Image quality, due to poor or limited acoustic windows, may be an issue, but new technology, harmonic imaging, and new echo-contrast products, have significantly improved echo signal acquisition.45 Transesophageal echocardiography (TEE) is used when views on TTE are inadequate or when clear views of the left atrium and aorta are required—such as evaluation for intra-atrial thrombus (prior to cardioversion), aortic dissection, or evaluation of prosthetic valves for evidence of endocarditis. TEE is relatively easy to perform in the ICU, as patients are usually intubated and often sedated.46 The presence of esophageal varices, recent esophageal or gastric surgery, or an unstable cervical spine are contraindications to TEE.
Uses of Echocardiography in the ICU Application of echocardiography to the ICU setting encompasses a broad array of clinical issues, the most important of which are highlighted below.
Assessment of Ventricular Function Left ventricle (LV) dysfunction in critically ill patients is common and may be caused by ischemia, sepsis, or hyperadrenergic states (i.e., “neurogenic shock”). When the LV becomes dysfunctional, its diameter progressively increases, as does the diastolic volume-to-stroke volume ratio. As the volume of end-diastolic blood that is ejected per cycle is reduced, the “ejection fraction (EF),” expressed as a percentage, falls. EF can be reliably measured by echocardiography. MAP may appear normal despite a severe reduction in ventricular function, which may be impaired further by the use of vasopressors used to restore MAP in septic shock. The size of the ventricle is measured using either M-mode or two-dimensional (2D) techniques. Echocardiography provides an accurate description of global ventricular function and may reveal regional wall motion abnormalities, which are usually associated with myocardial ischemia.
Right ventricle (RV) dysfunction is also very common in critically ill patients. Pulmonary embolism (PE) and ARDS are main causes47; however, excessive mean airway pressure, fat embolism, and elevated pulmonary vascular resistance also cause increase RV afterload and RV strain. In patients presenting in shock, identifying this pathophysiology early is very important. Unlike other shock states in which excessive volume resuscitation may result in volume overload and pulmonary edema, neither of which may be life-threatening, inappropriate fluid administration in right heart failure may worsen shock and potentially lead to cardiovascular collapse. This relates directly to ventricular interdependence, wherein RV distension causes a bowing of the interventricular septum into the LV, resulting in LV systolic and diastolic dysfunction. Additional fluid boluses only exacerbate the condition; expeditious volume removal can be life-saving. These pathophysiological circumstances are relatively easy to diagnose with echocardiography and very difficult to diagnose using hemodynamic monitors. The integral parts of complete evaluation of the RV include 2D-echocardiography evaluation of RV size, shape, kinetics of the septum and RV free wall, along with assessment of severity of TR by color Doppler.
RV size is generally compared to LV size. In the four-chamber view, the ratio of RV to LV end-diastolic area is measured. A diastolic ventricular ratio >0.6 suggests moderate dilation and a ratio >1.0 severe dilatation.48
Evaluation of Refractory Hypoxemia and Right-to-Left Shunt Commonly seen are patients with hypoxemia despite a clear CXR, or who have pulmonary edema who fail to respond to increasing FIO2 or increases in airway pressure, raising the possibility of a right-to-left shunt. Notably, the incidence of patent foramen ovale is about 30%.
In the setting of right ventricle dysfunction, RA pressure may exceed left atrial pressure, leading to opening of the foramen ovale and significant intracardiac shunt. This can be detected by intravenous injection of agitated saline as a contrast medium during echocardiography. After the injection through a peripheral or central vein, the appearance of microbubbles in the left atrium within three cardiac cycles is diagnostic of a right-to-left shunt. If microbubbles appear in the left atrium after six cardiac cycles, an intrapulmonary right-to-left shunt is suggested, for example, pulmonary AVM or hepatopulmonary syndrome.
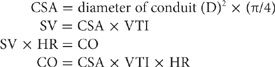
Assessment of Cardiac Output (CO) Echocardiography may provide a relatively reliable measure of SV and, hence, CO.49 The most common technique for measuring CO using echocardiography is Doppler-derived instantaneous blood flow measurement through a conduit (LV outflow tract or pulmonic or mitral valve). SV is equal to the product of cross-sectional area (CSA) of the conduit, determined by 2D echo, and the integral of instantaneous blood flow or velocity–time integral (VTI) through the conduit:
Evaluation of Volume Status Echocardiography may be helpful in estimating volume status or fluid responsiveness. If there is inadequate preload, the left ventricle may appear to collapse during systole (“obliteration”). Echo may also help demonstrate whether inadequate LV filling results from RV dysfunction. Conversely, the finding of acute or chronic ventricular dilatation, defined by LV end-diastolic diameter, does not rule out volume responsiveness.50 Thus, there are two other echocardiographic techniques that have been used to evaluate fluid responsiveness in mechanically ventilated patients: The collapsibility index of the SVC, and respiratory variation in inferior vena cava diameter (i.e., the distensibility index).51–53 Measurement of IVC diameter can be challenging in obese patients, and its utility is limited in the setting of intra-abdominal hypertension. Accurate SVC measurements require a TEE. In addition neither measurement can be performed continuously.
RESPIRATORY MONITORING
A variety of methods may be employed in monitoring ventilatory and gas exchange functions of the lung, respiratory mechanics, and respiratory muscle strength. Each is described below.
 METHODS FOR MONITORING RESPIRATORY FUNCTION
A number of respiratory parameters are routinely monitored in patients with ARF and are discussed subsequently.
Oxygenation
In the ICU, oxygenation is generally monitored using pulse oximetry, arterial blood gas analysis, and, occasionally, transcutaneous methods.
Pulse Oximetry Pulse oximeters are universally deployed in the monitoring of perioperative and critically ill patients. Unique as monitoring devices, they provide useful data regarding oxyhemoglobin saturation (SpO2), heart rate, pulse volume, and tissue perfusion.
Pulse oximeters use the spectrophotometric characteristics of pulsatile arterial blood to determine oxygen saturation and heart rate. Oxygenated blood absorbs light at 660 nm (red light), while deoxygenated blood absorbs light preferentially at 940 nm (infrared light). The oximeter consists of two light-emitting diodes (wavelengths, 600 nm and 940 nm) and two light-collecting sensors that measure the amount of red and infrared light emerging from tissues traversed by the light rays. The relative light absorption by oxyhemoglobin and deoxyhemoglobin is analyzed by the device and an oxygen saturation is calculated. The sensing function of the device is directed at pulsatile arterial blood, while local “noise” arising from the tissues is ignored. The result is a continuous qualitative measurement of oxyhemoglobin saturation.
The use of pulse oximetry has not been shown to improve clinical outcomes, but epidemiological data have demonstrated a significant reduction in anesthesia-related morbidity. Although the technique accurately predicts arterial oxygen tension, the relationship between PaO2 and SpO2 is nonlinear, as dictated by the oxyhemoglobin dissociation curve. Accuracy falls off substantially at low-oxygen tensions, and saturation readings of less than 80% cannot be used reliably to guide oxygen therapy.
A new generation of rapid oximeters has promised more accurate breath-to-breath analysis of oxygenation and the potential for using the pulse waveform to measure PPV. To date, no positive outcome data have been published.54
The use of pulse oximeters is limited by a number of factors. The devices are designed to measure levels of oxygenated and deoxygenated hemoglobin, but no provision is made for measurement error in the presence of dyshemoglobinemias, including carboxyhemoglobinemia and methemoglobinemia. Since carboxyhemoglobin absorbs red light, conventional oximeters cannot distinguish oxy- from carboxyhemoglobin. In clinical situations in which carbon monoxide poisoning is suspected, co-oximetry is essential. Co-oximeters measure reduced hemoglobin, oxyhemoglobin, carboxyhemoglobin, and methemoglobin.
An additional source of error in using oximeters is abnormal patient movement (e.g., due to agitation). Low blood flow, hypotension, vasoconstriction, or hypothermia reduce pulsatility of capillary blood, resulting in underreading or no reading of oxygen saturation. Conversely, increased venous pulsation, such as occurs with TR, may result in an erroneously low reading by the device. Finally, oximetry-determined saturation is inaccurate on the steep part of the oxyhemoglobin dissociation curve. While the trend between directly measured arterial saturation and SpO2 appears accurate, the correlation between the two is not; a drop in SpO2 below 90% must be considered a potentially significant clinical event.
Arterial Blood Gases Blood gas analyzers have been available for 45 years and provide accurate measurement of PaO2, PaCO2, and pH. From these primary determinations, a number of parameters are calculated, including serum bicarbonate, base deficit or base excess, and oxyhemoglobin saturation.
Through application of the alveolar gas equation (see Chapters 14 and 33), arterial blood-gas analysis is used commonly in calculating the alveolar–arterial oxygen gradient, a number that reflects the severity of ventilation–perfusion abnormalities. A significant limitation of the alveolar–arterial oxygen gradient is that it varies directly with FIO2; consequently, changes in the value may not reflect changes in the underlying disease process. An alternative calculation – the ratio of PaO2 to FIO2, (“PF ratio”), which does not vary with FIO2 – has been used as a measure permitting comparisons of gas exchange at differing levels of FIO2.
The PF ratio has been incorporated into consensus definitions of ARDS. A PF ratio ≤200 defines ARDS.55 Neither the alveolar–arterial oxygen gradient nor the PF ratio takes into account differences in mean airway pressure. Although comparisons using the PF ratio would be more accurate if arterial blood was sampled uniformly at end expiration and in the absence of PEEP, clinical constraints may preclude such sampling conditions.
Ventilation
Clinical assessment of CO2 metabolism is usually considered with regard to the amount of gas that is dissolved in plasma (PaCO2), the amount present in the exhaled tidal volume, and the total extracellular content (total CO2 or bicarbonate concentration). In the setting of respiratory failure, these measurements provide information on adequacy of ventilation, percentage of physiological dead space, acid–base balance, and nutritional status.
In progressive chronic respiratory failure, as the ability to eliminate CO2 declines, total body CO2 stores (bicarbonate) increase. The ratio of total CO2 to bicarbonate concentration provides an indication of the acuity of the respiratory failure (Table 147-2).


