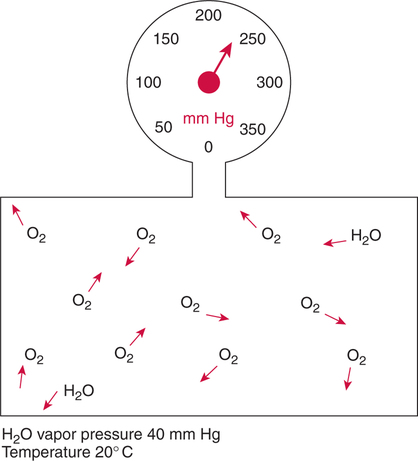
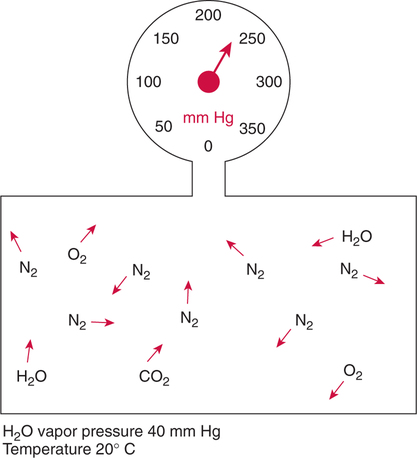
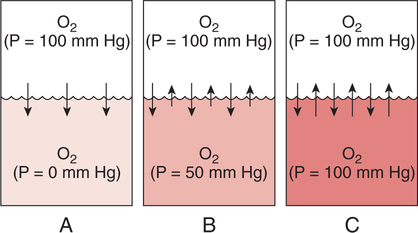
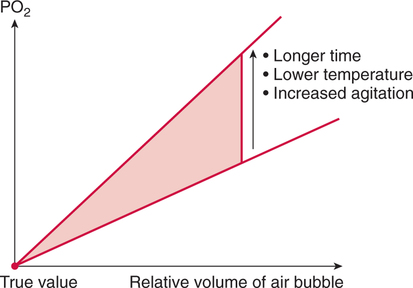
Improper sampling technique or blood specimen handling may introduce marked error into the blood gas measurements.10 72 Blood gas values are not particularly stable, and they may undergo significant alteration by apparently minor sampling flaws. The incidence of sampling error increases when inexperienced clinicians are responsible for obtaining the blood.72 73 Given the vital nature of decisions depending on blood gas values, proper education with regard to potential sampling errors is essential. Blood gas sampling technique must be given careful attention. It is important to understand the distinction between partial pressure of a gas and fractional concentration of a gas. Fractional concentration of a gas in a dry gas phase (F) is the percentage of total gas molecules occupiedby a particular gas excluding water vapor molecules. Fractional concentration is expressedas a decimal; for example, 21% O2 is equivalent to an FO2 of 0.21. In a container filled with only O2 and water vapor, the fractional concentration of O2 is 100% (FO2 = 1.0), which is shown in Figure 3-1. The true concentration of O2 would be less than 100% because some molecules in the container are H2O rather than O2; nevertheless, the percentage of O2 in the dry gas phase (i.e., excluding PH2O) is 100%. The partial pressure of oxygen (PO2) in Figure 3-1 could be determined by the application of Dalton’s law; the sum of the partial pressures equals the total pressure. Because there are only two gases in the container, the sum of their partial pressures must be equal to 240 mm Hg. Because PH2O is given as 40 mm Hg, the balance of pressure must be due to O2. Thus, in this example, the PO2 is 200 mm Hg. The formula used to calculate the partial pressure of a gas is (see Fig. 3-1): A similar container with an identical PH2O and the same total pressure is shown in Figure 3-2. However, only two of the ten non–water molecules in this mixture of gases are O2molecules. Thus, the fractional concentration of oxygen (FO2) in this mixture is 0.2 (20% O2). The partial pressure of O2 in this mixture of gases can be calculated by: The major gases present in dry atmospheric air with their respective partial pressures and percentages are shown in Table 3-1. It can be seen that the normal FIO2 while breathing room air is 0.21 and that the normal PIO2is approximately 158 mm Hg. Partial pressures shown are based on a total atmospheric pressure of 760 mm Hg present at sea level. For simplicity, Table 3-1 shows no water vapor pressure in the atmospheric air. In reality, the air that we breathe contains some water vapor pressure, and the normal partial pressure of inspired oxygen in humidified air is only approximately 148 mm Hg. Table 3-1 Composition of Air at Sea Level From Ziment, I.: Respiratory Pharmacology and Therapeutics. Philadelphia, W. B. Saunders, 1978. The partial pressures and percentages of these gases in alveolar air are also shown in Table 3-1. Two major processes are responsible for changing the quality of the air in the alveoli compared with inspired air: humidification and external respiration. A relative humidity of 100% means thatthe air is holding the maximum amount of molecular water possible at that temperature (i.e., actual humidity = potential humidity). Air with a relative humidity of 100% is saturated. Table 3-2 shows the water vapor pressures that would be present in air that is saturated at various temperatures. The fact that warm air can hold more moisture than cold air is readily apparent. Table 3-2 Effect of Temperature on Water Vapor Pressure (100% Relative Humidity) From Guyton, A. C.: Textbook of Medical Physiology, 9th ed. Philadelphia, W. B. Saunders, 1996. Air that is completely saturated at body temperature (i.e., 37°C) has a PH2O of 47 mm Hg. Fully saturated room air (i.e., 20°C), on the other hand, has a PH2O of only 17 mm Hg. Obviously, if gas is not fully saturated at a particular temperature, water vapor pressure is less than that shown in Table 3-2. Air is heated to body temperature (37°C) and is completely humidified (100% RH) as it travels through the upper airway on its way to the lungs. Therefore, it is safe to assume that PH2O in the alveoli is approximately 47 mm Hg. Thus, alveolar air has a higher water vapor pressure than atmospheric air. The total pressure in the alveolus is the same as atmospheric pressure. Thus, the partial pressures of other gases must decrease as a result of the increased PH2O. External respiration is the exchange of O2and CO2 between the alveoli and the blood. Oxygen, of course, diffuses from the alveoli into the blood, whereas CO2 is diffusing from the blood into the alveoli. Therefore, it is not surprising that alveolar PO2 is lower than atmospheric PO2 because of the loss of O2 from the alveolus to the blood. Likewise, one would expect that alveolar PCO2 would be higher than atmospheric PCO2 owing to the influx of CO2 into the alveolus. Table 3-1 simply confirms this exchange. Gay-Lussac’s law states that if volume and mass remain fixed, the pressure exerted by a gas varies directly with the absolute temperature of the gas.74 Absolute temperature is measured in Kelvin degrees and 0°Celsius is equivalent to 273°Kelvin (K). The total pressure in Figure 3-2 is 240 mm Hg, and the gas is at a temperature of 20°C (293°K). If the temperature ofthe gas increased to 38°C (311°K), which is shown in Figure 3-3, Brownian movement and kinetic energy of the gas would increase and the total pressure within the container would increase. As show in Figure 3-3, the new pressure is 255 mm Hg. Similarly, the partial pressures of other gases within the container also increase. Partial pressure must be distinguished from fractional concentration, which would not change. The partial pressure of O2 in Figure 3-3 can becalculated as described earlier: Henry’s law states that when a gas is exposed to a liquid, the partial pressure of the gas in the liquid phase equilibrates with the partial pressure of the gas in the gaseous phase. Thus, if O2 in the air is exposed to blood or water, thereis an exchange of O2 molecules between theliquid and gaseous phases until the respective partial pressures are equal. The progressive equilibration of the partial pressure of O2 between the gaseous and the liquid phases is shown in Figure 3-4. The barometric pressure is lower as altitude increases. Air at a high altitude still has a 21% O2 concentration; however, the partial pressure of O2 is much lower. The effect of high altitude on barometric pressure and PO2 is shown in Table 3-3. Table 3-3 Effects of High Altitude on Barometric Pressure PO2 From Guyton, A. C.: Basic Human Physiology, Normal Function and Mechanisms of Disease, 2nd ed. Philadelphia, W. B. Saunders, 1977. At the summit of Mount Everest, whichhas the highest altitude on earth, the PO2 is approximately 42 mm Hg.75 Again, the FIO2 remains at 0.21 but the PO2 decreases tremendously. Thus, the normal PaO2 at a high altitude (e.g., Denver) is obviously much lower than the normal PaO2 at sea level. Five common types of arterial blood sampling error are discussed: air in the blood sample, inadvertent venous sampling or admixture, anticoagulant effects, changes due to metabolism, and alterations in temperature (Box 3-1). The significance of each type of error and also the mechanism of these changes are explored. Clinical studies have shown that the major effect of an air bubble in a blood gas sample is a change in PaO2.76 77 78 79 According to Henry’s law, when a blood specimen with a PaO2 of less than 158 mm Hg is interfaced with an air bubble, the PaO2 of the blood sample spuriously increases. This action occurs because the partial pressure of O2 in the air at sea level is approximately 158 mm Hg. The magnitude of the increase depends partly on the duration of exposure, whereas the volume of the air bubble, although important, seems to make less difference.77 Other factors that may determine the ultimate effect of aircontamination include the temperature of the sample and the degree of agitation (Fig. 3-5). Furthermore, the change is greatest when the patient’s actual PaO2 exceeds 100 mm Hg.79 This change can be explained by the chemical relationship between O2 and hemoglobin that is discussed in Chapter 7 under the oxyhemoglobin dissociation curve. In certain clinical situations (e.g., in the operating room where high concentrations of inspired O2 are often used), the initial PaO2 of the blood sample may exceed 158 mm Hg. In this event, O2 tends to migrate from the blood phase to the bubble and results in measurement of an erroneously low PaO2 in the blood sample being analyzed.76 As shown in Table 3-1, the PCO2 inroom air is essentially zero. Thus, one would expect blood PCO2 levels to decrease if blood were exposed to an air bubble. This effectdoes occur, but is less marked than the change in PO2. The different blood solubility coefficients of O2 and CO2 probably explain thedisparity in response. Finally, the pH increases when arterial blood is exposed to an airbubble as a direct consequence of the decrease in PaCO2. Mixing or agitating a sample contaminated with an air bubble tends to escalate the error (see Fig. 3-5). Also, because the duration of exposure to an air bubble is a factor in the degree of error, all air bubbles should be expelled immediately. Results are reasonably stable when blood samples are not prematurely mixed and when foreign air bubbles are expelled within 2 minutes.77 The presence of air in an arterial blood gas sample is unacceptable and may introduce notable error. The PaO2 tends to migrate toward158 mm Hg; PaCO2 tends to fall, and pH may increase if the decrease in PCO2 is substantial. The most important change is the alteration in PaO2, which is particularly marked when initial PaO2 is greater than 100 mm Hg. This can be explained by the oxyhemoglobin dissociation curve, which is explained in Chapter 7. New blood gas syringes have been designed which have special vent mechanisms. These vents allow the syringe to be filled to a pre-selected volume while air is pushed out and the vent is closed.1 Use of these syringes precludes air contamination of the sample.
Blood Gas Sampling Errors
INTRODUCTION
BASIC PHYSICS OF GASES
Molecular Behavior
Fractional Concentration
Partial Pressure
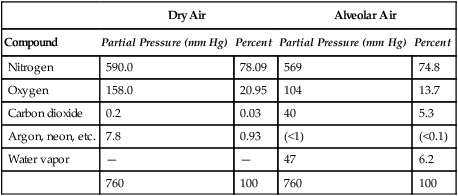
Composition of Atmosphericand Alveolar Air
Dry Air
Alveolar Air
Compound
Partial Pressure (mm Hg)
Percent
Partial Pressure (mm Hg)
Percent
Nitrogen
590.0
78.09
569
74.8
Oxygen
158.0
20.95
104
13.7
Carbon dioxide
0.2
0.03
40
5.3
Argon, neon, etc.
7.8
0.93
(<1)
(<0.1)
Water vapor
—
—
47
6.2
760
100
760
100
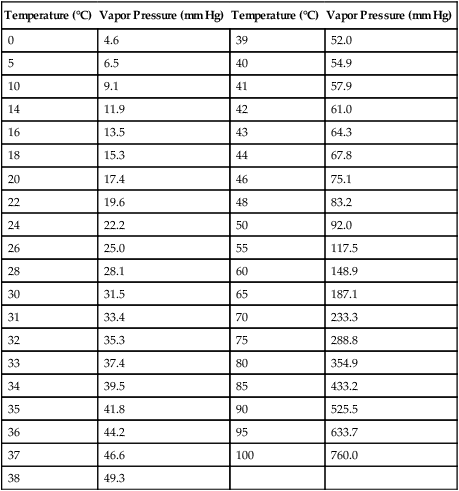
Humidification
Temperature (°C)
Vapor Pressure (mm Hg)
Temperature (°C)
Vapor Pressure (mm Hg)
0
4.6
39
52.0
5
6.5
40
54.9
10
9.1
41
57.9
14
11.9
42
61.0
16
13.5
43
64.3
18
15.3
44
67.8
20
17.4
46
75.1
22
19.6
48
83.2
24
22.2
50
92.0
26
25.0
55
117.5
28
28.1
60
148.9
30
31.5
65
187.1
31
33.4
70
233.3
32
35.3
75
288.8
33
37.4
80
354.9
34
39.5
85
433.2
35
41.8
90
525.5
36
44.2
95
633.7
37
46.6
100
760.0
38
49.3
External Respiration
Temperature, Pressure, and Volume
Gases in Liquids
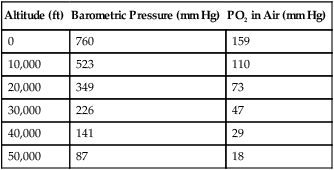
Change in Altitude
Altitude (ft)
Barometric Pressure (mm Hg)
PO2 in Air (mm Hg)
0
760
159
10,000
523
110
20,000
349
73
30,000
226
47
40,000
141
29
50,000
87
18
POTENTIAL SAMPLING ERRORS
Air in the Blood Sample
Effects of Air Contamination
Clinical Guidelines
Summary
![]()
Stay updated, free articles. Join our Telegram channel

Full access? Get Clinical Tree


Blood Gas Sampling Errors
(total pressure − water vapor pressure) ×the fractional concentration of that gas.
(total pressure − water vapor pressure) × 0.2.
 O2 designates the average PO2 in theveins. P
 O2 can be measured in the pul-monary artery. In this blood vessel, all venous blood that has returned to the heart from throughout the body has been thoroughly mixed.
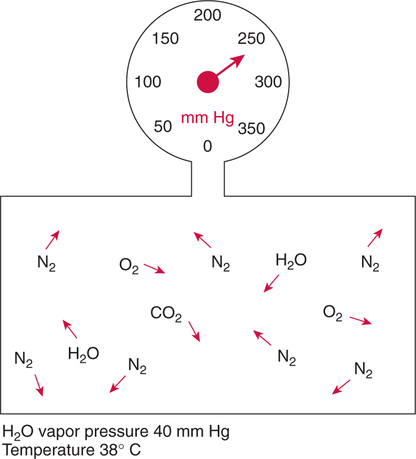
PO2 = (total pressure − PH2O) × fractional concentration
PO2 = (255 mm Hg − 40 mm Hg) × 0.2
PO2 = 43 mm Hg
Only gold members can continue reading. Log In or Register to continue
