Chapter 10 Basic Electrocardiography
Historical Perspective
In the early 1900s, Einthoven and colleagues placed recording electrodes on the right and left arms and the left leg and an additional electrode on the right leg to ground the “elektrokardiogramme” (EKG).1 Three leads (I, II, and III) were produced; each used a pair of limb electrodes, one serving as the positive pole and one as the negative pole. Each lead can be considered to provide two “views” of the cardiac electrical activity: one view from the positive pole and an inverted or “reciprocal” view from the negative pole. The positive poles of these leads are located either to the left or inferiorly so that “normal” cardiac waveforms typically appear primarily upright on the recording. For lead I, the left arm electrode is the positive pole, and the right arm electrode is the negative pole. Lead II, with its positive pole on the left leg and its negative pole on the right arm, provides a view of the electrical activity along the long (base to apex) axis of the heart. Finally, lead III has its positive pole on the left leg and its negative pole on the left arm (Figure 10-1, A).
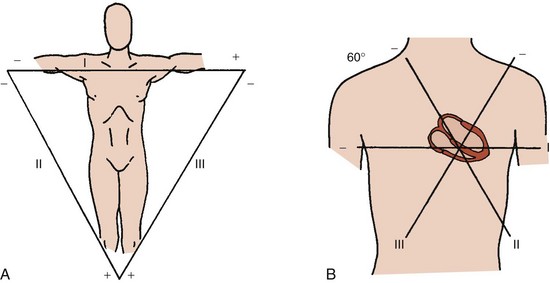
These three leads form the Einthoven triangle, a simplified model of the true orientation of the leads in the frontal plane. Consideration of these three leads as they intersect in the center of the frontal plane while retaining their original orientation provides a triaxial reference system for viewing cardiac electrical activity (Figure 10-1, B).
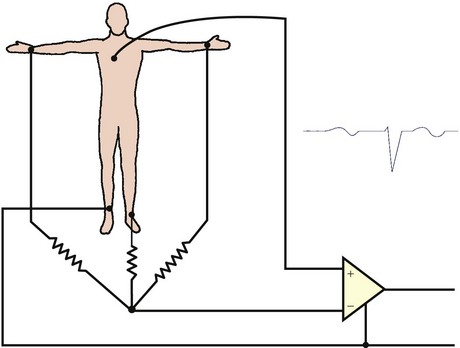
The 60-degree angles among leads I, II, and III create wide gaps among these three views of cardiac electrical activity. Wilson and coworkers developed a method for filling these gaps by creating a central terminal, connecting all three limb electrodes through a 5000-ohm resistor.2 A lead using this central terminal as its negative pole and an exploring electrode at any site on the body surface as its positive pole is termed a V lead. When the central terminal is connected to an exploring electrode on an extremity, the electrical signals are small. The amplitude of these signals in the frontal plane may be augmented by disconnecting the attachment of the central terminal to the explored limb. Such an augmented V lead is termed an aV lead. For example, aVF measures the potential difference between the left leg and the average of the potentials at the right and left arms. The gap between leads I and II is filled by lead aVR, between leads II and III by lead aVF, and between leads III and I by lead aVL. Leads aVR, aVL, and aVF were introduced in 1932 by Goldberger and colleagues. The positive poles of aVL and aVF are located to the left or inferiorly so that “normal” cardiac waveforms typically appear primarily upright on the recording; however, the positive pole of lead aVR is located to the right and superiorly so that “normal” cardiac waveforms typically appear primarily downward.
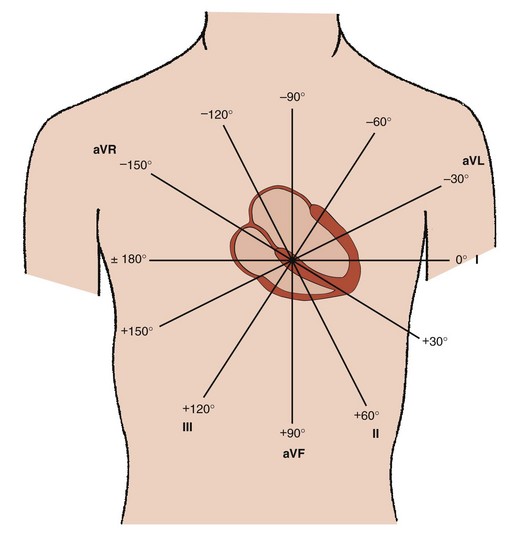
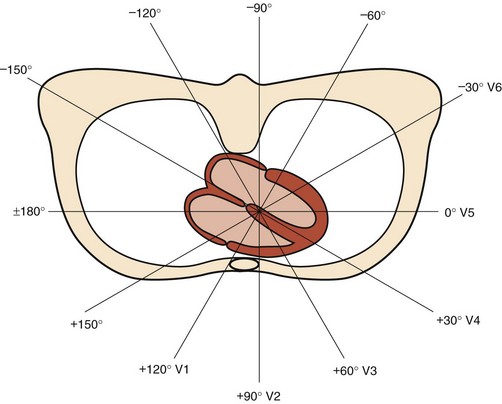
Addition of these three aV leads to the triaxial reference system produces a hexaxial system for viewing the cardiac electrical activity in the frontal plane with the six leads separated by angles of only 30 degrees. This provides a perspective of the frontal plane similar to the face of a clock, as discussed later in Section III and illustrated in Figure 10-2. Using lead I (located at 0 degrees) as the reference, positive designations increase at 30-degree increments in a clockwise direction to +180 degrees, and negative designations increase at the same increments in a counterclockwise direction up to –180 degrees. Lead II appears at +60 degrees, aVF at +90 degrees, and III at +120 degrees, respectively. Leads aVL and aVR have designations of –30 degrees and –150 degrees, respectively. The negative poles of each of these leads complete the “clock face.” Most modern electrocardiographs use digital technology. They record leads I and II only and then calculate the remaining limb leads in real time based on Einthoven’s law: I + III = II.1 The algebraic outcome of the formulas for calculating the aV leads from leads I, II, and III are:
Today’s standard 12-lead ECG includes these six frontal plane leads plus six leads relating to the transverse plane of the body. These leads, introduced by Wilson, are produced by connecting the central terminal to an exploring electrode placed at various positions across the chest wall.3–7 Since the positive electrodes of these leads are close to the heart, they are termed precordial, and the electrical signals have sufficient amplitude so that no augmentation is necessary. However, because leads must be bipolar, they should not be termed “precordial” because they also provide electrical information from the opposite (postcordial) aspect of the heart. Indeed, by the laws of physics, the negative electrode could be considered to be at the location on the posterior thorax that is a direct extension of the line from the positive electrode to the center of cardiac electrical activity provided by the central terminal. The six leads are labeled V1 through V6 because the central terminal connected to all three of the limb electrodes provides their negative poles (Figure 10-3). Lead V1, with its positive pole on the right anterior precordium and its negative pole on the left posterior thorax, provides the view of cardiac electrical activity that best distinguishes left versus right cardiac activity (Figure 10-4). The sites of the exploring electrode are determined by bony landmarks on the anterior and left lateral aspects of the thorax, and the angles between the six transverse plane leads are approximately 30 degrees, the same as the angles between the six frontal plane leads.
Basic Principles
Anatomic Orientation of the Heart Within the Body
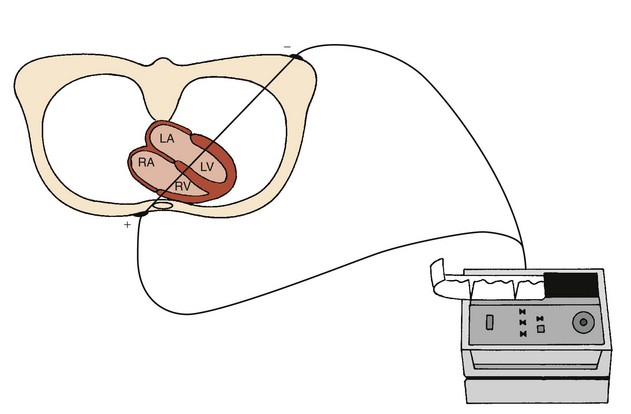
The position of the heart within the body determines the “view” of the cardiac electrical activity that can be observed from any ECG recording electrode site on the body surface. The atria are located in the top or base of the heart, and the ventricles taper toward the bottom or apex. However, the right and left sides of the heart are not directly aligned with the right and left sides of the body. The long axis of the heart, which extends from base to apex, is tilted to the left and anteriorly at its apical end (Figure 10-5). Also, the heart is rotated so that the right atrium and ventricle are more anterior than the left atrium and ventricle.8,9 These anatomic relationships dictate that an ECG lead providing a right anterior to left posterior view (such as V1) provides better differentiation of right versus left cardiac activity than does a lead providing a right lateral to left lateral view (such as lead I) (Figure 10-6).
The Cardiac Cycle
The electrical recording from inside a single myocardial cell as it progresses through a cardiac cycle is illustrated in the top panel of Figure 10-7. During electrical diastole, the cell has a baseline negative electrical potential and is also in mechanical diastole with separation of its contractile proteins. An electrical impulse arriving at the cell allows positively charged ions to cross the cell membrane, causing its depolarization. This movement of ions initiates electrical systole, which is characterized by an action potential (see Figure 10-7, middle panel). This electrical event then initiates mechanical systole, in which the contractile proteins slide over each other, thereby shortening the cell. Electrical systole continues until the positively charged ions are pumped out, causing repolarization of the cell. The electrical potential returns to its negative resting level. This return of electrical diastole causes the contractile proteins to separate again. The cell is then capable of being reactivated if another electrical impulse arrives at its membrane.
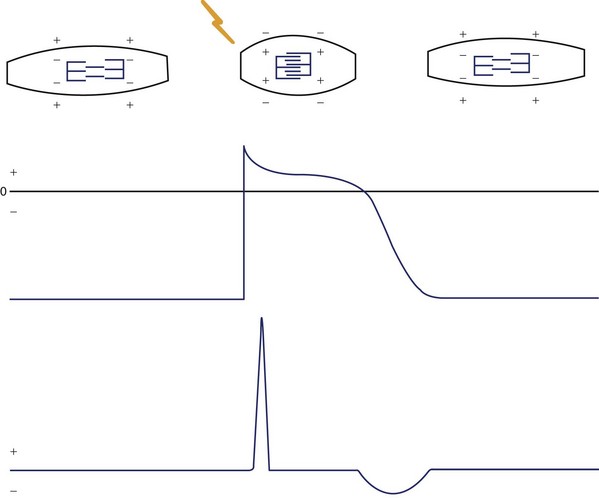
FIGURE 10-7 The schematic electrocardiogram recording beneath a cardiac cellular action potential.
(Modified from Thaler MS: The Only EKG book you’ll ever need, Philadelphia, 1988, JB Lippincott, p 11.)
The ECG recording is formed by the summation of electrical signals from all of the myocardial cells (see Figure 10-7, lower panel). When the cells are in their resting state, the ECG recording produces a flat baseline. The onset of depolarization of the cells produces a relatively high-frequency ECG waveform. Then, while depolarization persists, the ECG returns to the baseline. Repolarization of the myocardial cells is represented on the ECG by a lower frequency waveform in the opposite direction from that representing depolarization.
Cardiac Impulse Formation and Conduction
Myocardial cells normally lack the ability for either spontaneous formation or rapid conduction of an electrical impulse. They are dependent for these functions on specialized (Purkinje) cells of the cardiac pacemaking and conduction system placed strategically through the heart (Figure 10-8). These cells are arranged in nodes, bundles, bundle branches, and branching networks of fascicles. They lack contractile capability but are able to achieve spontaneous electrical impulse formation (acting as pacemakers) and to alter the speed of electrical conduction. The intrinsic pacemaking rate is most rapid in the specialized cells in the sinus node and slowest in the specialized cells in the ventricles. The intrinsic pacing rate is altered by the balance between the sympathetic and parasympathetic components of the autonomic nervous system.10–13
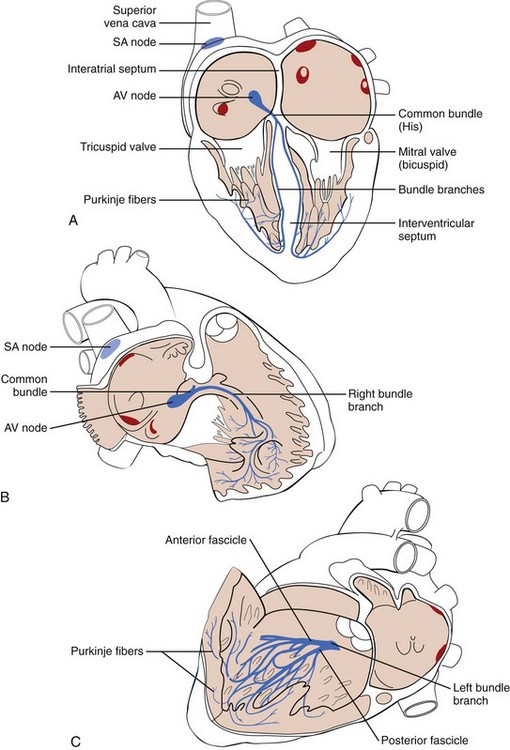
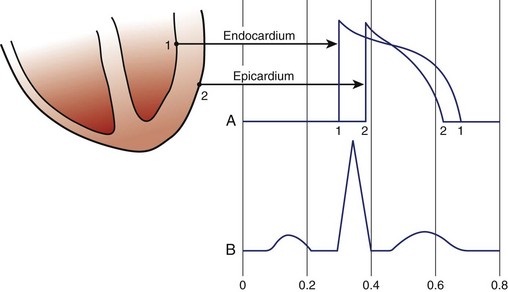
The intraventricular conduction pathways include a common bundle (bundle of His), leading from the atrioventricular (AV) node to the summit of the interventricular septum, and its right and left bundle branches, proceeding along the septal surfaces to their respective ventricles (see Figure 10-8, A). The left bundle branch fans into fascicles that proceed along the left septal surface and toward the two papillary muscles of the mitral valve (see Figure 10-8, B). The right bundle branch remains compact until it reaches the right distal septal surface, where it branches into the distal interventricular septum and toward the lateral wall of the right ventricle (see Figure 10-8, C). These intraventricular conduction pathways are composed of fibers of Purkinje cells with specialized capabilities for both pacemaking and rapid conduction of electrical impulses. Fascicles composed of Purkinje fibers form networks that extend just beneath the surface of the right and left ventricular (LV) endocardium. The impulses then proceed slowly from the endocardium to the epicardium throughout the right and left ventricles.14–16
Electrocardiogram Waveforms
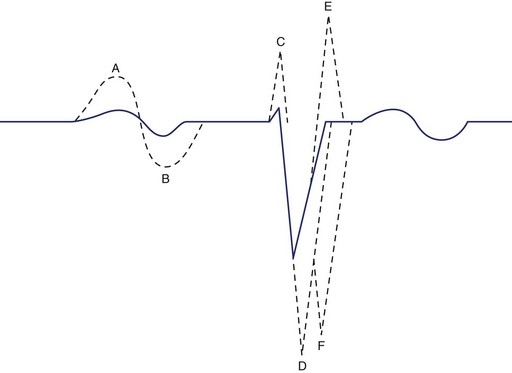
The initial electrical wave of a cardiac cycle represents activation of the atria and is called the P wave (Figure 10-9). Since the sinus node is located in the right atrium, the first part of the P wave represents the activation of this chamber. The middle section of the P wave represents completion of right atrial activation and initiation of left atrial activation. The final section of the P wave represents completion of left atrial activation. The AV node is activated during the inscription of the P wave. The wave representing electrical recovery of the atria is usually obscured by the larger QRS complex, representing the activation of the ventricles. From ECG lead II oriented from the cardiac base to the apex, the P wave is entirely positive, and the QRS complex is predominately positive. Minor portions at the beginning and end of the QRS complex may appear as downward or negative waves. The QRS complex may normally appear as one (monophasic), two (diphasic), or three (triphasic) individual waveforms. By convention, a negative wave at the onset of the QRS complex is called a Q wave. The first positive wave is called the R wave, regardless of whether or not it is preceded by a Q wave. A negative deflection following an R wave is called an S wave. When a second positive deflection occurs, it is termed R′. A monophasic negative QRS complex should be termed a QS wave.
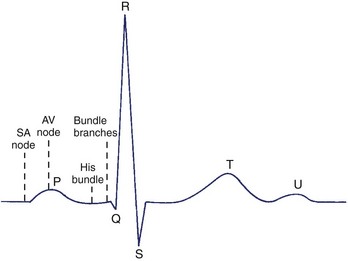
The wave in the cardiac cycle that represents recovery of the ventricles is called the T wave. Since recovery of the ventricular cells (repolarization) causes a current counter to that of depolarization, one might expect the T wave to be inverted in relation to the QRS complex. However, epicardial cells repolarize earlier than endocardial cells, thereby causing the wave of repolarization to spread in the direction opposite that of depolarization. This results in a T wave deflected in a direction similar to that of the QRS complex (Figure 10-10). The T wave is sometimes followed by another small upright wave (the source of which is uncertain) called the U wave.
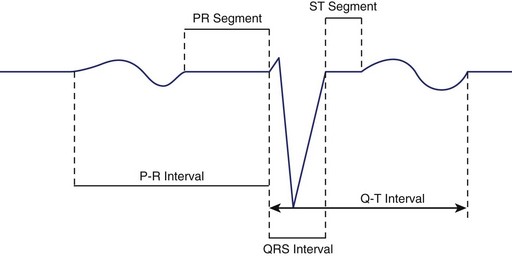
The time from the onset of the P wave to the onset of the QRS complex is called the P-R interval, regardless of whether the first wave in this complex is a Q wave or an R wave (Figure 10-11). This interval measures the time between the onsets of activation of the atrial myocardium and the ventricular myocardium. The designation PR segment refers to the time from the end of the P wave to the onset of the QRS complex. The QRS interval measures the time from the beginning to the end of ventricular activation. Since activation of the thicker left ventricle requires more time than that of the right ventricle, the terminal portion of the QRS complex represents only LV activation.
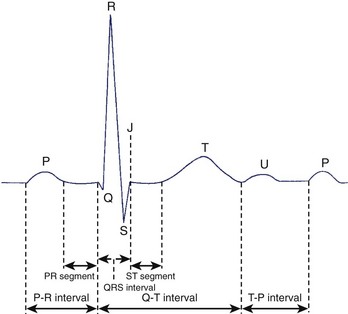
At low heart rates in a healthy person, the PR, ST, and TP segments are at the same horizontal level and form the isoelectric line. This line is considered as the baseline for measuring the amplitudes of the various waveforms. The TP segment disappears at higher heart rates when the T wave merges with the following P wave.17–19
Determining Left Versus Right Cardiac Electrical Activity
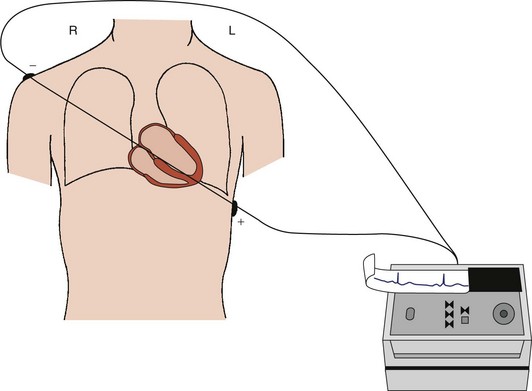
It is often important to determine if an abnormality originates from the left or the right atrium or ventricle of the heart. The optimal site for recording left versus right cardiac electrical activity is located where the extension of the short axis of the heart (perpendicular to the inter-atrial and interventricular septa) intersects with the precordial body surface (lead V1) (Figure 10-12).
The initial part of the P wave representing right atrial activation appears positive in lead V1 because of the progression of electrical activity from the inter-atrial septum toward the right atrial lateral wall. The terminal part of the P wave representing left atrial activation appears negative because of progression from the inter-atrial septum toward the left atrial lateral wall. This activation sequence produces a diphasic P wave (Figure 10-13).
The left versus right recording site is the key ECG view for identifying enlargement of one of the four cardiac chambers and localizing the site of a delay in ventricular activation (Figures 10-13 and 10-14). Right atrial enlargement produces an abnormally prominent initial part of the P wave, and left atrial enlargement produces an abnormally prominent terminal part of the P wave. Right ventricular (RV) enlargement produces an abnormally prominent R wave, whereas LV enlargement produces an abnormally prominent S wave. A delay in the right bundle branch causes RV activation to occur after LV activation is completed, producing an R′ deflection. A delay in the left bundle branch markedly postpones LV activation, resulting in an abnormally prominently S wave (see Figure 10-13).
Interpretation of the Normal Electrocardiogram
In interpreting every ECG, nine features should be examined systematically:
P-R Interval
The P-R interval measures the time required for the impulse to travel from the atrial myocardium adjacent to the sinus node to the ventricular myocardium adjacent to the fibers of the Purkinje network. This normally lasts 0.10 to 0.22 seconds. A major portion of the P-R interval is caused by the slow conduction through the AV node, and this is controlled by the sympathetic-parasympathetic balance of the autonomic nervous system. Therefore, the P-R interval varies with the heart rate, being shorter at faster rates when the sympathetic component predominates, and vice versa. The P-R interval tends to increase with age.20
An abnormal P-wave direction is often accompanied by an abnormally short P-R interval, since the site of impulse formation has moved from the sinus node to a position closer to the AV node (Figure 10-15). However, a short P-R interval in the presence of a normal P-wave axis suggests either an abnormally rapid conduction pathway within the AV node or the presence of an abnormal bundle of cardiac muscle (bundle of Kent) connecting atria and ventricles and bypassing the AV node. This earlier-than-normal activation of the ventricular myocardium (ventricular pre-excitation) creates the potential for electrical reactivation or re-entry into the atria to produce a tachyarrhythmia (the Wolff-Parkinson-White [WPW] syndrome).
A longer than normal P-R interval in the presence of a normal P-wave axis indicates delay in impulse transmission at some point along the pathway between the atrial myocardium and the ventricular myocardium (Figure 10-15). When a prolonged P-R interval is accompanied by an abnormal P-wave direction, the possibility that the P wave is actually associated with the preceding rather than the following QRS complex should be considered. When such retrograde activation from ventricles to atria occurs, the P-R interval is usually even longer than the preceding QRS to P (R-P) interval. When the P-R interval cannot be determined because of the absence of any visible P wave, an obvious abnormality of the cardiac rhythm is present.
QRS Complex
Q Waves
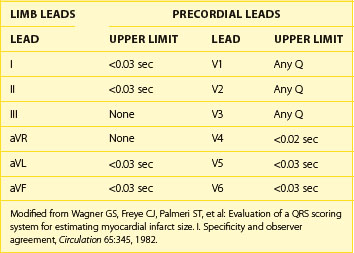
In some leads—V1, V2, and V3—the presence of a Q wave should be considered abnormal, and in all other leads (except III and aVR), a “normal” Q wave would be very small. The “upper limit of normal” for such Q waves in each lead is indicated in Table 10-1.21 The absence of small Q waves in leads V5 and V6 should be considered abnormal. A Q wave of any size is normal in III and aVR because of their rightward orientations. Q waves may be enlarged by conditions such as local loss of myocardium (infarction), hypertrophy or dilation of the ventricular myocardium, or abnormalities of ventricular conduction.
R Waves
Since the precordial leads provide a panoramic view of the cardiac electrical activity progressing from the thinner right ventricle across the thicker left ventricle, the positive R wave normally increases in amplitude and duration from V1 to V4 or V5 (Figure 10-16). Reversal of this sequence with larger R waves in V1 and V2 can be produced by RV enlargement, and accentuation of the normal sequence with larger R waves in V5 and V6 can be produced by LV enlargement. Loss of normal R-wave progression from V1 to V5 may indicate loss of myocardium in the LV wall caused by myocardial infarction (MI).
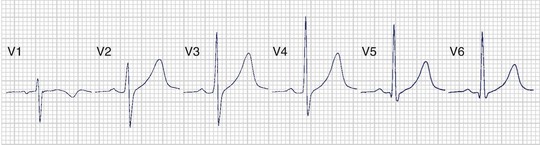
S Waves
The S wave also has a normal sequence of progression in the precordial leads. It should be large in V1, larger in V2, and then progressively smaller from V3 through V6 (see Figure 10-16). As with the R wave, alteration of this sequence could be produced either by enlargement of one of the ventricles or by myocardial infarction.
QRS Axis Determination
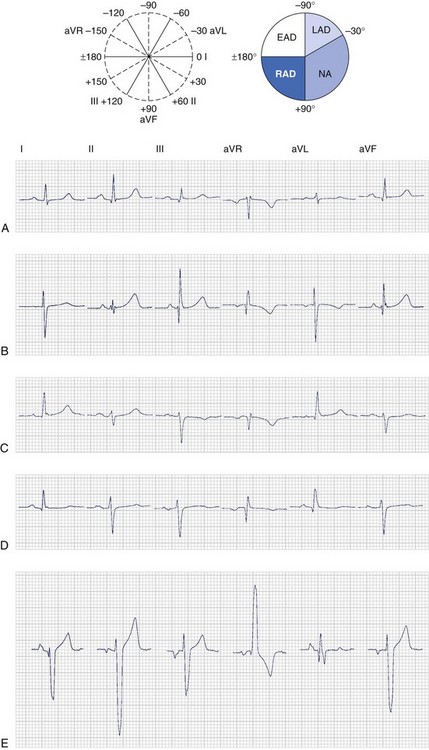
The frontal plane axis is normally directed leftward and either slightly superiorly or inferiorly: between –30 degrees and +90 degrees (see Figure 10-17). Therefore, the QRS complex is normally predominately positive in both leads I (with its positive pole at 0 degrees) and II (with its positive pole at +60 degrees). If the QRS is positive in lead I but negative in II, the axis is deviated leftward between –30 and –120 degrees. However, if the QRS is negative in I but positive in II, the axis is deviated rightward between +90 and +180 degrees. The axis is rarely directed entirely opposite the normal with predominately negative QRS orientation in both leads I and II.
The frontal plane axis is typically rounded to the nearest multiple of 15 degrees. If it is directly aligned with one of the limb leads, the axis is designated as –30 degrees, 0 degrees, +30 degrees, +60 degrees, and so on. If it is located midway between two of the limb leads, it is designated as –15 degrees, +15 degrees, +45 degrees, +75 degrees, and so on. Examples of patients with various frontal plane QRS axes are presented in Figure 10-17.
The normal frontal plane QRS axis is rightward in the neonate, moves to a vertical position during childhood, and then moves to a more horizontal position during adulthood. In normal adults, the electrical axis is almost parallel to the anatomic base to the apex axis of the heart, in the direction of lead II. However, the axis is more vertical in thin individuals and more horizontal in heavy individuals. A QRS axis more positive than +90 degrees in an adult should be designated right-axis deviation (RAD) (see Figure 10-17, B), and an axis more negative than –30 degrees at any age should be designated left-axis deviation (LAD) (see Figure 10-17, C). RV hypertrophy may produce RAD and LV hypertrophy LAD. An axis between −90 and +180 degrees should be considered extreme axis deviation (EAD) without designating it as either rightward or leftward (see Figure 10-17, E).
ST-Segment Morphology
The first section of the ST segment is normally located at the same horizontal level as the baseline formed by the PR segment and the TP segment, which fills in the space between electrical cardiac cycles. Slight up-sloping, down-sloping, or horizontal depression of the ST segment may occur as a normal variant. Another normal variant appears with early repolarization in the epicardial areas within the ventricles.22 This causes displacement of the ST segment in the direction of the following T wave. Occasionally, as much as a 4-mm ST elevation may occur in leads V1 to V3 in normal young males.23 The appearance of the ST segment may also be altered during exercise or with an altered sequence of activation of the ventricular myocardium.
T-Wave Morphology
The smooth, rounded shape of the T wave resembles the shape of the P wave. However, variation of monophasic versus diphasic appearance in the various leads is normal. The initial deflection of the T wave is typically longer than the terminal deflection, producing a slightly asymmetrical shape. Slight “peaking” of the T wave may occur as a normal variant, and notching of the T waves is common in children. The duration of the T wave itself is not usually measured but is, instead, included in the Q-T interval, as discussed later. The amplitude of the T wave, like that of the QRS complex, has wide normal limits. It tends to diminish with age and is larger in males than in females. T-wave amplitude tends to vary with QRS amplitude and should always be greater than that of any U wave that is present. T waves do not normally exceed 5 mm in any limb lead or 10 mm in any precordial lead. The T-wave amplitude tends to be lower in the leads providing the extreme views of both frontal and transverse planes: T waves do not normally exceed 3 mm in leads aVL and III, or 5 mm in leads V1 and V6.24
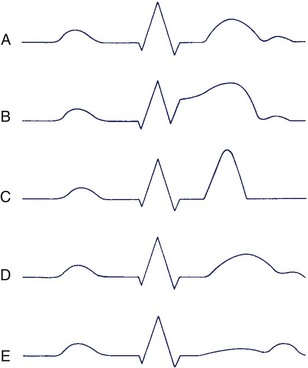
The direction of the T wave should be evaluated in relation to that of the QRS complex (Figure 10-18). The rationale for similar directions of these waveforms that represent the opposite myocardial events of activation and recovery has been presented earlier in the chapter (see “Basic Principles”). The method presented earlier for determining the direction of the QRS complex in the frontal plane should be applied for determining the direction of the T wave. The term QRS-T angle is used to indicate the number of degrees between the QRS complex and T-wave axes in the frontal plane.25 A similar method can be applied in the transverse plane.
Stay updated, free articles. Join our Telegram channel

Full access? Get Clinical Tree


