Chapter 7 Attenuation Correction and Scatter Correction of Myocardial Perfusion SPECT Images
HISTORICAL PERSPECTIVE
The field of SPECT imaging was born out of pioneering work done at Duke University in the late 1970s under Ronald Jaszczak1 and John Keyes.2 It was demonstrated that three-dimensional radionuclide imaging could be obtained using an Anger camera rotating around a patient. As early as 1977, it was recognized that attenuation would be one of the major limitations of the new imaging modality.
The effort to solve the problem of attenuation artifacts in nuclear cardiology was carried forward by several groups around the world. Moore et al. demonstrated the feasibility of performing attenuation correction using x-ray computed tomography (CT),3 and Greer KL et al.4 demonstrated the feasibility of acquiring transmission data with a gamma camera system. A complete history of the development of attenuation correction can be found in King et al., 1995.5
The impact of attenuation was first quantitated in the work of Eisner et al. in 1988.6 In this work, differences between males and females were correctly identified as arising from differences in anatomy. This led to significant differences in the mean normal distribution patterns in the left anterior descending (10% to 15% higher in males than females) and right coronary artery (8% to 10% higher in females than males). Later work by Galt et al. demonstrated that with the application of attenuation correction methods, these normal distributions were similar.7 Depuey et al. developed techniques for identifying attenuation and presented algorithms for improving interpretive accuracy using deductive techniques.8
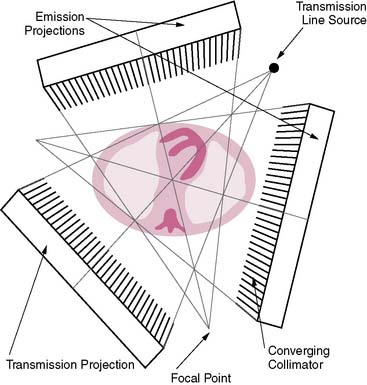
The first attempts at commercialization of attenuation correction were introduced by Picker with its STEP system (Fig. 7-1). This technique was based on the geometry proposed by Tung9 and Jaszczak.10 The system employed a fanning collimator design to collect photons from a fixed line source opposite the detector head on a triple-headed detector system. Early work using this system demonstrated that significant improvements in uniformity could be obtained using the fanbeam collimation system with attenuation correction.11,12 This system failed to received widespread acceptance, because it employed a triple-detector SPECT system and fanbeam collimation. The use of fanbeam collimation led to very extreme truncation artifacts, owing to the small field of view of the fanbeam geometry (~30 cm). Furthermore, the added cost of a third detector system and loss of clinical efficiency from the 120-degree angles of the triple-head systems made this system cost prohibitive.
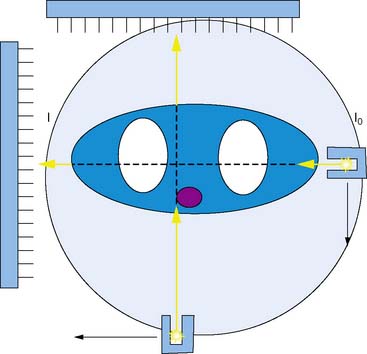
Other vendors introduced parallel-geometry scanning line source systems. The Vantage/ExSPECT system, introduced by ADAC laboratories, used a 90-degree parallel-hole geometry system for simultaneously acquiring emission and transmission data (Fig. 7-2).13 Using this approach, one of the few multicenter trials of attenuation correction was conducted, demonstrating significant improvement in specificity and normalcy. These results were also duplicated in several single and multicenter imaging trials using various vendor approaches.14–21
One of the major limitations of the first-generation systems was that though they work reasonably well in clinical trials, they did not always perform well in the clinical setting.22 Quality control (QC) of the attenuations correction systems was not well understood, and systematic QC procedures were not in place in most nuclear laboratories attempting to use attenuation correction. The result of this was a very uneven application of QC standards in the field and an eventual low rate of adoption by practitioners.
To address these limitations, ADAC laboratories introduced a second-generation processing suite for its Vantage scanning line source systems, the VantagePRO (Philips Medical, Milpitas, CA). This package used a combination of pre- and post-acquisition QC tools combined with a Bayesian iterative reconstruction algorithm to improve the consistency of the resulting images.23 Clinical trials using this approach demonstrated significant improvement in normalcy and specificity; however, because of the retrospective nature of the study, sensitivity did not show improvement over conventional non-attenuation-corrected imaging.
Another approach that was investigated was the use of x-ray computed tomography to derive the patient-specific attenuation map. Because of the high count flux, very high-quality transmission maps can be obtained. Clinical results from these systems have been reported, and they have been shown to produce significant improvement in interpreter accuracy over non-attenuation-corrected image approaches.24,25
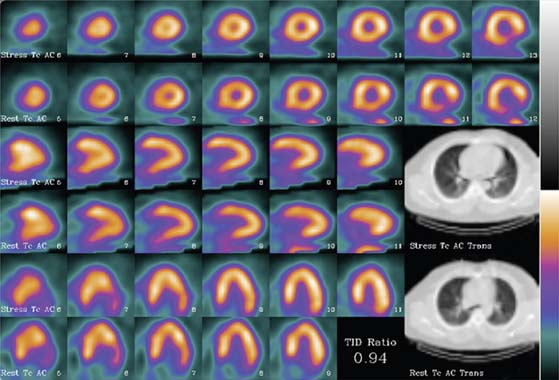
The limitation of x-ray-based approaches is that they are inherently sequential acquisition protocols. Transmission/emission image registration issues, as well as clinical efficiency concerns, have limited the acceptance of these systems. The Hawkeye System, introduced by General Electric, was a departure from the conventional line source attenuation correction, insofar as it employed a low-dose x-ray tube (140 kVp, 2.5 mAs) to generate a patient-specific x-ray-based CT attenuation map referred to as hybrid imaging SPECT/CT. This technique was capable of producing transmission maps and attenuation-corrected images of higher quality (Fig. 7-3). As the need for diagnostic-quality transmission maps has arisen, vendors have introduced SPECT/CT hybrid systems capable of detecting and measuring coronary calcium and performing vascular and coronary CT angiography (Siemens [Symbia], Philips [Precedence]).
SCIENTIFIC FOUNDATION OF ATTENUATION: COMPTON SCATTERING AND THE PHOTOELECTRIC EFFECT (See Chapter 6)
This process is played out in a similar way in the high-energy regimen, albeit with different physical processes in play. Nuclear cardiology (and x-ray imaging as well) exists because of a very peculiar fact of nature: At these energies, the seemingly solid object of the human body is not nearly as solid as it appears. To understand this, we have to introduce an interesting concept, the wave-particle duality of photons.1 At higher and higher energies, photons act as if they have smaller and smaller sizes. In the gamma ray and x-ray ranges, photons could pass through a solid object with little effort. To a high-energy gamma ray, the body looks less like a solid object and more like a cloud of electrons.1
To be precise, attenuation is a misnomer. Most of what is referred to as “attenuation” in nuclear cardiology is in reality photon scatter. The dominant process for “attenuating” photon signal in the energy range used in nuclear cardiology is known as Compton scattering. This process, discovered by Arthur H. Compton in 1923 (resulting in Compton and his graduate student being awarded the Nobel Prize in physics26), is the quantum scatter of light off of matter and the transfer of significant amounts of energy from the photon to the electron.
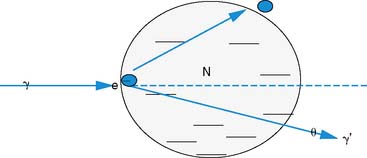
The photon in a Compton scattering event can be thought of as a billiard ball striking the electron. The electron then absorbs some of the energy from the photon, lowering the energy of the photon (Fig. 7-4). The key parameters of a Compton scattering event are the incident energy of the photon (E0) and the scattering angle of the photon relative to its incident and (θ). The higher the incident energy, the more relative energy can be delivered to the electron. (Imagine a compact car–against-truck head-on collision versus a truck-against-truck collision: The second truck will fare worse in the latter scenario.) Furthermore, the larger the scattering angle, the more energy that can be delivered to the electron. Compton demonstrated that the exact energy of the scattered photon can be calculated from the following formula:
where E0 is the energy of the incident photon, mec2 is the resting energy of an electron (511 keV), and θ is the angle of the scattered photon relative to the incident photon. For a backscattered photon: θ = 180 degrees. Solving the Compton equation:
PHYSICS OF ATTENUATION AND SCATTER COMPENSATION
where I is the flux, μ is the linear attenuation coefficient, and  is the change in I over a small distance. In other words, the change in the number of photons over a small distance of material is proportional to the single physical parameter, μ. Solving this equation yields:
Stay updated, free articles. Join our Telegram channel

Full access? Get Clinical Tree


