Chapter 38 Assessment of Myocardial Viability with Positron Emission Tomography
INTRODUCTION
Positron emission tomography (PET) enables quantification of myocardial perfusion, glucose utilization, fatty acid uptake and oxidation, oxygen consumption, contractile function, and presynaptic and postsynaptic neuronal activity. One of the first clinical applications of PET was the assessment of myocardial viability, and it has been generally regarded as the gold standard technique for this indication. The most common approach with PET is comparing myocardial metabolism and perfusion using FDG and ammonia or other perfusion tracers.1 It has been shown that PET can predict regional and global recovery of wall motion, symptoms, functional outcome, and prognosis after revascularization. Also, other tracers and newer techniques are available, such as gating and hybrid imaging using PET/computed tomography (CT) scanners. However, there are less data about their clinical value in the assessment of viability.
METHODS FOR ASSESSING MYOCARDIAL VIABILITY WITH PET
Myocardial Perfusion Tracers
Estimates of regional perfusion themselves have also been used for predicting functional recovery of dysfunctional myocardium. Several studies have investigated the use of nitrogen-13 (13N)-labeled ammonia2 and rubidium-82 (82Rb) in the assessment of viability.3,4 82Rb is a potassium analog that is similar to thallium-201 (201Tl), and its uptake has been shown to be a function of both blood flow and myocardial cell integrity. Oxygen-15 (15O)-labeled water offers a unique feature, since the fraction of tissue that can exchange water can be measured, and this has been used as a marker of myocardial viability.5,6 These techniques, however, are not widely used clinically.
Fluorine-18-Deoxyglucose (See Chapter 40)
Physiologic Basis
Normal myocardium uses a variety of energy-producing substrates to fulfill its energy requirements.7 In the fasting state, free fatty acids (FFA) are mobilized in relatively large quantities from triglycerides stored in adipose tissue. Thus, the increased availability of FFA in plasma makes them the preferred energy-producing fuel in the myocardium.7 In the fed state, however, the increase in plasma glucose and the subsequent rise in insulin levels significantly reduce FFA release from adipose tissue and, consequently, its availability in plasma. This leads to an increased utilization of exogenous glucose by the myocardium.8
FFA metabolism via β-oxidation in the mitochondria is highly dependent on oxygen availability, and thus it declines sharply during myocardial ischemia.9,10 Under this condition, studies in animal experiments9 and in humans11 have shown that the uptake and subsequent metabolism of glucose by the ischemic myocardium is markedly increased. This shift to preferential glucose uptake may play a critical role in the survival of functionally compromised myocytes (i.e., stunned and hibernating), inasmuch as glycolytically derived high-energy phosphates are thought to be critical for maintaining basic cellular functions. Consequently, noninvasive approaches that can assess the magnitude of exogenous glucose utilization play an important role in the evaluation of tissue viability in patients with myocardial dysfunction due to coronary artery disease (CAD). For these metabolic adaptations to occur, sufficient nutrient perfusion is required to supply energy-rich substrates (e.g., glucose) and oxygen, and for removal of the byproducts of glycolysis (e.g., lactate and hydrogen ion). A prolonged and severe reduction of myocardial blood flow rapidly precipitates depletion of high-energy phosphate, cell membrane disruption, and cellular death. Therefore, assessment of regional blood flow also provides important information regarding the presence of tissue viability within dysfunctional myocardial regions.
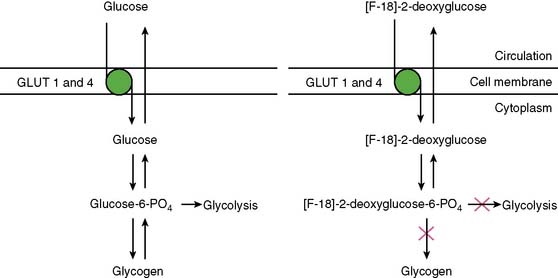
With PET, regional glucose uptake is assessed with fluorine-18 deoxyglucose (FDG), a marker of exogenous glucose uptake that provides an index of myocardial metabolism and thus cell viability. The technique was first described by Tillisch et al.1 After intravenous administration, FDG traces the initial transport of glucose across the myocyte membrane and its subsequent hexokinase-mediated phosphorylation to FDG-6-phosphate (Fig. 38-1).12 Since the latter is a poor substrate for further metabolism and is rather impermeable to the cell membrane, it becomes virtually trapped in the myocardium.
Protocols
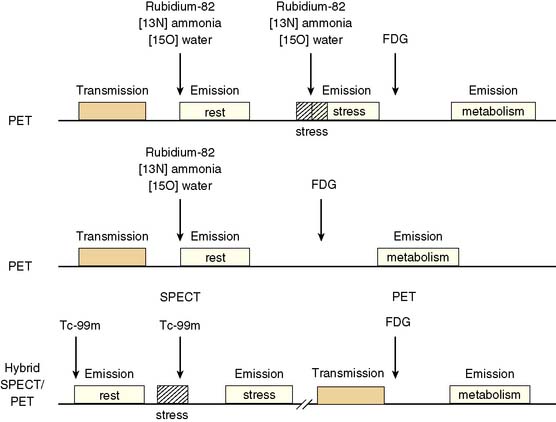
Because dysfunctional myocardium that improves functionally after revascularization must retain sufficient blood flow and metabolic activity to sustain myocyte viability, the combined assessment of regional blood flow and glucose metabolism appears most attractive for delineating myocardial viability. With this approach, regional myocardial perfusion is first evaluated following the administration of 13N-ammonia,82Rb, or 15O-water. Since information regarding the magnitude of both stress-induced ischemia and resting viability is important for management decisions, the ideal approach should include both rest and stress perfusion imaging. However, the selection of the approach (i.e., rest versus stress/rest) should be tailored to the clinical question being addressed in an individual patient (Fig. 38-2). Regional glucose uptake is then assessed with FDG.
Some investigators have also used absolute quantification of glucose uptake.13,14 These studies have documented reasonable results, but absolute quantification of glucose uptake using dynamic imaging and kinetic modeling does not appear to improve diagnostic accuracy, likely because of high variability in glucose utilization rates between individual patients.
Patient Preparation for FDG Imaging
As mentioned, utilization of energy-producing substrates by the heart muscle is largely a function of their concentration in plasma and hormone levels (especially plasma insulin, insulin/glucagon ratio, growth hormone, and catecholamines) and oxygen availability for oxidative metabolism. For a detailed step-by-step description of the available methods for FDG imaging, the reader should review the Guidelines for PET Imaging published by the American Society of Nuclear Cardiology and the Society of Nuclear Medicine15 or European Council of Nuclear Cardiology.16 These approaches for FDG imaging include:
Myocardial Perfusion and Glucose-Loaded FDG Patterns
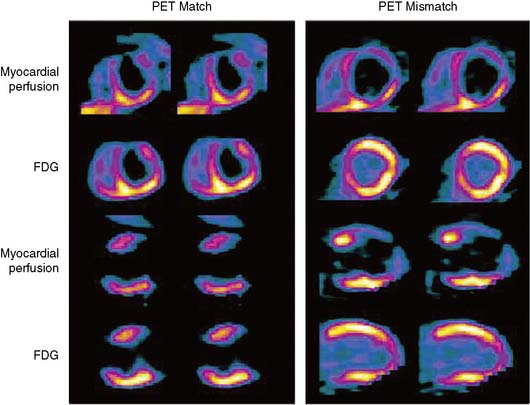
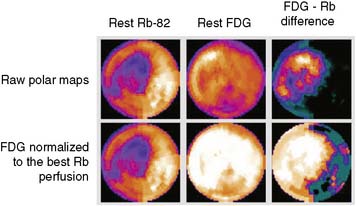
The patterns of normal perfusion and metabolism or of a PET mismatch identify potentially reversible myocardial dysfunction, whereas the PET match pattern identifies irreversible myocardial dysfunction. The reversed perfusion-FDG mismatch has been described in the context of repetitive myocardial stunning22 and in patients with left bundle branch block.23 Images are usually interpreted semiquantitatively, but relative quantitation of regional myocardial perfusion and FDG tracer uptake and their difference can be helpful to objectively assess the magnitude of viability (Fig. 38-6).
Special Considerations for the Hybrid Myocardial Perfusion SPECT and FDG PET Approach
In current clinical practice, FDG PET images are often performed and interpreted in combination with SPECT myocardial perfusion images (see Fig. 38-2). The interpretation of the specific viability patterns shown in Figures 38-3 and 38-4 should be performed carefully, especially when comparing non–attenuation-corrected SPECT myocardial perfusion images with attenuation-corrected FDG PET images. Myocardial regions showing an excessive reduction in tracer concentration due to attenuation artifacts on the perfusion images, such as the inferior wall or the anterior wall in females, may result in falsely positive perfusion-FDG mismatches. Two approaches have proved useful for overcoming this limitation. First, because assessment of viability is relevant only in myocardium with regional contractile dysfunction, gated SPECT or gated PET images offer means for determining whether apparent perfusion defects are associated with abnormal regional wall motion. Second, quantitative analysis of regional myocardial perfusion using polar map displays that are compared to tracer-specific and gender-specific (for SPECT images) databases may be a useful aid to the visual interpretation.
Gated FDG Study
Parameters of global and regional left ventricular (LV) function derived from gated FDG PET images correlate closely with those obtained by MRI.24 As mentioned earlier, gated images are particularly useful when FDG PET patterns are interpreted in relation to non-attenuation-corrected SPECT perfusion images.25 In addition, measures of global LV function and remodeling (i.e., LVEF and volumes) are also useful for predicting improvement in LV function after revascularization.26 Myocardial infarction (MI), especially one that is large and transmural, can produce alterations in both the infarcted and noninfarcted regions that result in changes in LV architecture known as remodeling.27 Increased LV volumes and cavity size are important predictors of poor outcome in patients after infarction28 and may offset the potential benefits from revascularization on ventricular function and survival even if there is evidence of viable (ischemic) myocardium.29–32
Hybrid FDG Positron Emission Tomography and Computed Tomography
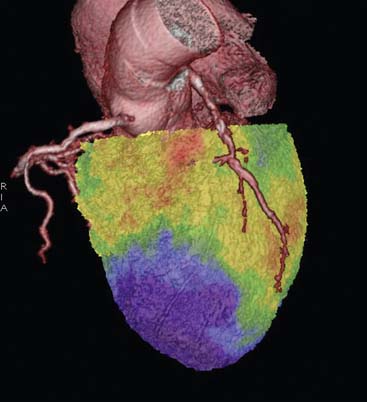
Since modern PET scanners now include a multislice CT scanner, an attractive approach could be performing FDG PET imaging with CT (Fig. 38-7). CT could be used for attenuation correction, calcium score measurement, and visualization of coronary arteries and accompanying stenoses. Recently, multislice CT has been found to have sufficient accuracy to image coronary arteries and assess the coronary stenoses.30 An example of such a viability study using FDG and PET/CT hybrid imaging is displayed in Figure 38-7. The application of contrast-enhanced CT angiography in heart failure patients who need viability investigation may be problematic, owing to advanced coronary atherosclerosis and concomitant problems such as kidney disease. The clinical value of hybrid imaging is at this time still open, and feasibility needs to be explored.
Carbon-11-Acetate
Physiologic Basis
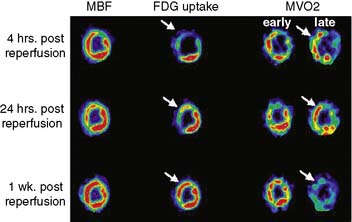
The consumption of oxygen by the myocardium is required for the continued generation of high-energy phosphates to maintain contractile function and other cellular processes. As mentioned, the heart uses a variety of substrates to support overall oxidative metabolism and thus fulfill its energy requirements.7 PET imaging with 11C-acetate offers a direct approach to evaluating myocardial oxygen consumption (MVO2) and oxidative metabolism.31,32 Indeed, the clearance of 11C-acetate from myocardium on PET imaging reflects overall regional myocardial oxidative metabolism. Acetate is a short-chained fatty acid that is readily extracted by myocardial tissue. The extracted acetate is then converted into acetyl-CoA within the mitochondria and undergoes near-complete oxidation by the tricarboxylic acid (TCA) cycle and oxidative phosphorylation.
Quantification of Myocardial Carbon-11-Acetate Kinetics (See Chapter 40)
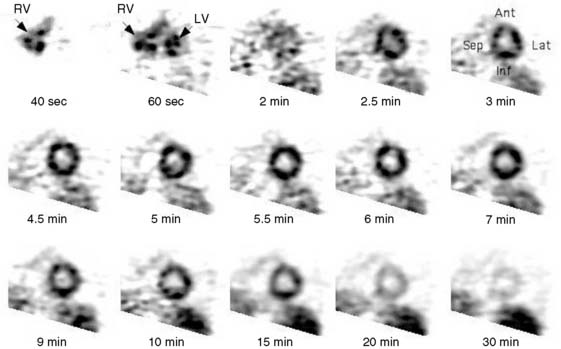
Dynamic imaging following the intravenous administration of [11C]acetate demonstrates the passage of the radioactive bolus through the cardiac chambers, followed by the extraction and accumulation of the radiotracer in the myocardium and its clearance from the blood pool, and finally the clearance of the radiotracer from the myocardial tissue, reflecting the rate of oxidative metabolism (Fig. 38-8). The rapid tissue clearance rate (Kmono) is determined by monoexponential least-squares fitting of the initial portion of the time-activity curve. Kmono values are then compared to reference normal values and used to determine the amount of residual viability within a dysfunctional myocardial segment.33
ACCURACY AND IMPACT OF VIABILITY ASSESSMENT BY PET
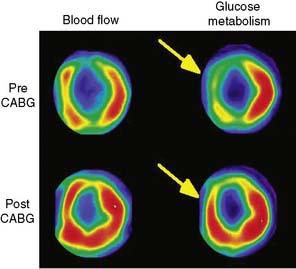
The term viable commonly refers to the myocardial region that has compromised function but is alive and has potential to recover function after revascularization. In patients with chronic LV dysfunction, the frequency of segmental recovery of function after revascularization, as well as the proportion of patients showing functional recovery, has been estimated to be 50% to 60%, even in patients with baseline ejection fraction below 40%.34,35 However, the true prevalence of recoverable dysfunction is likely even higher, because the revascularization is seldom complete, and it may take up to a year to recover function.36–38
The goal of viability assessment in the setting of severe LV dysfunction after MI is to identify patients in whom revascularization can potentially improve LV function, symptoms, and survival. Then viability assessment would be of critical clinical importance in patients with the highest clinical risk after MI (i.e., LVEF < 30%), those who would derive the highest potential benefit from revascularization. Even in patients being considered for cardiac transplantation, viability assessment can alter the initial choice of treatment in majority of the patients.39 However, the vast majority of the published data documenting the accuracy of noninvasive methods for diagnosing viability and predicting functional recovery have been obtained in patients with normal, mild, or moderate LV dysfunction (i.e., LVEF > 30%).34 This is important because the accuracy of noninvasive methods for predicting functional recovery after revascularization appears to decrease significantly with worsening LV function (Fig. 38-9
Stay updated, free articles. Join our Telegram channel

Full access? Get Clinical Tree


