Assessment of Diastolic Function and Diastolic Heart Failure
For patients 65 years and older, heart failure is the most common diagnosis at hospital dismissal, and the frequency of this major cardiovascular disorder is increasing as the population ages. In the early 20th century, 4% of the population was 65 years old. By 2010, 35% of the population is predicted to be older than 65 years. Among the elderly, cardiovascular disease is the most common cause of morbidity and mortality. Traditionally, investigators have focused on abnormalities of systolic function to explain the signs and symptoms of heart failure. However, increasingly, abnormalities of diastolic function are being viewed as influential in precipitating heart failure and determining prognosis. In the United States, 5 million patients have heart failure and 500,000 new cases occur annually. In half of the patients, the primary cause of heart failure is diastolic dysfunction, with preservation of the left ventricular ejection fraction (LVEF) (1,2).
Clinical conditions responsible for primary diastolic heart failure are listed in Table 8-1. Of the 619 patients included in the New York Heart Failure Registry who had an LVEF of 50% or more and were hospitalized for heart failure, 73% were women with a mean age of 70 years and the common comorbid conditions were hypertension in 78%, increased left ventricular (LV) mass in 82%, diabetes mellitus in 46%, and obesity in 46% (3).
According to the guidelines of the American College of Cardiology and the American Heart Association, diastolic heart failure can be diagnosed by the presence of symptoms and signs of heart failure in a patient with a normal LVEF (4). Moreover, abnormal myocardial relaxation and increased filling pressures have to be demonstrated to establish the diagnosis of diastolic heart failure (5). Therefore, the following three conditions must be met to consider cardiac function to be entirely normal: 1) normal systolic function, 2) normal myocardial relaxation, and 3) normal diastolic filling pressures at rest and with exertion. Doppler echocardiography is the most practical method for assessing filling patterns and myocardial relaxation and for estimating LV filling pressures at rest and with exertion by recording flow velocities from the atrioventricular valves, central veins, and myocardial tissue.
Although patients with primary diastolic heart failure do not have an obvious abnormality of either systolic function or a major cardiac structure, a two-dimensional (2D) echocardiography study is rarely normal. The thickness of the LV wall is frequently increased and the left atrium (LA) is usually enlarged because of the chronic increase in LV filling pressures. The increase in LV wall thickness may be due to hypertension, hypertrophic cardiomyopathy, infiltrative cardiomyopathy, or obesity. A not uncommon, but frequently unsuspected, and potentially curable form of diastolic heart failure is constrictive pericarditis (see Chapter 17). Constrictive pericarditis should be suspected when ventricular septal motion is abnormal, with shuddering and respiratory shift. Completely normal 2D echocardiographic findings (i.e., normal LVEF, wall thickness, LA size, and ventricular septal motion) usually exclude diastolic dysfunction, but a comprehensive Doppler examination is required to assess diastolic function. Measurement of LA volume (see Chapter 7) is also helpful in assessing
diastolic function. The cardiac atria are actively remodeled during the evolution of heart failure (6). Normal LA volume in a patient with advanced diastolic dysfunction is most unusual unless the LV filling pressure increases abruptly because of the sudden onset of a structural abnormality, such as severe mitral or aortic regurgitation due to sudden valvular disruption. As has been shown, LA volume is a good predictor of the development of atrial fibrillation and long-term outcome in various cardiac disorders (7,8).
diastolic function. The cardiac atria are actively remodeled during the evolution of heart failure (6). Normal LA volume in a patient with advanced diastolic dysfunction is most unusual unless the LV filling pressure increases abruptly because of the sudden onset of a structural abnormality, such as severe mitral or aortic regurgitation due to sudden valvular disruption. As has been shown, LA volume is a good predictor of the development of atrial fibrillation and long-term outcome in various cardiac disorders (7,8).
Table 8-1 Primary diastolic heart failure | |
|---|---|
|
Diastolic Function
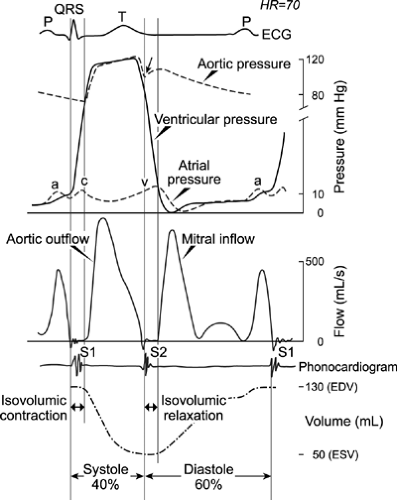
Normal diastolic function allows adequate filling of the ventricles during rest and exercise without an abnormal increase in diastolic pressures. Adequate diastolic filling ensures normal stroke volume, according to the Frank-Starling mechanism. LV filling consists of a series of hemodynamic events (Fig. 8-1) that are affected by numerous intrinsic and extrinsic factors (Table 8-2). The initial diastolic event is myocardial relaxation, an active energy-dependent process that causes pressure to decrease rapidly in the LV after the end of contraction and during early diastole.
The normal cycle of cardiac contraction and relaxation requires a precise, transient increase and decrease in the intracellular concentration of calcium ions. The sarcoplasmic reticulum helps orchestrate the movement of calcium during each contraction and each relaxation (9,10). The contraction of cardiac muscle is initiated by the cellular action potential that causes the opening of L-type sarcolemmal calcium channels through which calcium ions enter the cytosol. This influx of calcium ions results in the release of more calcium ions from the adjacent sarcoplasmic reticulum through ryanodine receptor channels, a process called calcium-induced calcium release. These calcium ions bind to troponin C, which ultimately disinhibits the interaction of actin and myosin and results in the formation of cross-bridges (11,12). Myocardial relaxation is accomplished primarily by the removal of calcium ions from troponin C by an enzyme in the sarcoplasmic reticulum, called sarcoplasmic reticulum calcium adenosine triphosphatase (SERCA2), and the sarcolemmal sodium-calcium exchanger. In humans, approximately 75% of calcium ions are removed by SERCA2 and 25% by the sodium-calcium exchanger (13). The activity of SERCA2 is modulated by phospholamban, a protein located near SERCA2 in the sarcoplasmic reticulum. Through phosphorylation by protein kinase A and other kinases, phospholamban enhances calcium ion uptake by SERCA2. Failure of the mechanisms of reuptake of calcium ions extruded during contraction can result in the slowing of relaxation or the inability of the cytosolic calcium concentration to return to normal diastolic levels. The latter causes diastolic calcium overload and incomplete relaxation that includes excessive diastolic tension or stiffening. An experimental model of senescence has demonstrated that decreased uptake of calcium ions by the sarcoplasmic reticulum during relaxation is associated with a decrease in the concentration and activity of SERCA2. More recently, SERCA2 levels were found to be greatly decreased in senescent human myocardium (14). This decrease was associated with impaired myocardial function at baseline, and further deterioration occurred during hypoxic conditions. Thus, a decrease in SERCA2 concentration
and an associated decrease in uptake of calcium ions by the sarcoplasmic reticulum are thought to influence diastolic dysfunction. Despite normal systolic function, the vulnerability of calcium reuptake is a contributing factor to abnormal LV relaxation early in cardiac disease.
and an associated decrease in uptake of calcium ions by the sarcoplasmic reticulum are thought to influence diastolic dysfunction. Despite normal systolic function, the vulnerability of calcium reuptake is a contributing factor to abnormal LV relaxation early in cardiac disease.
Table 8-2 Factors that influence distensibility of the left ventricular (LV) chamber during diastole | ||
|---|---|---|
|
With active myocardial relaxation, LV pressure becomes less than LA pressure, and when this occurs, the mitral valve opens and rapid early diastolic filling begins. Normally, the predominant determinant of the driving force of early diastolic filling is the elastic recoil and normal relaxation of the LV; LA pressure is less important. Approximately 80% of LV filling occurs during this phase. As a result of rapid filling, LV pressure increases and momentarily may exceed LA pressure, and this loss of positive driving force results in deceleration of mitral inflow. A positive transmitral pressure gradient and flow are created again by atrial contraction during late diastole, and this accounts for 15% to 20% of LV filling in normal subjects.
Changes in the transmitral pressure gradient are demonstrated accurately by mitral inflow Doppler velocities, which reflect the relation between LV and LA pressures during diastole (15,16). The three types of myocardial fiber are the longitudinal, radial, and circumferential fibers. Normal myocardial relaxation is a result of the well-coordinated motion of these fibers, which causes the twisting and untwisting of the heart. It is most practical for echocardiography to record the longitudinal motion of the myocardium. With myocardial relaxation, the LV cavity elongates and expands laterally. The longitudinal motion of the mitral anulus has been shown to reflect the rate of myocardial relaxation (17). The velocity of the mitral anulus can be recorded with tissue Doppler imaging, which has become an essential part of the echocardiographic evaluation of diastolic function (18,19,20).
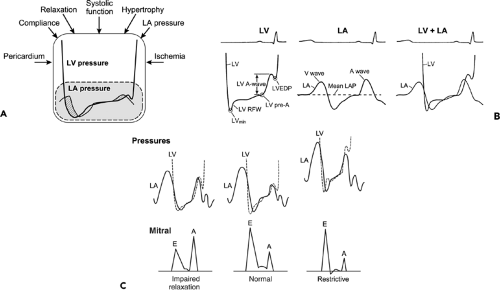
For each person, the proportion of LV filling during the early and late phases of diastole depends on elastic recoil (suction), the rate of myocardial relaxation, chamber compliance, and LA pressure. In cardiac disease, the status of these variables depends on the interaction of the disease process, the baseline diastolic properties, and LV volume. The LV filling pattern is the result of the transmitral pressure gradient produced by these various factors (Fig. 8-2). Therefore, after the 2D echocardiography study, LV diastolic filling is analyzed from recordings of mitral flow velocity that represent the transmitral pressure gradient (Fig. 8-3). In most patients, the LV diastolic filling pattern can be determined with 2D echocardiography and mitral inflow recordings. However, a definitive assessment of diastolic filling and estimation of filling pressures may require tissue Doppler, pulmonary vein Doppler, hepatic vein Doppler, and color M-mode imaging of mitral inflow, occasionally, with an alteration in the loading condition. The normal values of these diastolic variables are provided in the Appendix.
Doppler Flow Velocities
Mitral Flow Velocities
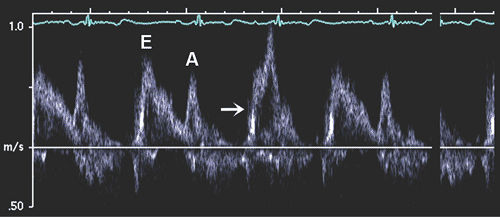
Diastolic filling usually is classified initially on the basis of the peak mitral flow velocity of the early rapid filling wave (E), peak velocity of the late filling wave due to atrial contraction (A), and the E/A ratio (Fig. 8-3). To measure E and A velocities reliably, the Doppler velocity recording should be satisfactory. Tachycardia or first-degree atrioventricular block may result in fusion of the E and A velocities (Fig. 8-4). In fact, A velocity may be relatively increased if it starts before E velocity has reached zero. Generally, if E velocity is more than 20 cm/s at the beginning of A velocity (E at A), both the A velocity and E/A ratio may be affected by the fusion of the E and A velocities (Fig. 8-5).
The diastolic filling pattern is characterized further by measuring the deceleration time (DT), the interval from the peak of the E velocity to its extrapolation to baseline. In patients with a relaxation abnormality as the predominant diastolic dysfunction, DT is prolonged because, with a slower and continued decrease in LV pressure until
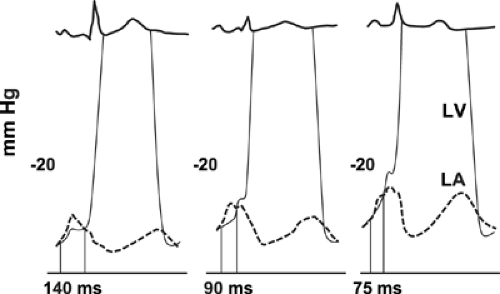
mid to late diastole, it takes longer for LA and LV pressures to equilibrate. DT is shortened if there is rapid filling due to vigorous LV relaxation and elastic recoil, as in normal young subjects, or, conversely, if there is a decrease in LV compliance or marked increase in LA pressure. The isovolumic relaxation time (IVRT) is the interval from aortic valve closure to mitral valve opening. It generally parallels DT, being prolonged with abnormal relaxation and shortened with rapid relaxation or increasing filling pressure (or both). The duration of mitral flow with atrial contraction is useful for estimating LV end-diastolic pressure (LVEDP) (21,22, because it is shortened with a higher LVEDP (Fig. 8-6). In a patient with impaired relaxation and mild-to-moderate increase in filling pressures, the mitral flow pattern resembles a normal filling pattern because of the opposing effects of myocardial relaxation and increased filling pressures on mitral velocity variables. Therefore, the normalized filling pattern due to moderate diastolic dysfunction has been termed pseudonormalized mitral inflow. We need to demonstrate impaired relaxation or increased filling pressure to characterize a normal-appearing mitral inflow as a pseudonormalized pattern.
mid to late diastole, it takes longer for LA and LV pressures to equilibrate. DT is shortened if there is rapid filling due to vigorous LV relaxation and elastic recoil, as in normal young subjects, or, conversely, if there is a decrease in LV compliance or marked increase in LA pressure. The isovolumic relaxation time (IVRT) is the interval from aortic valve closure to mitral valve opening. It generally parallels DT, being prolonged with abnormal relaxation and shortened with rapid relaxation or increasing filling pressure (or both). The duration of mitral flow with atrial contraction is useful for estimating LV end-diastolic pressure (LVEDP) (21,22, because it is shortened with a higher LVEDP (Fig. 8-6). In a patient with impaired relaxation and mild-to-moderate increase in filling pressures, the mitral flow pattern resembles a normal filling pattern because of the opposing effects of myocardial relaxation and increased filling pressures on mitral velocity variables. Therefore, the normalized filling pattern due to moderate diastolic dysfunction has been termed pseudonormalized mitral inflow. We need to demonstrate impaired relaxation or increased filling pressure to characterize a normal-appearing mitral inflow as a pseudonormalized pattern.
 Figure 8-3 A: Mitral inflow velocity. Inset, Diagram of apical four-chamber view with a sample volume (1–2 mm size) between mitral leaflet tips during diastole. LA, left atrium; LV, left ventricle; RA, right atrium; RV, right ventricle. Pulsed wave Doppler recording of mitral leaflet tips provides mitral inflow velocity pattern from which early diastolic velocity (E), late diastolic velocity with atrial contraction (A), E/A ratio, and deceleration time (DT or Mdt) are derived to characterize diastolic filling. Duration of atrial filling (A dur) and isovolumic relaxation time (IVRT) are also useful variables to characterize diastolic function and filling pressures. Both LV outflow tract and mitral flow are recorded by placing a sample volume between the outflow tract and mitral valve. B: Doppler recording of mitral inflow velocities, showing impaired relaxation (left), normal (center), and restrictive filling (right) patterns. Arrowheads (right) indicate diastolic mitral regurgitation. DT, deceleration time. (A From Oh et al. [16]. Used with permission.) |
 Figure 8-4 A: Pulsed-wave Doppler recording of mitral flow (left) and pulmonary venous flow velocity pattern (right) in a patient with a very prolonged P wave-to-R wave (PR) interval. Because mitral inflow velocity has only one velocity component, it is difficult to assess the diastolic filling pattern. However, pulmonary venous flow velocity shows a predominant diastolic forward flow velocity and diminutive systolic forward flow velocity, consistent with restrictive filling. Arrows, pulmonary vein flow reversal before diastolic flow due to early atrial contraction; D, diastolic flow; S, systolic flow. B: Mitral flow velocity recording by pulsed wave Doppler echocardiography. There is only one velocity component for the first two cardiac cycles, but with a premature ventricular contraction, the E velocity (arrow) becomes separated from the A velocity, consistent with relaxation abnormality. (From Oh et al. [16]. Used with permission.) |
Mitral Inflow Velocities with Valsalva Maneuver
The Valsalva maneuver, which is performed by forceful expiration (about 40 mm Hg) against a closed nose and mouth, produces a complex hemodynamic process involving four phases (Fig. 8-7). Frequently, during a physical examination, this maneuver is used to assess a cardiac murmur; it is also helpful in the echocardiographic assessment of diastolic function (23). Because LV preload is reduced during the strain phase (phase II) of the Valsalva maneuver, this maneuver decreases E velocity, lengthens DT of the E velocity, and increases A velocity if the
patient has already increased filling pressure (Fig. 8-8). In patients with normal filling pressure, the Valsalva maneuver decreases both the E and A velocities and lengthens DT. Therefore, the Valsalva maneuver is used to differentiate a normal mitral inflow velocity pattern from a pseudonormal pattern (24). In patients with a restrictive filling pattern, the reversibility of advanced diastolic dysfunction is assessed with the Valsalva maneuver. However, not all patients can perform a Valsalva maneuver satisfactorily.
patient has already increased filling pressure (Fig. 8-8). In patients with normal filling pressure, the Valsalva maneuver decreases both the E and A velocities and lengthens DT. Therefore, the Valsalva maneuver is used to differentiate a normal mitral inflow velocity pattern from a pseudonormal pattern (24). In patients with a restrictive filling pattern, the reversibility of advanced diastolic dysfunction is assessed with the Valsalva maneuver. However, not all patients can perform a Valsalva maneuver satisfactorily.
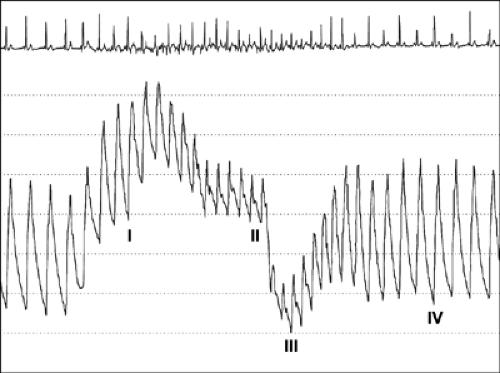 Figure 8-7 Aortic pressure tracing from a patient performing the Valsalva maneuver. During phase I, aortic pressure increases transiently because of an increase in intrathoracic pressure. In phase II, aortic pressure and pulse pressure decrease because of a gradual decrease in preload in the left ventricle. In patients with normal left ventricular filling pressures, reflex tachycardia occurs during phase II because of activation of the baroreceptors. In phase III, aortic pressure decreases further in response to release of intrathoracic pressure. Phase IV is the recovery period in which preload in the left ventricle, aortic pressure, and pulse pressure increase. (From Nishimura and Tajik [23]. By permission of Mayo Foundation for Medical Education and Research.) |
Mitral Anulus Velocities
Although the movement of the mitral anulus can be recorded with M-mode echocardiography, tissue Doppler imaging is the method of choice for recording the longitudinal velocities of the mitral anulus (18,25). These velocities are recorded from the apical four-chamber view by placing a 2 to 5-mm sample volume over the lateral or medial portion of the mitral anulus (Fig. 8-9). Normally, three distinct velocities are recognized: systolic (S′), early diastolic (E′), and late diastolic (A′) velocities (Fig. 8-9). Additional isovolumic or mid-diastolic velocities may be recorded. E′ velocity is essential for classifying the diastolic filling pattern and estimating filling pressures. It also is extremely helpful in distinguishing between constrictive pericarditis and other forms of myocardial diastolic heart failure. A′ velocity has been studied less well, but it has been found to correlate with LA function (26). E′ velocity reflects relaxation of the myocardium. In normal subjects, E′ increases as the transmitral gradient increases with exertional or increased preload; however, in patients with impaired myocardial relaxation, E′ is reduced at baseline and does not increase as much as in normal subjects with increased preload (17) (Fig. 8-10). Therefore, a decrease in E′ is one of the earliest markers for diastolic dysfunction, and this decrease is present in all stages of diastolic dysfunction (18,26). E′ decreases with aging—even earlier than the decrease in mitral inflow E velocity. Because E′ velocity remains reduced and mitral E velocity increases with higher filling pressure, the ratio between E and E′, E/E′, correlates well with LV filling pressure or pulmonary capillary wedge pressure (Fig. 8-11). Normally, the E′ velocity from the lateral anulus is higher than the E′ velocity from the medial anulus (normal, ≥15 cm/s vs. ≥10 cm/s).
Mitral Inflow Propagation Velocity (Vp)
Normal LV relaxation induces an active suction of blood and creates diastolic intraventricular gradients. Courtois and colleagues (27) demonstrated that pressures at the apex are lower than those at the base of heart, and this intraventricular gradient decreases or disappears with a decrease in myocardial relaxation. The intraventricular pressure gradient implies that there are regional differences in myocardial relaxation, with the apex segment showing the earliest relaxation in a normal heart.
Color M-mode of mitral inflow displays color-coded mean velocities from the anulus area to the apex over time (28,29,30,31). Color M-mode is obtained by placing a cursor line along the central part of the mitral inflow blood column (Fig. 8-12). The color flow baseline needs to be shifted to lower the Nyquist limit so the central highest velocity jet is blue. There are several ways to measure Vp from color M-mode. The most practical way is to trace the slope of the first aliasing velocity (red to blue) from the mitral valve plane to 4 cm distal to the LV. The normal flow propagation velocity is 50 cm/s or higher. It correlates with myocardial relaxation (29). Although Vp initially was thought to be independent of preload, subsequent studies have suggested that it depends on preload and cardiac size (31,32,33). Vp has been used to estimate pulmonary capillary wedge pressure (PCWP) (34,35,36, as follows:
PCWP = 4.5 × [103/(2 × IVRT) + Vp] – 9
PCWP = (5.27 × E/Vp) + 4.6
E/Vp ≥1.5 predicts PCWP >15 mm Hg, but Vp can be falsely high in hypertrophic and restrictive cardiomyopathy when LV cavity size is small.
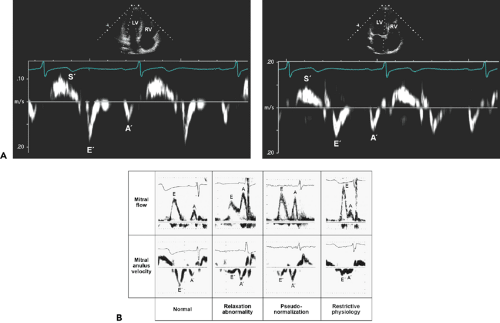 Figure 8-9 Mitral anulus velocities are recorded with tissue Doppler imaging, which is a modification of pulsed wave Doppler. A: A sample volume is placed over the lateral (left) or medial (right) anulus position. Lateral anulus velocity is usually higher than the velocity from the medial anulus. Normal mitral anulus velocities are shown. A′, late diastolic anulus velocity; E′, early diastolic anulus velocity; LV, left ventricle; RV, right ventricle; S′, systolic anulus velocity. B: Patterns of mitral inflow and mitral anulus velocity from normal to restrictive physiology. The mitral anulus velocity was obtained from the septal side of the mitral anulus using Doppler tissue imaging. Each calibration mark in the recording of mitral anulus velocity represents 5 cm/s. E′ is greater than A′ in a normal pattern. In all other patterns, E′ is not greater than A′. In relaxation abnormality, E′ and A′ parallel E and A velocities of mitral inflow. However, when filling pressure is increased (pseudonormalization and restrictive physiology), E′ remains decreased (i.e., persistent underlying relaxation abnormality), while mitral inflow E velocity increases. Hence, E/E′ may be useful in estimating LV filling pressure. (B From Sohn et al. [18]. Used with permission.) |
Pulmonary Vein Flow Velocities
Pulmonary vein Doppler recordings show four distinct velocity components (Fig. 8-13): two systolic velocities (PVS1 and PVS2), diastolic velocity (PVd), and atrial flow reversal velocity (PVa). The first systolic forward flow, PVS1, occurs early in systole and is related to atrial relaxation, which decreases LA pressure and fosters pulmonary venous flow into the LA. The second systolic forward flow, PVS2, occurs in mid to late systole and is produced by the increase in pulmonary venous pressure. At normal LA pressure, the late systolic increase in pulmonary venous pressure is larger and more rapid than LA pressure. However, at elevated filling pressures, the late systolic pressure increase in the LA is equal to or more rapid than that in the pulmonary vein, resulting in earlier peak velocity of PVS2. The remaining pulmonary vein flow velocity components (PVd, PVa, PVS1) follow phasic changes in LA pressure (37).
With normal atrioventricular conduction, the systolic components are closely connected, and a distinct PVS1 peak velocity may not be identified in 70% of patients. During diastole, forward flow velocity (PVd) occurs after opening of the mitral valve and in conjunction with the decrease in LA pressure. With atrial contraction, the increase in LA pressure may result in flow reversal into the pulmonary vein. The extent and duration of the flow reversal are related to LV diastolic pressure, LA compliance, and heart rate. The diastolic phase of pulmonary venous flow resembles early mitral flow (E). The peak velocity and DT correlate well with those of mitral E velocity because the LA functions


Stay updated, free articles. Join our Telegram channel

Full access? Get Clinical Tree


