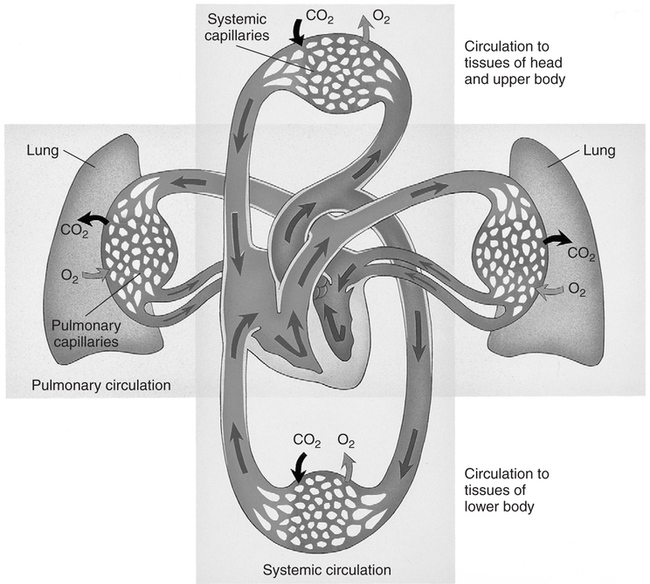
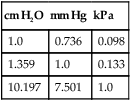
Over the past decade, the incidence of arterial blood gas sampling has decreased primarily for cost-containment reasons. Clinicians, casually and increasingly, rely on pulse oximetry as a complete substitute for arterial blood gas data. Although pulse oximetry is extremely valuable and provides us with real-time information, it provides only one small piece in oxygenation assessment. Furthermore, it has been shown that many junior physicians and nurses do not fully understand this technology and make serious errors in its interpretation.167 More importantly, pulse oximetry provides absolutely no information regarding ventilation and acid-base balance. In one study, more than 50% of surgical patients who had arterial blood gases drawn manifested alkalemia at some point during their hospital stay.106 With only pulse oximetry, these acid-base abnormalities may easily go unnoticed and untreated. In contrast to pulse oximetry, there are myriad reasons for arterial blood gas analysis. According to Clinical Guidelines published by the American Association for Respiratory Care (AARC), indications also include assessment of the adequacy of ventilation, acid-base evaluation, diagnostic evaluation, quantification of response to therapy, and monitoring of severity and progression of disease.15 Several studies have shown that by avoiding the use of blood gases, we may be delaying or preventing detection of serious oxygenation and acid-base disturbances.108 109 110 111 The real incremental cost of an arterial blood gas report is minuscule. The neglected and unquantifiable cost of overlooked clues in the diagnosis of life-threatening disturbances (i.e., acid-base, ventilation, and oxygenation) is immeasurable. Arterial blood gases remain the gold standard in comprehensive emergency and critical care assessment. Their value must be weighed against the potential for real, substantial cost savings and patient harm. Table 1-1 shows the various indices that are typically reported when an arterial blood gas is acquired. Collectively, these indices give us valuable information about the important triad of patient oxygenation, ventilation, and acid-base balance. Table 1-1 Normal Arterial Blood Gas Values There are two indices shown in Table 1-1 (i.e., PaO2 and SaO2) that basically reflect the amount of O2 present in the blood. Oxygen is carried in the blood in two forms, dissolved O2 and combined O2. The PaO2 is the partial pressure of O2 dissolved in arterial blood, whereas the SaO2 is the oxygen saturation of arterial hemoglobin (an indicator of combined O2). Technically, the partial pressure of oxygen (denoted PO2) is defined as the pressure of O2 in both a gas phase and a solution in equilibrium.6 In contrast, oxygen saturation is the amount of oxyhemoglobin in a solution expressed as a fraction (%) of the total amount of hemoglobin able to bind oxygen.6 It is noteworthy that abnormal (inactive) forms of hemoglobin (dyshemoglobins) are not considered in this calculation.241 The PaO2 is directly measured and is the most sensitive indicator of oxygenation directly measured. The PaO2 should be a focal point of every blood gas interpretation. The SaO2 is a calculated value and a less sensitive indicator. There are times when a calculated SaO2 may be misleading (e.g., burn patients) so it is sometimes not included with the routine blood gas report. Calculated SaO2 should not be used for further clinical calculations such as shunt fraction because it may introduce significant error.241 SaO2 can actually be measured directly with co-oximetry (as opposed to calculated) in cases when this value is essential. Clinical and technical issues related to co-oximetry are discussed in Chapters 11 and 15. The remaining indices shown in Table 1-1 ([HCO3] and [BE]) are “non-respiratory” acid-base indices. Non-respiratory indices are commonly referred to as metabolic indices. Metabolic indices will be abnormal when the patient has a so-called metabolic (non-respiratory) acid-base disturbance. Actually, the term metabolic is sometimes misleading because the patient often does not have a problem with metabolism per se, nevertheless, it is well ingrained in the acid-base lexicon and will be used in this text. Although it is common practice, it is really unnecessary to include both [BE] and plasma [HCO3] on a report. This practice originates from the Great Transatlantic Debate4 5 between the Boston and Copenhagen schools of thought regarding acid-base diagnosis and treatment. Historically, a variety of other metabolic indices have been reported (e.g., standard bicarbonate, total body buffer base, and CO2 combining power2 3), but none of these indices is currently well accepted. Furthermore, they provide us with no additional information necessary for optimum care of patients. They may, however, serve as a source of confusion and are probably best omitted from the blood gas report. The various quantities shown in Table 1-1 are referred to collectively as arterial blood gases (ABGs). The values indicated in Table 1-1 are normal ranges for adults. Normal ranges are defined by the criterion that 95% of the normal population have values that fall within this range. Normal values for any laboratory measurement are established through measurements made on individuals assumed to have normal health. The average value is calculated as well as the dispersion of values around the average, which is described by a statistical term called the standard deviation. A large number of measurements made on any normal population generally yields a distribution pattern similar to the one shown in Figure 1-1. The most frequent value observed would be identical to the arithmetic mean. As values deviate more and more from the mean, they occur less and less frequently. The curve represented in Figure 1-1 is referred to as the normal (or gaussian) distribution. In the normal distribution, 68% of the population has values that fall within 1 standard deviation and 95% of the values measured in the population fall within 2 standard deviations. Finally, 99.73% of measurements fall within 3 standard deviations. Interestingly, there are data that suggest that the mean normal pH is closer to 7.38 than 7.40.3 Nevertheless, there is little support or reason to change the accepted normal range because the difference is minimal and the range of 7.35 to 7.45 is well ingrained. Regarding the normal blood gas values shown in Table 1-1, one study showed significantly lower values for arterial carbon dioxide tension (PaCO2) in young women compared to values in young men.7 Mean arterial PCO2 in the female group was 33 mm Hg. Lower arterial PCO2 in women compared with men is also consistent with some earlier findings.8 Indeed, values of 30 to 46 mm Hg may more accurately characterize the normal range for the entire population, which is calculated from seven published studies.9 While keeping these issues in mind, the accepted normal range of 35 to 45 mm Hg is used in this text for standardization and to avoid confusion. Normal values for [BE] and [HCO3] may likewise be slightly (i.e., 1 to 2 mEq/L) lower in women than in men.7 Nevertheless, here again, a single accepted normal range of 24 ± 2 mEq/L for [HCO3] and 0 ± 2 mEq/L for [BE] is used because the difference is slight and has little clinical significance. The mean partial pressure of oxygen dissolved in arterial blood (PaO2) in a normal young male is 97 mm Hg at sea level.10 Normal oxygen saturation of arterial hemoglobin (SaO2) is 97.5%. Both PaO2 and SaO2 values tend to decrease with aging. Oxygenation values may also differ slightly with body position; they are typically higher in the sitting position than in the supine (lying on the back) position particularly in the obese or elderly. Finally, altitude and the percentage of O2 inspired also affect PaO2. The effects of these variables on PaO2 are discussed in Chapter 3. In this text, room air (21% oxygen) and sea level (760 mm Hg) are presumed unless otherwise noted. The normal PaO2 in the supine position for an adult 40 to 75 years old can be calculated specifically by the formula PaO2 = 109 − (0.43 × age).242 A PaO2 within ±8 mm Hg of the predicted value is considered to be normal. Because the minimum normal PaO2 at 40 years of age in the supine position is 80 mm Hg, most tables show the normal PaO2 range as being approximately 80 to 100 mm Hg. Technically, however, a PaO2 of 80 mm Hg in a 20-year-old individual is not normal. Arterial PO2 is approximately 5 mm Hg higher in the sitting position than in the supine position and the mean normal value at a given age can be calculated more precisely by the formula PaO2 = 109 − (0.27 × age).11 In general, the difference in PaO2 associated with positional change is minimal in young adults but magnified in the elderly. In clinical practice, it is not usually practical or expedient to calculate PaO2 based on these formulas. An approximate rule of thumb is sometimes useful to estimate the minimum normal PaO2 in adults of different ages. Minimum normal PaO2should exceed 90 mm Hg if the patient is younger than 45 years old. Above the age of 45, PaO2 generally decreases with age; however, low minimum normal PaO2 should exceed 75 mm Hg regardless of age.242 Interestingly, PaO2 seems to progressively decrease between the ages of 45 to 75, then actually increases slightly and levels off beyond age 75.242 This is contrary to earlier beliefs. The recommended SI unit for pressure is the pascal (Pa). Because this unit is too small for clinical use, the kilopascal (kPa) has been recommended for use in blood gases (1 kPa = 1000 Pa). The conversion factor from mm Hg to kPa is 0.133. Thus, the normal range of PaO2 (i.e., 80 to 100 mm Hg) becomes 10.6 to 13.3 kPa, and the normal PaCO2 (i.e., 35 to 45 mm Hg) becomes 4.6 to 6.0 kPa. The clinician may see PaO2 and PaCO2 reported in SI units in some foreign literature, but the awkwardness of the decimal units has hampered general acceptance and there has been a general retreat from SI units in American journals and laboratories.13 Likewise, clinicians continue to use mm Hg or torr when they report pressure measurements in blood gas analysis. A chart of pressure conversion factors between mm Hg, kPa, and cm H2O is shown in Table 1-2. Table 1-2 Pressure Unit Conversion Factors From Burke, J.F.: Surgical Physiology. Philadelphia, W.B. Saunders, 1984. Blood vessels that carry blood away from the heart are classified anatomically as arteries, whereas vessels that return blood to the heart are called veins. Arterial blood in the systemic circulation (Fig. 1-2) provides more information than systemic venous blood with regard to ventilation and oxygenation assessment. Arterial blood is a uniform substance presented to all organs for their metabolic needs. Peripheral venous blood, on the other hand, reflects only localized conditions. The O2 and CO2 levels in a given peripheral vein depend on the metabolic rate and perfusion of the tissue traversed earlier. Because local metabolism may vary widely, venous blood gas samples acquired simultaneously from different peripheral veins likewise vary substantially. The different PvO2 levels in various peripheral veins are discussed later in Chapter 7 and are shown in Table 7-1. Although less accurate than arterial samples, venous samples from a well-perfused patient may provide a gross indication of acid-base balance,5 electrolyte levels, or abnormal hemoglobins.241 Likewise venous blood pH appears to correlate well with arterial blood in patients with uremic acidosis and diabetic ketoacidosis.112 One should also realize that any difference between arterial and venous blood will be exaggerated when the general or local circulation is impaired.107 Thus, measurement of arterial blood gases is the gold standard in the diagnosis and clinical management of oxygenation and acid-base disturbances. Compared with the acquisition of venous blood, arterial sampling is technically more difficult and has greater potential for serious complication. The higher arterial pressure can make bleeding complications more profuse. Furthermore, large clot formation or prolonged spasm in an artery could cut off vital supply of O2 to the tissue. Arterial blood gas samples are also very vulnerable to improper handling technique because of their high gas content. Arterial blood is one of the most sensitive specimens sent for clinical laboratory analysis.107 Pharmacologic therapy should be reviewed to ascertain whether the patient is undergoing anticoagulant or thrombolytic therapy. Commonly prescribed anticoagulants include heparin, warfarin (Coumadin), and dipyridamole. The mild anticoagulant effect of aspirin may be of lesser importance.15 Anticoagulant therapy is associated with an increased likelihood of bleeding complication after puncture, and additional preventive measures should be taken. Consideration may be given to scheduling the arterial puncture approximately 30 minutes before the next scheduled dose of anticoagulant, if feasible.16 Thrombolytics (e.g., streptokinase, tissue plasminogen activator) differ from anticoagulants in that they are administered to break down (lyse) blood clots rather than simply to prevent clotting. Nevertheless, excessive bleeding after arterial puncture may also occur when these drugs are being administered.15 The body secretions that contain the greatest amount of the virus are blood, semen, and vaginal secretions.17 The virus may be transmitted by sexual contact, percutaneous (through the skin) exposure, absorption through mucous membranes (e.g., mouth, eyes), and through non-intact mucous membranes or skin (e.g., cuts, open wounds).17 The risk that healthcare workers may acquire the disease is related to the potential for percutaneous exposure or mucous membrane contact with contaminated body secretions. A major problem in controlling the spread of this disease is the fact that individuals infected with the virus are asymptomatic early in the disease while at the same time they are contagious. Thus, all blood samples must be treated as though infectious and handled with standard precautions.107 Standard precautions are new guidelines that include the major features of universal fluid precautions and body substance isolation procedures.107 Standard precautions are more comprehensive than universal precautions, which only account for bloodborne pathogens. Standard precautions address the transmission of all bloodborne pathogens.107 Both standard precautions and universal precautions are available through the Centers for Disease Control. Standard precautions require diligent handwashing and use of gloves when the hands are likely to come into contact with body secretions (e.g., during arterial blood gas sampling14). The Centers for Disease Control also recommends the use of masks and protective eyewear (to avoid contact with mucous membranes) if a procedure is likely to generate droplets of blood and aprons or gowns if blood is likely to be splashed during a procedure.19 Furthermore, needles must be handled carefully to prevent accidental puncture. Needle sticks are the most frequent source of transmission of bloodborne diseases in healthcare workers.19 20 Needles should not be purposely bent or broken by hand, removed from syringes, or manipulated by hand in any way. Specimen sampling devices in which the needle retracts after use or use of some other device to assure that inadvertent puncture cannot occur is essential. After use, needles should be placed in puncture-resistant containers that are located as close as is practical to the area where they are being used. Arterial blood samples must always be drawn only when the patient is in a steady state. The actual time required for the attainment of a steady state differs slightly with the patient’s pulmonary status. In patients free of overt pulmonary disease, a steady state is likely achieved in as few as 1 to 3 minutes1 21 and almost certainly within 10 minutes.22 23 In patients with chronic airway obstruction, up to 24 minutes after a change in therapy may be necessary.24 In clinical practice, a 20- to 30-minute waiting period is usually recommended before sampling arterial blood after a change in oxygen therapy or ventilation.1 15 25 As described previously, however, only 3 to 10 minutes is necessary to achieve steady-state conditions in the absence of pulmonary disease. Ideally, a patient who is breathing spontaneously should also be at rest for at least 5 minutes before sample acquisition.14 Likewise, temporary fluctuations in therapy also compromise steady-state conditions, which may occur if the patient removes his or her oxygen mask or must be suctioned for excessive pulmonary secretions. The clinician drawing the sample is responsible for ensuring that the patient is in a steady state before arterial puncture. When a sample is thought to represent non–steady-state conditions, a repeat puncture with related pain, risks, and cost is probably necessary. Worse yet, if the non–steady state goes unnoticed, incorrect or inappropriate therapy may be prescribed. Thus, before arterial puncture, the patient must be carefully assessed to ensure steady-state conditions. Samples drawn to assess response to exercise require special considerations. They are best drawn at peak exercise, however, samples drawn within 15 seconds of termination of exercise are acceptable.15 Outside this time range, samples may yield false-negative results for hypoxemia.15 Mild to moderate pain may accompany arterial puncture.26 The clinician should be aware that pain and anxiety associated with arterial sampling may in itself cause changes in ventilation that, in turn, alter blood gas results. Thus, the patient should be approached calmly with a quiet voice and reassurance to promote physical and mental comfort14; and the sample should be obtained as quickly as possible. Some suggest the use of numbing agents before the actual puncture26 and this issue is discussed later in this chapter. The clinician should also appreciate that some studies have shown considerable spontaneous variability in PaO2 in apparently stable patients.169 This variability may be as much as 10% and may be due to patient or machine issues.168 The important point here is that changes in PaO2 of as much as ±8 mm Hg should be viewed with skepticism because they are commonly a result of spontaneous variability. Specific information regarding identification of the sample and the date and time of acquisition is essential on the requisition slip. This information must include the patient’s full name and hospital or emergency room number. The blood vessel source should also be noted (i.e., arterial, venous, or mixed venous). Potential technical issues that may impact the quality of the sample should be noted as well. These might include issues such as improper storage of the sample or transportation delays. Other desirable information includes the location of the patient, working diagnosis, clinical indication, name of the physician requesting the sample, the initials of the individual who obtained the sample, and the sample site.14
Arterial Blood Gases
INTRODUCTION
NORMAL BLOOD GAS VALUES
Indices
pH
7.35–7.45
PaCO2
35–45 mm Hg
[BE]
0 ± 2 mEq/L
PaO2
80–100 mm Hg
[HCO3]
24 ± 2 mEq/L
SaO2
97%–98%
Oxygenation
Acid-Base Balance
Normal Ranges
Units of Measurement
cm H2O
mm Hg
kPa
1.0
0.736
0.098
1.359
1.0
0.133
10.197
7.501
1.0
ARTERIAL VERSUS VENOUS BLOOD
TECHNIQUE
Preparation and Pre-analytical Considerations
Status of Patients and Control of Infection
Anticoagulants/Bleeding Disorders
Infection Control
Steady State
Spontaneous Variability of PaO2
Documenting Current Status
Arterial Blood Gases
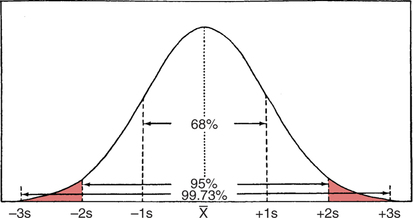
 ). Ninety-five percent of the population values fall within 2 standard deviations, and 99.73% fall within 3 standard deviations. Normal laboratory values are considered to be ±2 standard deviations from the mean.