IMPORTANT TOPICS
DISEASES ASSOCIATED WITH BRONCHIECTASIS
Allergic Bronchopulmonary Aspergillosis
Primary Ciliary Dyskinesia and Kartagener Syndrome
Familial Congenital Bronchiectasis (Williams-Campbell Syndrome)
Alpha-1-Antitrypsin Deficiency
Bronchiectasis Associated with Systemic Diseases
Histopathologic Classification of Bronchiolitis
Clinical and Etiologic Classification of Bronchiolitis
High-Resolution Computed Tomography Classification of Bronchiolitis
Abbreviations Used in This Chapter | |
ABPA | allergic bronchopulmonary aspergillosis |
AIDS | acquired immunodeficiency syndrome |
BAL | bronchoalveolar lavage |
B-AR | bronchoarterial ratio |
BMT | bone marrow transplantation |
BO | bronchiolitis obliterans |
BOS | bronchiolitis obliterans syndrome |
CB | constrictive bronchiolitis |
CF | cystic fibrosis |
COPD | chronic obstructive pulmonary disease |
CVID | common variable immunodeficiency syndrome |
DCS | dyskinetic cilia syndrome |
DPB | diffuse panbronchiolitis |
FEF | forced expiratory flow |
FEV1 | forced expiratory volume in 1 second |
FVC | forced vital capacity |
GVHD | graft-versus-host disease |
HIV | human immunodeficiency virus |
HP | hypersensitivity pneumonitis |
IA | internal area |
LA | lumen area |
LCH | Langerhans cell histiocytosis |
LIP | lymphoid interstitial pneumonia |
MAC | Mycobacterium avium complex |
MDCT | multidetector computed tomography |
MinIP | minimum-intensity projection |
MIP | maximum-intensity projection |
MPR | multiplanar reconstruction |
NFA | near-fatal asthma |
OP | organizing pneumonia |
PCD | primary ciliary dyskinesia |
PFT | pulmonary function test |
RA | rheumatoid arthritis |
RB | respiratory bronchiolitis |
RB-ILD | respiratory bronchiolitis-interstitial lung disease |
RV | residual volume |
SLE | systemic lupus erythematosus |
TA | total area |
TIB | tree-in-bud |
TLC | total lung capacity |
WA | wall area |
WT | wall thickness |
High-resolution computed tomography (HRCT) has revolutionized our understanding of airways diseases. HRCT not only allows direct, noninvasive visualization of structural changes involving large and medium-size bronchi (1–8), but also allows a previously unattainable insight into airway physiology (9–20). As important, it is now possible to differentiate among various causes of small airway disease using HRCT (20–27).
In this chapter, we review the HRCT diagnosis of large airway abnormalities specifically related to bronchiectasis, and abnormalities secondary to diseases primarily affecting the small airways.
BRONCHIECTASIS
Bronchiectasis is defined as localized, irreversible dilatation of the bronchial tree. Bronchiectasis has been associated with a wide variety of causes (Table 21-1), the most frequent of which is acute, chronic, or recurrent infection (28–30). Traditionally, bronchiectasis has been classified into three types, depending on the severity of bronchial dilatation. These three types are cylindrical, varicose, and cystic (31) (Figs. 21-1 to 21-7). A distinction among these three types of bronchiectasis is useful for descriptive purposes, sometimes helpful in diagnosis, and correlates with the severity of the anatomical and functional abnormality (32), however, their differentiation is generally less important clinically than is a determination of the underlying etiology and assessment of the overall extent and severity of disease. It is not uncommon for patients to show examples of more than one type of bronchiectasis (Figs. 21-4 and 21-8).
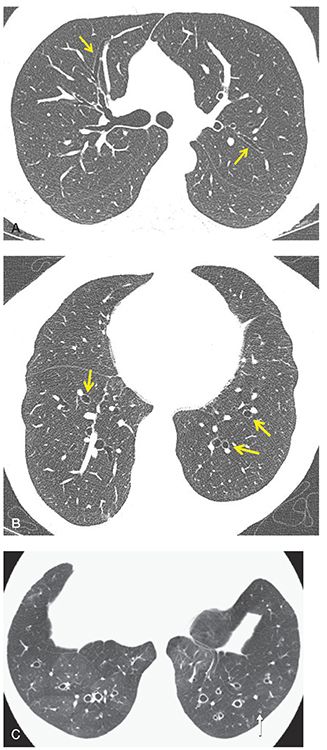
FIGURE 21-1 Cylindrical bronchiectasis. A: One-millimeter section through the carina shows lack of tapering of the upper lobe peripheral airways consistent with mild cylindrical bronchiectasis (arrows). B: One-millimeter section through the lung bases shows classic appearance of cylindrical bronchiectasis with peripherally dilated airways resulting in a “signet ring” appearance (arrows). C: One-millimeter axial image through the lower lobes in a different patient than in A and B shows cylindrical bronchiectasis with bronchial wall thickening. Note the visibility of a dilated and thick-walled airway within 1 cm of the visceral pleura (arrow), an important indicator of bronchial pathology. There is also evidence of mosaic perfusion, consistent with small airways disease and most apparent in the right lower lobe.
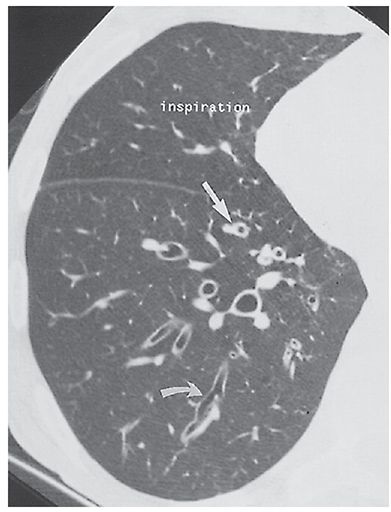
FIGURE 21-2 Varicose bronchiectasis. HRCT in a patient with ABPA shows an irregularly dilated and thick-walled bronchus (arrows) typical of varicose bronchiectasis.
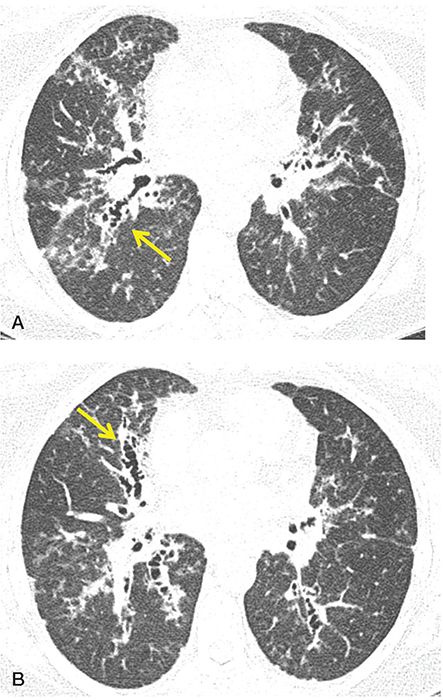
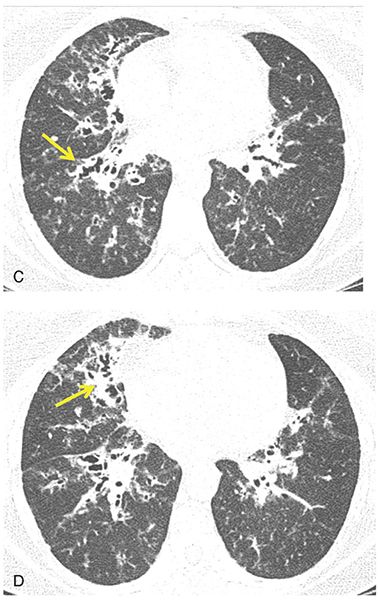
FIGURE 21-3 Varicose bronchiectasis. A–D: Sequential 1-mm sections through the upper, mid and lower lung zones, respectively, in a patient with CF showing a classic appearance of varicose bronchiectasis with bronchial wall thickening (arrows, A–D).
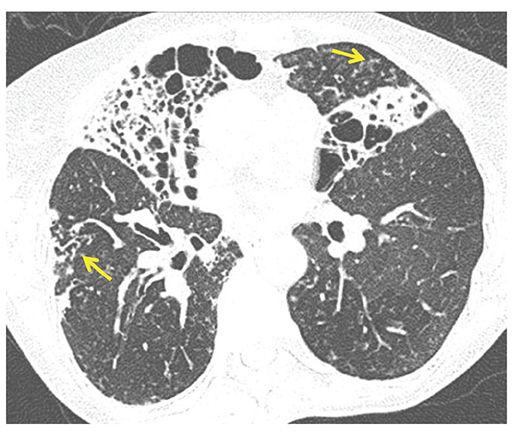
FIGURE 21-4 Varicose and cystic bronchiectasis. One-millimeter section through the mid-lung shows a combination of varicose and cystic bronchiectasis, nearly replacing the middle lobe and the inferior lingular segment. These abnormalities are due to atypical mycobacterial infection. In addition, note findings consistent with small airway inflammation, with foci of bronchiolectasis (arrow in right lower lobe) and centrilobular TIB opacities (arrow in lingula).
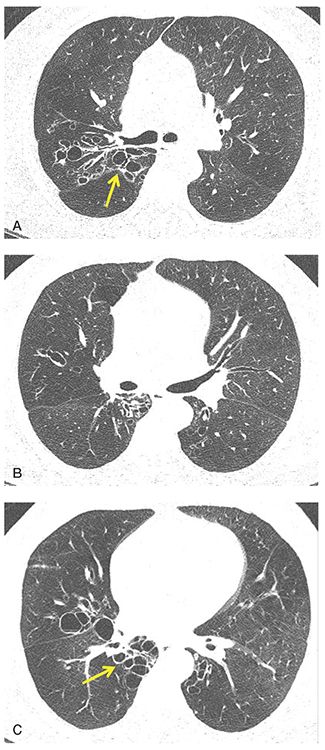
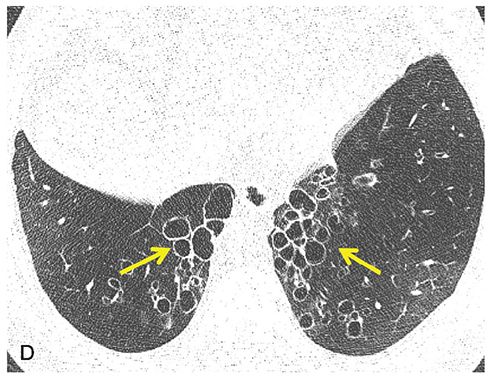
FIGURE 21-5 Cystic bronchiectasis. A–D: Sequential 1-mm sections through the mid and lower lungs show regions of cystic bronchiectasis (arrows), resulting in a classic cluster of grapes appearance. Note in this case that airway walls are thin and that there is also evidence of diffuse decrease in lung attenuation and diminished vascularity consistent with associated CB.
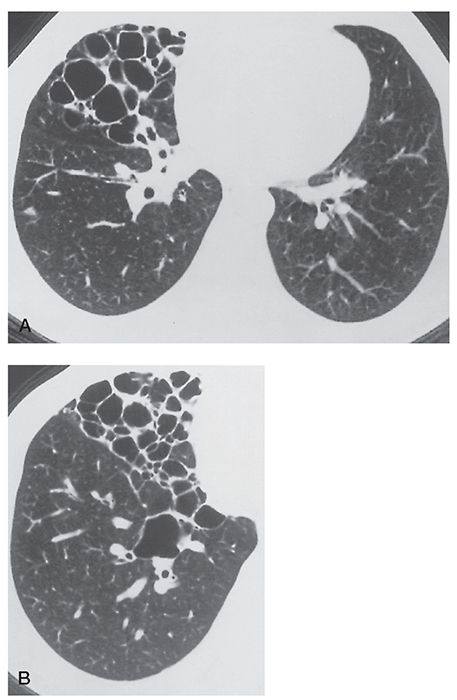
FIGURE 21-6 A and B: Cystic bronchiectasis largely limited to the right middle lobe in a patient with a history of tuberculosis.
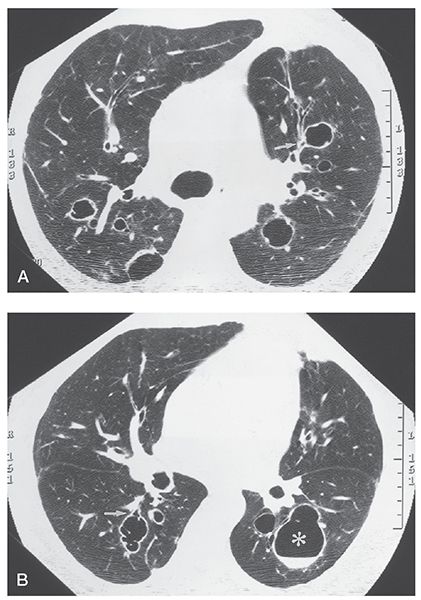
FIGURE 21-7 A and B: Cystic bronchiectasis. Sections through the carina and mid-lungs, respectively, show isolated foci of cystic bronchiectasis. Bronchi are dilated and thick walled. Note that some of these clearly communicate with proximal airways; others have clearly defined air-fluid levels (B, asterisk).
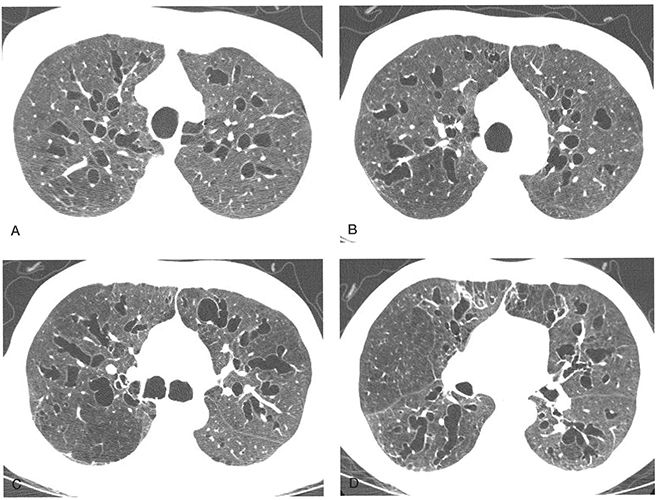
FIGURE 21-8 A–D: Extensive bronchiectasis in the Mounier-Kuhn syndrome. A–D: Sequential 1-mm sections show numerous dilated thin-walled airways with dilated airways showing features of cylindrical, varicose, and cystic bronchiectasis. Mild tracheomegaly is also present.
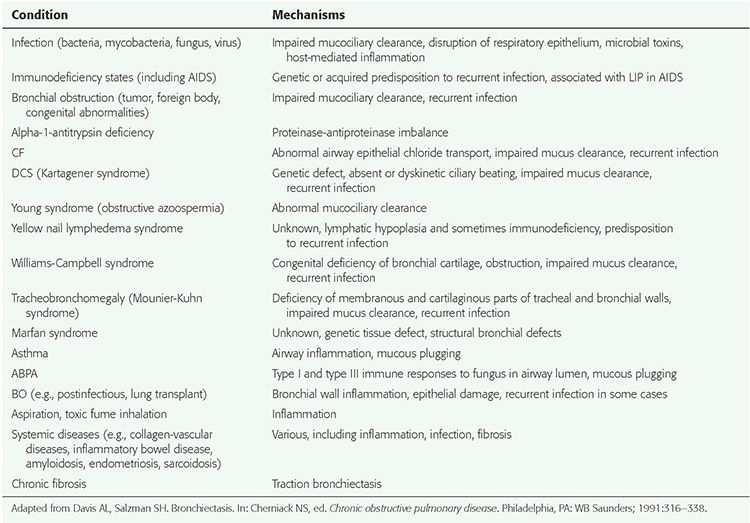
TABLE 21-1 Bronchiectasis-Associated Conditions and Possible Mechanisms
Although the prevalence of bronchiectasis in North America has been estimated to be 52.3 cases per 100,000 adults (33), the true prevalence remains uncertain (34). In fact, a dramatic increase in the prevalence of bronchiectasis has been reported, increasing by 8.7% between 2000 and 2007 based on a recent review of Medicare outpatient data (34). It is unclear whether this represents a true increase in the prevalence of bronchiectasis or is the result of improved diagnosis largely due to the widespread availability of HRCT (34). What is certain is that the prevalence of bronchiectasis changes with age with 4.2 cases per 100,000 reported among persons aged 18 to 34 years compared to 27.2 per 100,000 persons aged older than 75 years (35).
Bronchiectasis, by definition, represents destruction of the bronchial wall, resulting in its irreversible dilatation. Bronchiectasis has a number of causes, which usually have in common a repetitive cycle of inflammation, abnormal bronchial physiology, development of airway wall abnormalities, and chronic and recurrent infection (36). Bronchiectasis typically involves or is associated with chronic or severe bacterial infection, particularly by organisms resulting in tissue necrosis, such as Staphylococcus, Klebsiella, or Bordetella pertussis (29). Granulomatous infections, including those caused by Mycobacterium tuberculosis (37–39); atypical mycobacteria, especially Mycobacterium avium complex (MAC) (40–45); and fungal organisms such as histoplasmosis are also associated with bronchiectasis. Furthermore, bronchiectasis is often present in patients who have constrictive bronchiolitis (CB) (bronchiolitis obliterans [BO]) or the Swyer-James syndrome resulting from prior viral infection.
Bronchiectasis may occur in association with a variety of genetic abnormalities, especially those with abnormal mucociliary clearance, immune deficiency, or structural abnormalities of the bronchus or bronchial wall (Table 21-1) (46,47). In addition to cystic fibrosis (CF), causes of bronchiectasis having a genetic basis include alpha-1-antitrypsin deficiency; the dyskinetic cilia syndrome (DCS); Young syndrome; Williams-Campbell syndrome (congenital deficiency of bronchial cartilage); Mounier-Kuhn syndrome (congenital tracheobronchomegaly (Fig. 21-8); immunodeficiency syndromes, including hypogammaglobulinemia and common variable immunodeficiency syndrome (CVID); and the yellow nail syndrome (yellow nails, lymphedema, and pleural effusions). Chronic or recurrent infection is common in these conditions.
Noninfectious diseases that result in airway inflammation and mucous plugging can also result in bronchiectasis. These include allergic bronchopulmonary aspergillosis (ABPA) (48–51) and, to a lesser extent, asthma (52,53). Bronchiectasis may also occur in patients who have CB, regardless of its cause, but most often in association with chronic rejection after heart-lung or lung transplantation (54–62) or bone marrow transplantation (BMT), as a result of chronic rejection or chronic graft-versus-host disease (GVHD) (63). Additionally, bronchiectasis may occur in patients with inflammatory bowel disease (64).
Clinical Correlation
In general, a clinical diagnosis of bronchiectasis is possible only in the most severely affected patients, and differentiation from chronic bronchitis may be problematic (65). Most patients present with purulent sputum production and recurrent pulmonary infections (28,30,66). Hemoptysis is also frequent, occurring in up to 50% of cases, and may be the only clinical finding (30,67–69). Bronchitis, bronchiolitis, or emphysema frequently accompany bronchiectasis and may cause obstructive abnormalities on pulmonary function tests (PFTs). As discussed later in this chapter, and in Chapter 20, this has led to considerable interest in the use of quantitative CT to distinguish between different phenotypes in patients with chronic obstructive airways disease (COPD) and asthma (17,70).
In cases in which there is a clinical suspicion of bronchiectasis, in addition to routine chest radiographs and HRCT, a detailed clinical history and a number of specific diagnostic tests are recommended (71). This includes, in all cases, PFTs, sputum culture for bacterial, fungal, and mycobacterial species, and Aspergillus-specific IgG or IgE or skin testing.
In patients without a known etiology, additional tests of potential value include alpha-1-antitrypsin levels in patients with suspected emphysema, sweat chloride or CF mutation screening in younger individuals with concomitant sinus infections, ciliary biopsy in adults with infertility issues, swallowing studies to rule gastrointestinal reflux disease, and serologic tests to identify otherwise occult underlying collagen-vascular diseases. Although bronchoscopy is not routinely indicated, transbronchial biopsy can prove of value to diagnose atypical mycobacterial infections (71).
Radiographic Findings
The radiographic manifestations of bronchiectasis have been well described (72). These include a loss of definition of vascular markings in affected lung segments, presumably secondary to peribronchial fibrosis and volume loss; evidence of bronchial wall thickening; and, in more severely affected cases, the presence of discrete cysts occasionally containing air-fluid levels. It should be emphasized that most of these findings are nonspecific; a definitive radiographic diagnosis of bronchiectasis is generally considered difficult to make, except in the most advanced cases (73).
CT Diagnosis: Visual Interpretation
Bronchiectasis results in characteristic direct and indirect HRCT findings (Table 21-2) (4,15,74,75). Direct findings include morphologic abnormalities associated with bronchial dilatation, typically described as cylindrical (Fig. 21-1), varicose (Fig. 21-4), or cystic (Figs. 21-4 to 21-7); lack of bronchial tapering (Figs. 21-1 and 21-4); and visibility of airways in the peripheral lung zones (Figs. 21-1 and 21-4).
TABLE 21-2 HRCT Findings in Bronchiectasis
Direct signs |
Bronchial dilatationa,b |
Internal diameter greater than adjacent pulmonary arterya,b |
Contour abnormalitiesa,b |
Signet ring sign (vertically oriented bronchi) |
Tram tracks (horizontally oriented bronchi) |
Varicose appearance |
Air-filled cysts, sometimes containing fluid |
Lack of tapering greater than 2 cm distal to bifurcationb |
Visibility of peripheral airwaysa,b |
Within 1 cm of the costal pleuraa,b |
Touching the mediastinal pleuraa,b |
Indirect signs |
Bronchial wall thickeninga,b |
Fluid- or mucus-filled bronchia,b |
Tubular or Y-shaped structuresa,b |
Branching or rounded opacities in cross sectiona,b |
Air-fluid levelsb |
Mosaic perfusiona |
Centrilobular nodules or TIBa |
Atelectasis/consolidationa |
Air trapping on expiratory scansa |
Interlobular septal thickening |
aMost common findings.
bFindings most helpful in differential diagnosis.
Indirect signs include bronchial wall thickening and irregularity, the presence of mucous impaction of the bronchial lumen, bronchiolectasis, and tree-in-bud (TIB) opacities. Ancillary signs have also been described and include mosaic perfusion visible on inspiratory scans, focal air trapping identifiable on expiratory scans (76), tracheomegaly, bronchial artery enlargement, emphysema, and interlobular septal thickening (77). A combination of these findings enables an accurate diagnosis of bronchiectasis in a large percentage of cases (Table 21-2).
Bronchial Dilatation
Because bronchiectasis is defined by the presence of bronchial dilatation, recognition of increased bronchial diameter is a key to the HRCT diagnosis. As discussed in greater detail later in this chapter, various sophisticated methods for measuring airway dimensions have been proposed. Although these approaches may allow precise quantitative assessment of airways and may prove particularly valuable in physiologic studies, subjective visual criteria for establishing the presence of bronchial dilatation remain the standard for interpretation (4,52,78–81).
For the purposes of the interpretation of HRCT, bronchial dilatation may be diagnosed by (a) a comparison between internal bronchial diameter and that of the adjacent pulmonary artery branch (i.e., by measuring the bronchoarterial ratio [B-AR]), (b) lack of bronchial tapering, and (c) visible airways in the peripheral lung.
Bronchoarterial Ratio
In most cases, bronchiectasis is considered to be present when the internal diameter of a bronchus is greater than the diameter of the adjacent pulmonary artery branch—that is, if the B-AR is greater than 1 (Figs. 21-1 to 21-3, 21-9, and 21-10) (82). The accuracy of this finding in diagnosing bronchiectasis has been validated in a number of studies comparing CT to bronchography in patients who have bronchiectasis (83–86). In patients who have bronchiectasis, the bronchial diameter is often much larger than the pulmonary artery diameter (i.e., the B-AR exceeds 1.5), a finding that reflects not only the presence of bronchial dilatation but also some reduction in pulmonary artery size as a consequence of decreased lung perfusion in affected lung regions (79). The association of a dilated bronchus with a much smaller adjacent pulmonary artery branch has been termed the signet ring sign (Fig. 21-1). This sign is valuable in recognizing bronchiectasis and in distinguishing it from other cystic lung lesions.
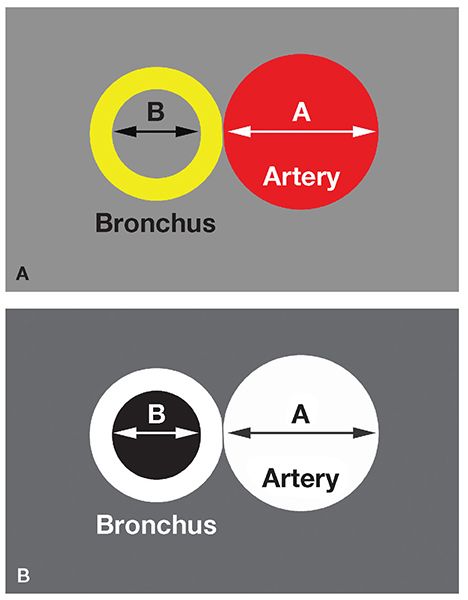
FIGURE 21-9 Measurement of B-ARs. A and B: The B-AR represents the ratio of the internal bronchial diameter to the diameter of the adjacent artery. B shows its appearance on CT.
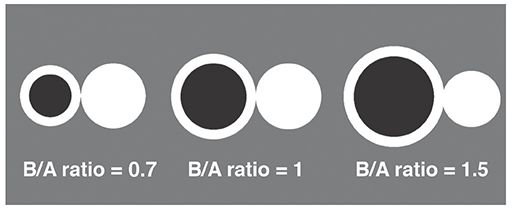
FIGURE 21-10 Normal and abnormal B-ARs. A normal B-AR averages 0.65 to 0.7 in young or middle-age patients. A B-AR of 1 or more may be seen in some normal subjects older than 65 years or in patients living at high altitude. True bronchiectasis is usually associated with a B-AR greater than 1.5.
Although an increased B-AR is typical of bronchiectasis, a B-AR greater than 1 is not invariably indicative of bronchiectasis (4,52,79). There are a number of instances in which airways may appear dilated in the absence of wall destruction, although this dilatation is usually minimal. This finding has been reported in asthmatic patients (49,52,87), in patients living at high altitudes (52,79), and in a small percentage of normal subjects (88). For example, in an HRCT evaluation of 14 normal subjects (89), although the B-AR averaged 0.65 ± 0.16, 7% of interpretations showed some evidence of bronchial dilatation. Kim et al. (79) found that 9 of 17 (53%) normal subjects living at an altitude of 1,600 m had evidence of at least one bronchus equal to or larger in size than the adjacent pulmonary artery. These authors also found that 2 of 16 (12.5%) individuals living at sea level showed evidence of at least one abnormally dilated airway.
Similarly, Lynch et al. (52) compared the internal diameters of lobular, segmental, subsegmental, and smaller bronchi to those of adjacent pulmonary artery branches in 27 normal subjects living in Denver. The authors found that 37 of 142 (26%) bronchi evaluated and 59% of individuals had increased B-ARs. Assessment of the distribution of these dilated airways has failed to identify any significant difference in the likelihood of an abnormal B-AR in airways categorized by lobe or anteroposterior location within the lungs (79). A similar lack of variation by segments, lobes, or lungs has been reported by Kim et al. (80).
Consequently, bronchiectasis should be diagnosed with caution on the basis of an increased B-AR alone, unless the increase is marked. In one study (52) of normal subjects and asthmatics, although B-ARs of greater than 1 were frequently seen in both groups, in no patient was the B-AR greater than 1.5 (90). An additional finding, helpful in distinguishing true bronchiectasis from normals, is bronchial wall thickening. Bronchial wall thickening is frequently seen in association with bronchial dilatation in patients who have bronchiectasis, as are irregularities in bronchial diameter and lack of bronchial tapering. In the normal subjects studied by Lynch et al. (52) who demonstrated an increased B-AR, bronchial wall thickening was uncommon, and it is unlikely that any of the subjects in this study would have been diagnosed on clinical HRCT studies as having true bronchiectasis.
Similar confounding results may be seen in normal older individuals. As reported by Matsuoka et al. (91) in a prospective study of 85 asymptomatic, healthy patients without cardiopulmonary disease, significant correlation was found between age and the B-AR (r = 0.768, p < 0.0001), defined as the diameter of the bronchial lumen divided by the diameter of its accompanying pulmonary artery, with the B-AR exceeding 1 in 41% of subjects older than 65 years.
As emphasized by Kim et al. (79), visual inspection alone may lead to an overestimation of B-AR due to a subtle optical illusion, in which the diameter of hollow circles appears larger than solid circles despite their being identical in size. Considerable variation in B-AR may also be seen in normal individuals. In a study by Kim et al. (80), the arterobronchus ratio, defined as the outer diameter of the pulmonary artery divided by the outer diameter of its accompanying bronchus measured at the subsegmental level, averaged 0.98 ± 0.14 but ranged from 0.53 to 1.39.
Despite variability in normal bronchial size and the methods by which bronchial diameter has been assessed, several studies have shown that measurements of bronchial diameter may be reliably made from HRCT (92,93). As emphasized by Diederich et al. (78), visual inspection remains the mainstay for assessing bronchial dilatation because obtaining objective measurements (with or without the use of calipers) is time consuming and often clinically impractical. In this regard, use of visual inspection has been shown to have acceptable interobserver variability. Using visual inspection only, Diederich et al. (78) found close agreement among three readers in both the detection (k = 0.78) and assessment of the severity (k = 0.68) of bronchiectasis. Similar results showing good interobserver correlation have been noted more recently in studies comparing various HRCT global scoring systems (94).
A potential limitation of the use of B-ARs is the necessity of identifying both airways and accompanying arteries. This may not always be possible in patients who have coexisting parenchymal consolidation (4). Kang et al. (4) were unable to determine the B-ARs in three cases in a study of 47 resected lobes with documented bronchiectasis due to the presence of parenchymal consolidation.
Lack of Bronchial Tapering
Lack of bronchial tapering is an important finding in the diagnosis of subtle cylindrical bronchiectasis (Table 21-2, Fig. 21-1). It has been suggested that for this finding to be present, the diameter of an airway should remain unchanged for at least 2 cm distal to a branching point (79). First emphasized by Lynch et al. (52) as a necessary finding for diagnosis, lack of bronchial tapering has been reported by some to be the most sensitive means for diagnosing bronchiectasis. Kang et al. (4), for example, in an assessment of 47 lobes with pathologically proved bronchiectasis, found lack of tapering of bronchial lumina in 37 (79%) cases as compared with increased B-ARs seen in only 28 (60%) cases. In another study (88), lack of tapering of bronchi was seen in 10% of HRCT interpretations in healthy subjects, compared with 95% of reviews in patients who had bronchiectasis. It should be emphasized that the accurate detection of this finding is difficult in the absence of contiguous HRCT sections, especially for vertically or obliquely oriented airways. The value of this sign is doubtful when HRCT scans are obtained at spaced intervals in a noncontiguous fashion, a problem readily rectified when volumetric studies are performed with multidetector computed tomography (MDCT) scanners. This includes the ability to retrospectively reconstruct contiguous, high-resolution images as needed to clarify suspect regions of interest.
Visible Peripheral Airways
Visibility of airways in the lung periphery is a finding of bronchiectasis (Table 21-2, Figs. 21-1 and 21-4) (4,88). The smallest airways normally visible using HRCT techniques have a diameter of approximately 2 mm and a wall thickness of 0.2 to 0.3 mm (95); in normal subjects, airways in the peripheral 2 cm of lung are uncommonly seen because their walls are too thin (96). Peribronchial fibrosis and bronchial wall thickening in patients who have bronchiectasis, in combination with dilatation of the bronchial lumen, allow the visualization of small airways in the lung periphery, and this finding can be very helpful in diagnosing the presence of an airway abnormality. In a study by Kang et al. (4), bronchi visualized within 1 cm of pleura were seen in 21 of 47 (45%) bronchiectatic lobes.
Bronchial Wall Thickening
Although bronchial wall thickening is a nonspecific, potentially reversible, abnormality, it is frequently identified in patients who have bronchiectasis (Table 21-2, Figs. 21-11 to 21-13), and it is usually present in patients with symptoms. Identification of thickened bronchial walls, for the purposes of interpretation of clinical scans, remains largely subjective (4,49). Because bronchiectasis and bronchial wall thickening are often patchy and multifocal rather than diffuse and uniform, a comparison of bronchi in one lung region to those in another can be helpful in making this diagnosis (Fig. 21-11). Using consistent window settings is very important in the diagnosis of bronchial wall thickening because bronchial walls can vary significantly in apparent thickness with different CT window settings (see Chapter 1). Although estimates of airway wall thickening are subjective, visual assessment of wall thickening may be reliable when sequential scans are assessed. Using a visual estimation of wall thickness, Diederich et al. (78) found acceptable levels of agreement among three readers as to the presence or absence of bronchial wall thickening (k = 0.64).
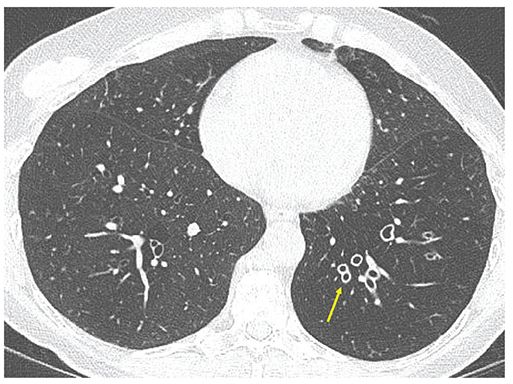
FIGURE 21-11 Bronchial wall thickening. One-millimeter section through the lower lobes shows markedly thickened airway walls asymmetrically involving the left lower lobe (arrow). Note associated diminished lung density and vascularity in the left lower lobe consistent with associated diffuse air trapping/obstructive small airway disease. Visual identification of abnormal airway wall thickening is made easier by noting markedly asymmetrical distribution.
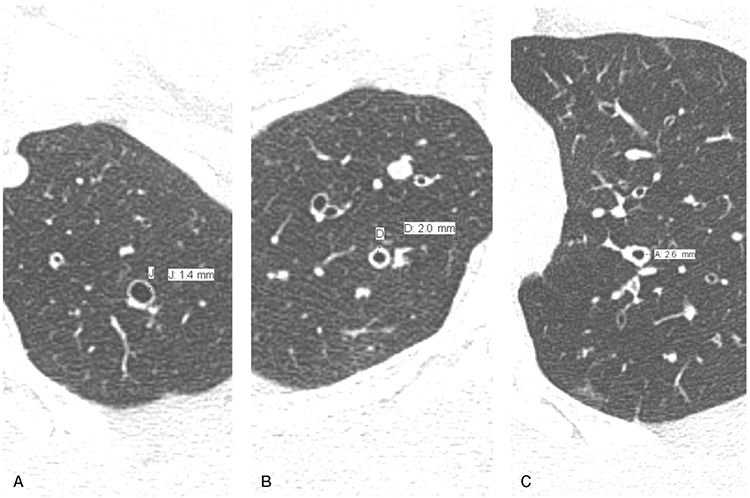
FIGURE 21-12 Bronchial wall thickening. A–C: Sequential 1-mm sections through the left apex, right upper, and left upper lobes, respectively, in the same patient with diffuse bronchiectasis showing the visual range in appearance of abnormal bronchial wall thickening with walls measuring 1.4, 2.0, and 2.6 mm, respectively. In most cases, identification of bronchial wall thickening is subjective, depending on visual interpretation rather than quantitative evaluation.
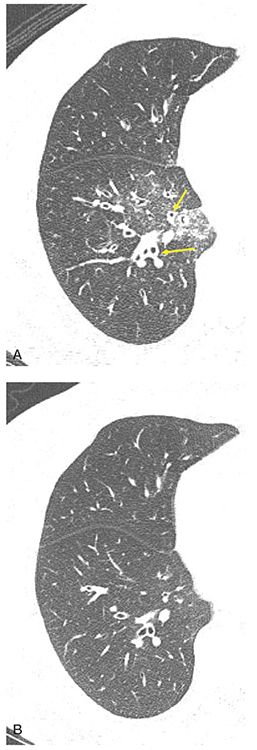
FIGURE 21-13 Reversible bronchial wall thickening associated with inflammation. A and B: One-millimeter targeted reconstructions through the right lower lobe pre- and post-antibiotic therapy, respectively, in a patient with acute airway inflammation. Note that bronchial wall thickening (arrows in A) may be reversible disease and should not, in itself, be assumed indicative of true bronchiectasis, defined as irreversible bronchial wall destruction. Note associated focal ground-glass opacity in the medial aspect of the right lower lobe in A consistent with parenchymal inflammation. (From Bonavita J, Naidich DP. Imaging of bronchiectasis. Clin Chest Med 2012;33:233–248.)
Quantitation of bronchial wall thickness is discussed further in Chapter 2 and in what follows.
Mucoid Impaction and Tree-in-Bud
The presence of mucus- or fluid-filled bronchi may be helpful in confirming a diagnosis of bronchiectasis (96a) (Table 21-2). CF and ABPA are common causes. The HRCT appearance of mucus- or fluid-filled bronchi depends on the size and orientation of abnormal bronchi relative to the scan plane. Large mucus-filled airways result in the appearance of Y-shaped branching opacities, when they lie in the same plane as the CT scan (Figs. 21-14 to 21-18). Although branching opacities may be confused with abnormally dilated vessels, in most cases, their recognition is simplified by the identification of other air-filled dilated bronchi (i.e., bronchiectasis) in other lung regions. In problematic cases, a distinction between large fluid-filled bronchi and dilated blood vessels is easily made by scanning the patient after contrast infusion. Multiplanar and maximum-intensity projection (MIP) images in a variety of imaging planes may also be used for further evaluation.
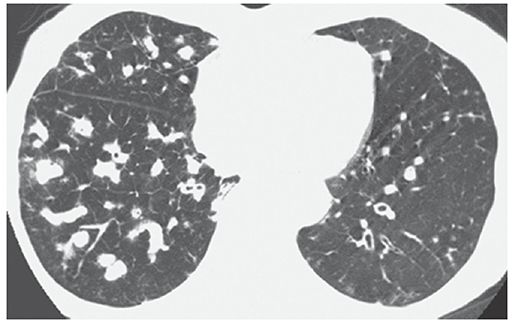
FIGURE 21-14 Bronchiectasis with mucoid impaction. HRCT shows extensive mucous impaction throughout the middle and right lower lobes appearing as multiple branching opacities. Note the paucity of visualized air-filled bronchi in the right lower lobe. Bronchiectasis is visible in the left lower lobe.
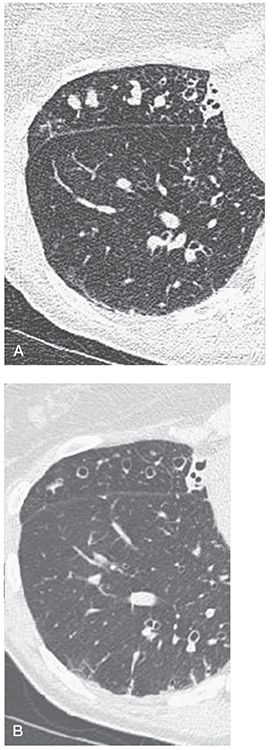
FIGURE 21-15 Bronchiectasis with mucoid impaction. A: Target-reconstructed 1-mm section through the base of the middle lobe shows multiple nodules, some with a subtle branching configuration. Note also the presence of dilated air-filled bronchi. B: Follow-up, magnified, 5-mm section at the same level as shown in A following antibiotic therapy now shows that the nodular opacities seen in A represented mucous-filled peripheral airways. (From Naidich DP, Webb WR, Müller NL, et al. Computed tomography and magnetic resonance of the thorax. 4th ed. Philadelphia, PA: Lippincott Williams & Wilkins; 2007.)
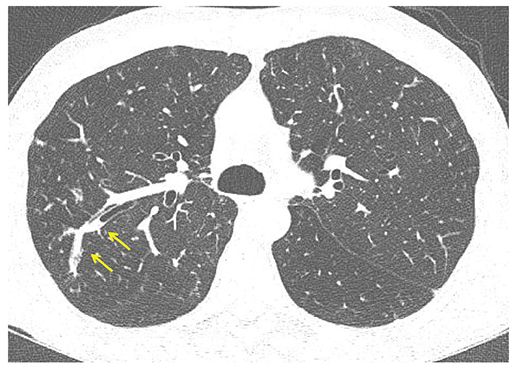
FIGURE 21-16 Focal mucoid impaction. One-millimeter section through the right upper lobe shows a dilated, branching peripheral bronchus with retained intraluminal secretions, characteristic of mucoid impaction (arrows).
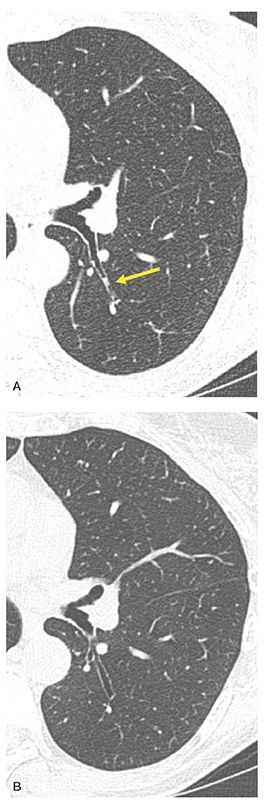
FIGURE 21-17 Retained secretions leading to focal cylindrical bronchiectasis. A: Target-reconstructed 1-mm section through the superior segment of the left lower lobe. Focal retained secretions are apparent in the proximal superior segmental bronchus (arrow in A). B: Subsequent follow-up image acquired at the same level as A shows focal cylindrical bronchiectasis in this same segment. Close monitoring of disease progression when small peripheral airways are involved preferentially requires acquisition of contiguous 1-mm images for optimal resolution.
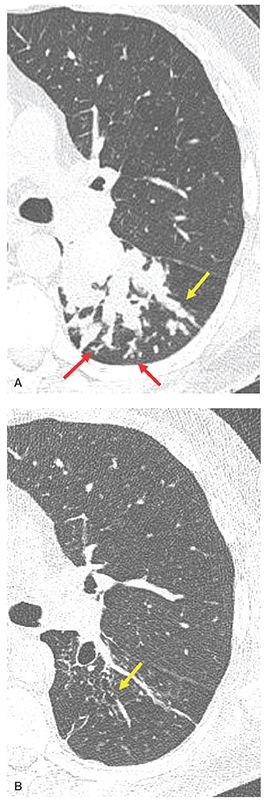
FIGURE 21-18 Focal mucoid impaction in ABPA. A: Targeted reconstruction through the superior segment of the left lower lobe shows extensive mucoid impaction identifiable as tubular (yellow arrow) and branching opacities extending into the peripheral lung. Examples of TIB are visible in the subpleural lung (red arrows). B: Follow-up image obtained at the same level following antifungal therapy and bronchial lavage shows resolution of the mucous plugs and evidence of varicose bronchiectasis (yellow arrow).
Mucus- or pus-filled small airways in the lung periphery are usually identifiable either as branching structures within the center of secondary lobules, aptly described as having a TIB appearance (38,97), or as ill-defined centrilobular nodules (27,98) corresponding to abnormalities of distal airways (Figs. 21-4, 21-18, and 21-19) (98–101). These are described and illustrated in detail later in this chapter.
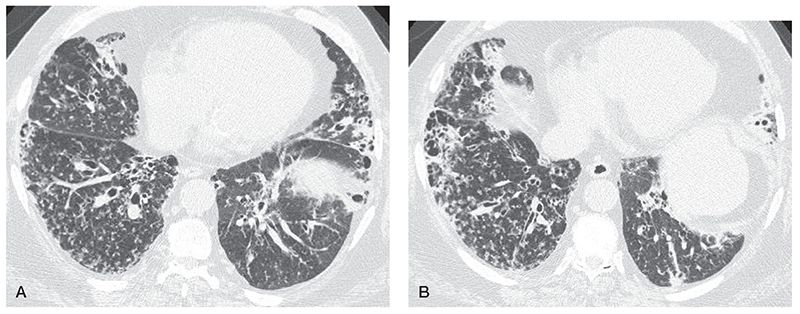
FIGURE 21-19 MAC infection in a 64-year-old man, with bronchiectasis, TIB opacities, and centrilobular nodules. A and B: HRCT shows extensive bronchiectasis in the right middle lobe, lingual, and lower lobes, small centrilobular nodules, and TIB opacities.
Although commonly associated with bronchiectasis and infection, dilated mucus-filled bronchi in the central lung regions can also be seen in congenital bronchial abnormalities, such as bronchopulmonary sequestration or bronchial atresia (102–106, 106a).
Dilated mucus-filled airways, especially when central or predominantly segmental or lobular in distribution, should alert one to the possibility of a central endobronchial obstruction, resulting from either benign or malignant tumor or foreign body aspiration. Tumors that may result in bronchial obstruction and mucoid impaction include bronchogenic carcinoma, carcinoid tumor, endobronchial metastases, and uncommonly tracheobronchial papillomatosis.
Focal mucoid impaction may result of foreign body aspiration or broncholithiasis (107). Isolated foci of mucoid impaction may be identified without an apparent underlying etiology, in patients with acute or chronic bronchitis of any cause.
Mosaic Attenuation/Perfusion and Air Trapping
It is now well documented that patients who have bronchiectasis also show evidence of small airway pathology. Kang et al. (4), for example, in their study of 47 resected lobes with documented bronchiectasis, found pathologic evidence of bronchiolitis in 85%. These included 6 lobes with obliterative bronchiolitis, 18 with inflammatory or suppurative bronchiolitis, and 16 with both obliterative and inflammatory bronchiolitis. HRCT findings consistent with bronchiolitis were identified in 30 of 47 (75%) lobes, including a pattern of centrilobular nodular or branching opacities (i.e., TIB), or both (n = 10) (Figs. 21-18 and 21-19), bronchiolectasis (n = 17), and mosaic perfusion (n = 21) (Figs. 21-20 to 21-22) (4).
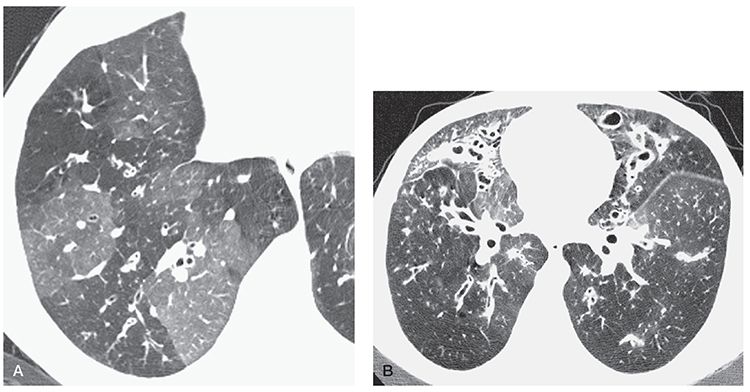
FIGURE 21-20 Bronchiectasis with mosaic perfusion. A: Patchy mosaic perfusion in CF. Geographic regions of decreased lung attenuation in the right lower lobe are the result of small airway obstruction, poor ventilation, and reflex vasoconstriction. Lucent lung regions contain smaller vessels than dense lung regions. This is diagnostic of mosaic perfusion. Bronchial wall thickening is also visible. B: At a higher level in this patient, bronchiectasis, mucous plugging, and mosaic perfusion are visible.
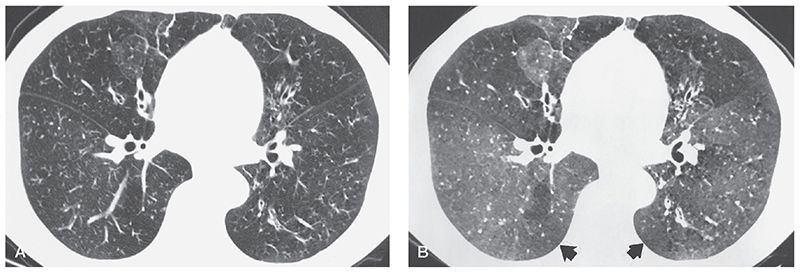
FIGURE 21-21 Mosaic perfusion in bronchiectasis and bronchiolitis: assessment with MinIP images. A: HRCT section through the mid-lungs shows evidence of mild bronchial dilatation and subtle mosaic perfusion in this patient who has known obliterative bronchiolitis. B: Corresponding MinIP image using five contiguous 1-mm sections shows to better advantage the extent of mosaic perfusion (arrows).
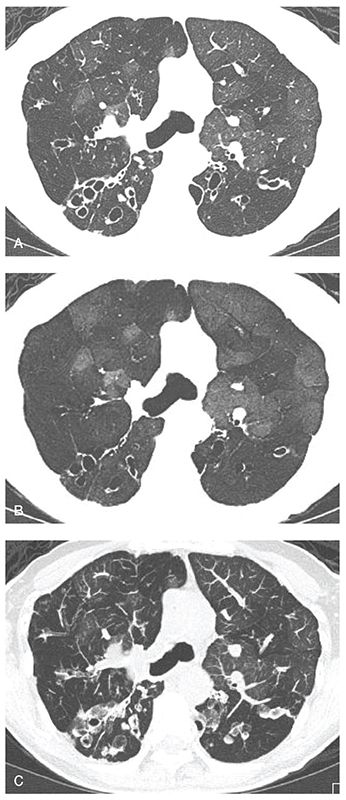
FIGURE 21-22 CF with bronchiectasis and mosaic perfusion: MinIP and MIP images. A: Routine 1-mm section through the carina. Note that in this case there is patchy mosaic perfusion secondary to underlying obstructive small airway disease and bronchiectasis. B and C: The extent and severity of geographic foci of mosaic attenuation are more clearly delineated on the MinIP image (B), while alterations in the lung vasculature and bronchial abnormalities are best seen on the MIP image (C). (From Bonavita J, Naidich DP. Imaging of bronchiectasis. Clin Chest Med 2012;33:233–248.)
Although quantitative methods for assessing the extent and severity of air trapping have been reported (108,109), identification of air trapping is nearly always based on a visual inspection. In particular, the findings of mosaic perfusion on inspiratory scans and focal air trapping on expiratory scans may prove of special interest in the early diagnosis of bronchiolitis associated with large airways disease (Table 21-2). In one study of 70 patients (110) who had HRCT evidence of bronchiectasis visible in 52% of lobes evaluated, areas of decreased attenuation were visible on inspiratory scans in 20% of lobes and on expiration (air trapping) in 34%. Although areas of decreased attenuation on expiratory scans were more prevalent in lobes with severe (59%) or localized (28%) bronchiectasis, in 17% of lobes, air trapping was identified in the absence of associated bronchiectasis. This has led to speculation that evidence of bronchiolar disease may in fact precede and even lead to the development of bronchiectasis (110,111). A similar observation regarding air trapping as an early sign of infection has also been noted in infants and children with CF (112).
The presence of decreased attenuation on expiratory scans has also been associated with mucous impaction. As noted by Hansell et al. (110), this finding was seen in 73% of lobes with large mucous plugs and in 58% of those with centrilobular mucous plugs. These same authors noted a correlation (r = 0.40, p < 0.001) between the total extent and severity of bronchiectasis and the extent of decreased attenuation shown on expiratory CT. Not surprisingly, in 55 patients who had PFTs, the extent of expiratory attenuation abnormalities proved inversely related to measures of airway obstruction, such as forced expiratory volume in 1 second (FEV1) and FEV1/forced vital capacity (FVC) (110).
It is worth emphasizing that HRCT evidence of mild, focal air trapping may be seen in normal individuals, in one study occurring in greater than 5 lobes in 5 of 70 (7%) individuals, with segmental air trapping identified in 3 (4%) cases, respectively (109).
Associated Vascular Abnormalities
Bronchial Artery Hypertrophy. Normal bronchial arteries extend along the central airways to a level a few generations proximal to the terminal bronchioles and are the main blood supply for the bronchi. Arising directly from the proximal descending thoracic aorta, these typically measure less than 2 mm and, in addition to supplying the central airways, supply blood to the esophagus and mediastinal lymph nodes. Enlarged bronchial arteries can be identified pathologically in most cases of bronchiectasis and, when severe, usually account for the occurrence of hemoptysis in these patients. With HRCT, it has proved possible to identify both normal and abnormal bronchial arteries in select cases, especially after a bolus of intravenous contrast (Figs. 21-23 and 21-34) (113,114).
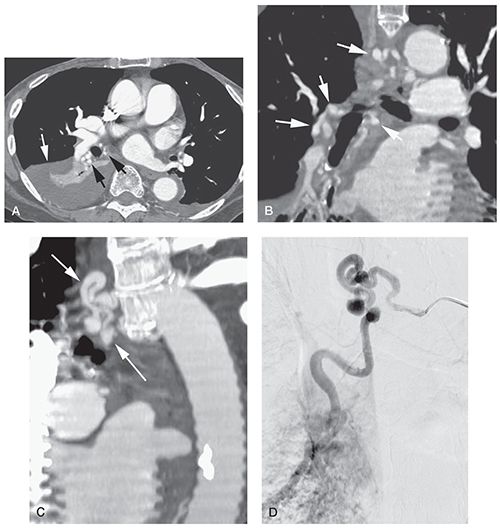
FIGURE 21-23 Bronchial artery enlargement in bronchiectasis. A: Multidetector CT (1.25-mm slice thickness) during contrast infusion in a patient with hemoptysis. Right lower lobe collapse and consolidation (white arrow) is the result of bronchiectasis. There is marked enlargement of bronchial arteries in the hilum (black arrows). B: Reconstruction in the coronal plane shows enlargement of bronchial arteries in the hilum and mediastinum (arrows). C: Oblique reconstruction shows the enlarged mediastinal bronchial artery (arrows). D: Arteriogram in the same plane as C shows bronchial artery enlargement. The bronchial artery was embolized for treatment of the patient’s hemoptysis. (From Naidich DP, Webb WR, Grenier PA, et al. Imaging of the airways: functional and radiologic correlations. Philadelphia, PA: Lippincott Williams & Wilkins; 2005.)
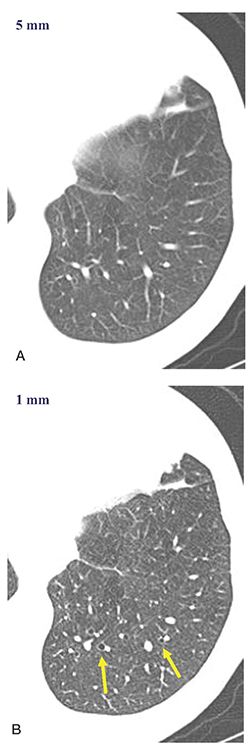
FIGURE 21-24 CT technique: 5- versus 1-mm sections. A and B: Five- and one-millimeter target-reconstructed images, respectively, through the left lower lobe. Note that mildly dilated airways identifiable in B (arrows) are more difficult to definitively identify in A. Accurate evaluation of the peripheral airways is best accomplished with contiguous 1-mm sections.
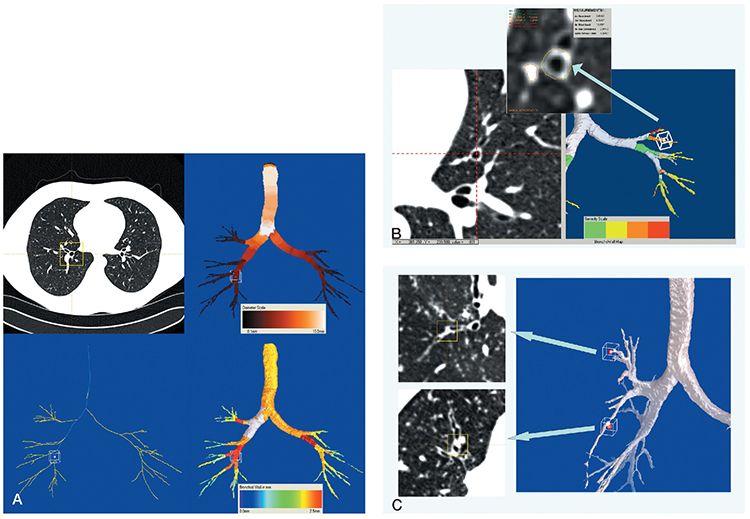
FIGURE 21-25 Automated airway segmentation. A: Images derived from a 64 MDCT volumetric data set with 0.75-mm sections reconstructed every 0.5 mm in a patient with normal airways. Using an adaptive region growing-based algorithm, it is possible to automatically extract center lines through all visualized airways (airway map, lower left corner). Subsequent evaluation allows automatic determination of a variety of measurements throughout the airway tree, including segment lengths, branch angles, regional luminal areas, and, as illustrated in this case, airway diameters (airway map, upper right corner) and wall thickness (airway map, lower right corner). B: Bronchial wall thickness. Coned-down view from a different patient than A, with mild diffuse cylindrical bronchiectasis, imaged with the same technical parameters. In this case, as shown on the right side of the figure, the entire airway tree is color coded to reflect the severity of bronchial wall thickening. As illustrated on the right side, in addition to providing a means for global scoring, it is also possible to obtain detailed measurements of select airways, in this case including the inner and outer diameter and wall thickness of single subsegmental bronchus. C: Mucous plug detection. Using data from the same case illustrated in B, it is also possible to automatically identify foci of mucous impaction, in this case identified in the 3D segmented image on the right by red dots at the tips of involved airways. Similar to B, it is then possible to evaluate each airway individually in real time to confirm the presence of mucous impaction (axial images displayed on the left ).
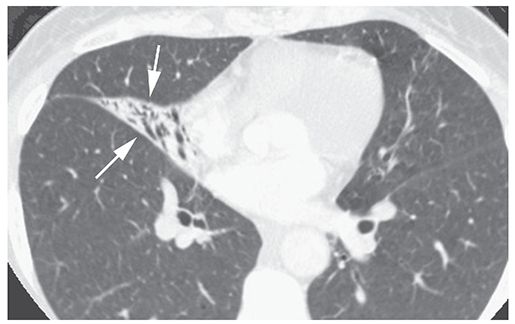
FIGURE 21-26 “Reversible bronchiectasis” in a patient with middle lobe atelectasis. The collapsed middle lobe (arrows) outlines dilated and air-filled bronchi. In patients with atelectasis, apparent bronchial dilatation may disappear following re-expansion. (From Naidich DP, Webb WR, Grenier PA, et al. Imaging of the airways: functional and radiologic correlations. Philadelphia, PA: Lippincott Williams & Wilkins; 2005.)
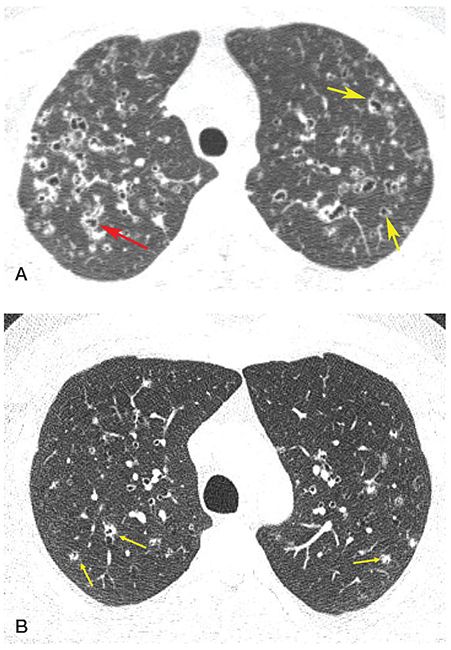
FIGURE 21-27 Pitfalls in the diagnosis of bronchiectasis: LCH. A: HRCT shows thick-walled cystic lesions, some of which are associated with vessels, appearing to represent the signet ring sign (yellow arrows), while others branch (red arrow). B: In another patient, 1-mm section through the upper lobes shows numerous poorly marginated centrilobular nodules, many with central lucencies representing a combination of dilated airways and early cavitation (arrows). This appearance may be confused with subtle bronchiectasis.
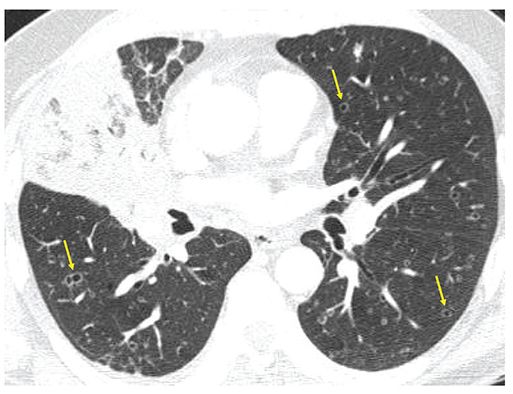
FIGURE 21-28 Pitfall in the diagnosis of bronchiectasis: Metastatic adenocarcinoma. One-millimeter section though the mid-lung shows obstruction of the middle lobe bronchus due to adenocarcinoma. There are numerous bilateral thin-walled cavitary lesions that superficially mimic peripherally dilated airways. Note that these do not have accompanying pulmonary arterial branches, helping to identify these as cavitary metastases (arrows).
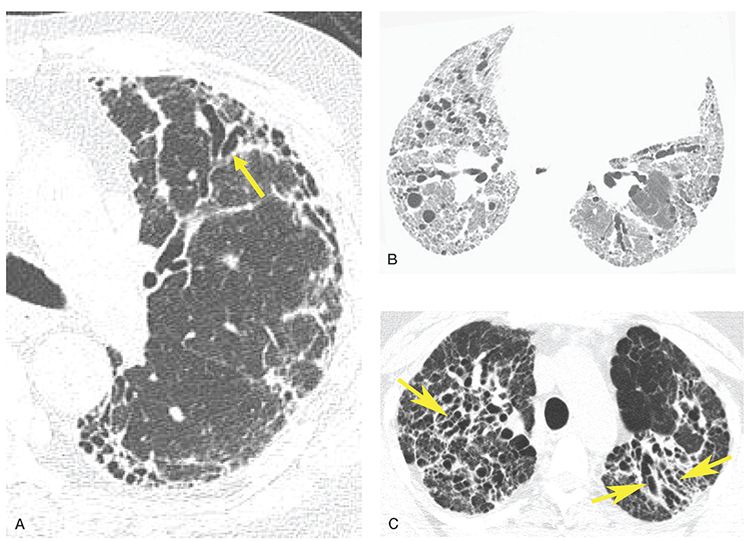
FIGURE 21-29 Pitfalls in the diagnosis of bronchiectasis: traction bronchiectasis. A: One-millimeter image in a patient with usual interstitial pneumonia shows evidence of diffuse lung fibrosis with extensive subpleural reticulation and honeycombing. Note that the peripheral airways are dilated (arrow), slightly irregular and extend nearly to the pleural surface. This appearance is secondary to peribronchial fibrosis with subsequent bronchial dilatation and should not be confused with true bronchiectasis. B: A patient with lung fibrosis shows extensive reticulation and traction bronchiectasis. Bronchi are irregularly dilated bronchi and some are “cork-screw” in appearance. C: End-stage sarcoidosis with perihilar fibrosis and associated traction bronchiectasis (arrows).
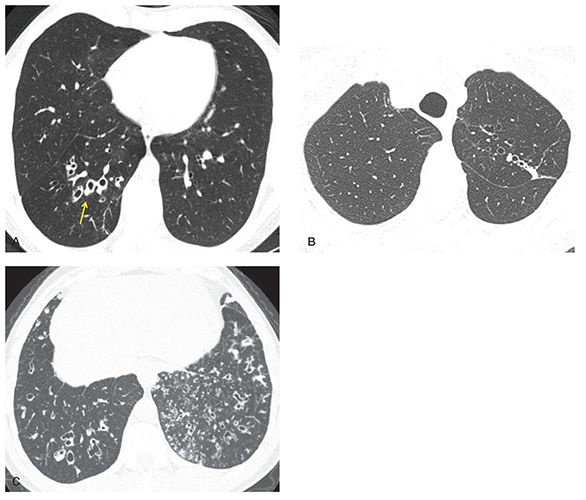
FIGURE 21-30 Bronchiectasis: HRCT features in different diseases. A: One-millimeter section shows right lower lobe bronchiectasis, with dilated, thick-walled bronchi (arrow). Unilateral lower lobe bronchiectasis suggests an infectious etiology, in this case due to prior bacterial pneumonia. Differential includes chronic aspiration. B: One-millimeter section shows asymmetric bronchiectasis in the left upper lobe, associated with mild scarring, and most consistent with prior granulomatous infection. In this case, this was due to prior treated MTB infection. C: One-millimeter section through the lower lobes shows bilateral bronchiectasis and extensive TIB, which is otherwise nonspecific in appearance. This appearance is often associated with chronic infection due to immunodeficiency or other cause. In this patient, these abnormalities were related to ciliary dyskinesia.
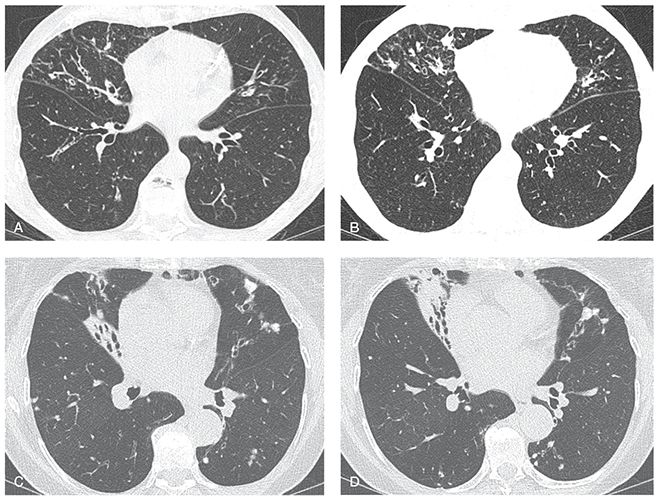
FIGURE 21-31 Atypical mycobacterial infection (MAC). A and B: Sequential 1-mm sections through the mid-lungs show bronchiectasis, mild volume loss, and scattered nodules, predominantly involving the lingua and middle lobe, with relative sparing of the lower lobes. This pattern is characteristic of atypical mycobacterial infection. C and D: Sequential 1-mm sections in a different patient with MAC shows similar findings characteristic of atypical mycobacterial infection, In this case, bronchiectasis is associated with more severe middle lobe and lingular atelectasis.
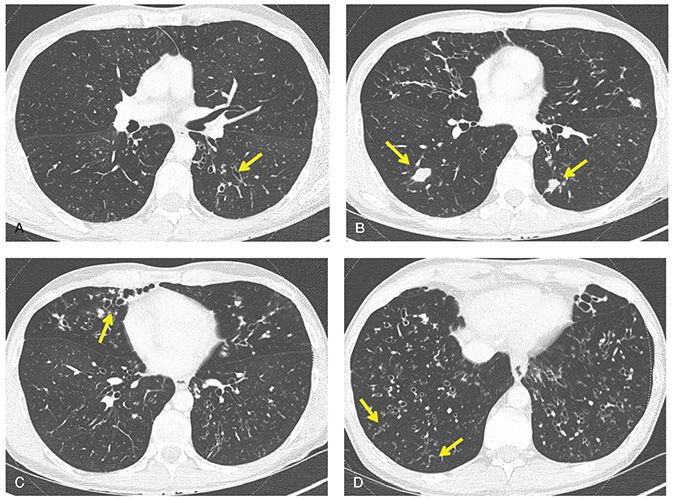
FIGURE 21-32 Cystic fibrosis. A–D: Sequential 1-mm sections show typical features of early CF, including diffuse bronchiectasis (arrows in A and C), peripheral mucoid impaction (arrows in B), and focal bronchiolitis with TIB (arrows in D).
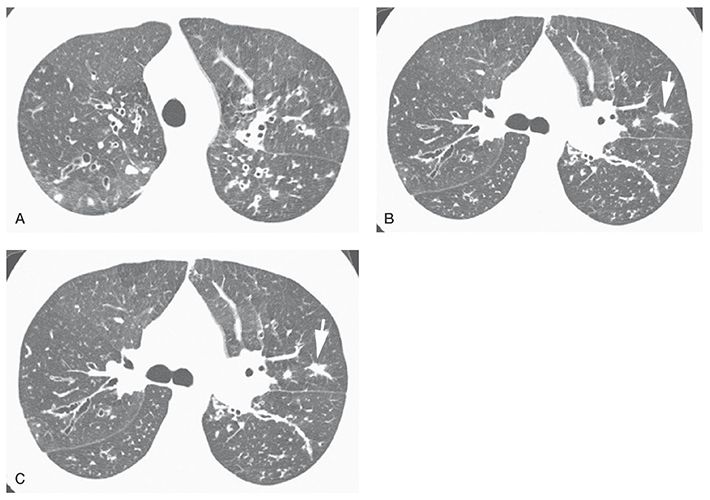
FIGURE 21-33 Early cystic fibrosis. A–C: Bilateral upper lobe bronchiectasis is visible. The most abnormal bronchi are central in location. Nodular opacity (B, arrow) represents a mucous plug. TIB opacities are also visible (C, arrow). (From Naidich DP, Webb WR, Grenier PA, et al. Imaging of the airways: functional and radiologic correlations. Philadelphia, PA: Lippincott Williams & Wilkins; 2005.)
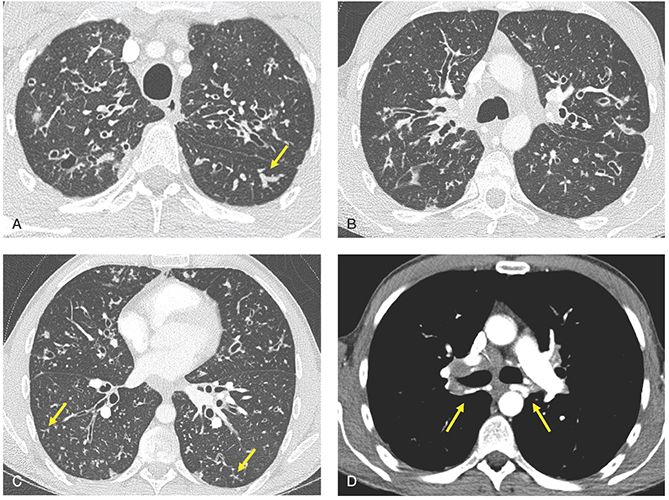
FIGURE 21-34 Cystic fibrosis. A–D: Sequential 1-mm images through the lungs imaged with lung (A–C) and soft-tissue windows (D) after contrast infusion. There is evidence of diffuse bronchiectasis, with an upper lobe and central predominance, associated with scattered foci of mucoid impaction (arrow in A) and TIB opacities (arrows in C). In the setting of severe, long-standing airway inflammation, marked enlargement of the bronchial arteries is easily identified (arrows in D).
Pulmonary Artery Hypertension. Recent attention has focused on the association between long-standing bronchiectasis and pulmonary hypertension (115–117). Of particular interest is the apparent association between the extent and severity of bronchiectasis and mortality. In one recent study of 91 patients with bronchiectasis, compared with standard airway measurements, the average right and left main pulmonary artery diameters proved the best predictor of mortality (hazard ratio, 1.24; 95% CI, 1.13–1.35; p < 0.0001), independent of the extent and severity of bronchiectasis (117).
Interlobular Septal Thickening
Interlobular septal thickening, a nonspecific finding, has been described in patients with bronchiectasis. As noted by Sibtain et al. (77) in a retrospective study of 94 patients with idiopathic bronchiectasis, interlobular septal thickening was identified in 60%, with a strong correlation noted between septal thickening and the extent (r = 0.61, p < 0.001) and severity (r = 0.54, p < 0.001) of bronchiectasis. Interestingly, interlobular septal thickening could be identified in 20% of lobes in which there was no CT evidence of bronchiectasis, leading these investigators to postulate that impaired lymphatic drainage, resulting in septal thickening, may be a precursor to idiopathic bronchiectasis (77).
CT Diagnosis: Imaging Techniques
Given the range and subtlety of abnormalities that can be present in patients who have airways disease, it is apparent that an accurate diagnosis requires meticulous attention to scan techniques.
Prior to the introduction of multidetector scanners (MDCT), axial CT with 1- to 3-mm sections every 10 mm, reconstructed with a high-resolution (edge-enhancing) algorithm, represented the state-of-the-art technique for evaluating patients with suspected bronchiectasis (86,118,119). It should be emphasized that in patients in whom a diagnosis of bronchiectasis has already been established, and for whom multiple follow-up CT studies are indicated (e.g., patients with atypical mycobacteria infections), the use of conventional HRCT performed with a low-dose technique is a viable choice.
However, in the era of multidetector CT scanners, volumetric acquisition of images with reconstruction of contiguous high-resolution images should be the method of choice, at least for the initial evaluation of patients with suspected bronchiectasis. Acquisition during a single breath hold has the advantage of minimizing respiratory and cardiac motion. More importantly, contiguous high-resolution images throughout the thorax prove optimal for identifying focal, often subtle peripheral airway abnormalities (Fig. 21-24) (5,120).
By providing near-isotropic resolution, volumetric high resolution enables use of a number of postprocessing applications unavailable with conventional HRCT techniques. This includes multiplanar reconstructions (MPRs), minimum-intensity projection (MinIP) and MIP images (Figs. 21-21 and 21-22), as well the potential for automated segmentation for visualization of the entire tracheobronchial tree (Fig. 21-25). As reported by Chooi et al. (121) in a study of 23 consecutive patients with suspected airways diseases evaluated by three chest radiologists, although use of MPRs did not significantly affect diagnostic accuracy, when used in conjunction with routine axial images, MPRs significantly improved agreement among readers for diagnosing bronchiectasis (k = 0.29 without MPRs, k = 0.54 with MPRs).
Volumetric data acquisition may also be used to evaluate the presence of air trapping in patients who have suspected bronchiectasis (11,110,111,122–124). This may be accomplished either by sequentially acquiring scans at one preselected level during a forced expiration, or by obtaining two separate acquisitions, first in deep inspiration, followed by scans obtained through the same region in expiration (see Chapter 1) (13,109,110,125–129). For those cases in which expiratory imaging is required, the acquisition of a few selected HRCT images at the level of the carina, inferior pulmonary vein, and 2 cm above the diaphragms generally proves sufficient to evaluate air trapping (122). The value of expiratory images cannot be overemphasized. Changes in the density of the lung due to focal air trapping may only be identified on expiratory images. Similarly, expiratory images allow identification of abnormal proximal airway mechanics and bronchomalacia.
In a study of 100 patients who had bronchiectasis, having both inspiratory and expiratory scans (122), the extent of decreased attenuation (i.e., air trapping) on the expiratory CT scans correlated strongly with the severity of airflow obstruction; the closest relationship (r = –0.55, p = 0.00005) was seen between decreased FEV1. In select cases, MinIP images may be more sensitive than routine images for detecting subtle regions of mosaic perfusion or air trapping on expiratory scans (Figs. 21-21 and 21-22) (130–132).
Finally, it should be emphasized that whenever possible, studies should be performed with a low-dose technique. Although the definition of a “low-dose” study is evolving, currently available commercial techniques can lead to significant reductions in radiation dose, when compared to routine CT. These include automatic tube current (mA) modulation, optimization of tube potential, beam-shaping filters, dynamic z-axis collimators, and, in particular, iterative reconstruction techniques (133). All these techniques, available on current state-of-the-art CT scanners, should be employed when available. As reported by Yi et al. (134), adequate diagnostic images can be obtained with mA settings as low as 70. In particular interest, it has been shown that use of iterative reconstruction techniques allows nearly 50% dose reduction without sacrificing image quality (134).
Quantitative HRCT for Airway Evaluation
To date, a number of methods for obtaining quantitative measurements in the assessment of airways disease have been proposed (135). These include measurement of airway lumen diameter, lumen area (LA), wall thickness (WT), wall area (WA), ratio of wall area to total airway area, and percent wall area (WA%). Recently, measurement of mean wall attenuation has also been evaluated as a potential biomarker for patients with COPD (136,137). Unfortunately, there is no consensus as to which of these measurements is optimal, or which, if any, are of value in routine clinical practice. For these reasons, application of advanced quantitative techniques has been limited to advanced research investigations (135).
Berger et al. (138) assessed contiguous 1-mm sections obtained using spirometrically gated CT, and a semiautomated approach, to prospectively measuring the WA, internal area (IA), airway caliber (defined as the sum of WA and IA), and WA/IA ratio in nine nonsmokers, seven smokers with normal lung function, and eight smokers with COPD. Using this approach, these investigators showed that normalized airway wall thickness (summation of WA to summation of IA [ΣWA/ΣWI]) and IA were significantly related to FEV1 (r = 0.54, p = 0.006) and forced expiratory flow (FEF) between 2% and 75% of vital capacity (FEV 25%–75%) (r = –0.65, p < 0.001). It should be noted, however, that for this study, evaluation was limited to only five bronchi in a single section, individually selected, requiring each observer to independently draw a square region of interest around each bronchus (138).
Using a different approach, Brillet et al. (139) evaluated ten asthmatic patients at two different time intervals using spirometrically gated CT to acquire contiguous 1-mm images through the right lower lobe only for subsequent semiautomated quantitative evaluation. Establishing a threshold of five separate criteria to define “acceptable” airways for evaluation, including LA greater than 4 mm, bronchi greater than 7 mm in length established over a minimum of 10 contiguous images, and a minimum of 55% of the airway circumference free from an adjacent pulmonary artery, LA and WA could be successfully assessed on the two separate acquisitions in 78% and 98% of bronchi, respectively. Using the threshold criteria described previously, LA and WA were successfully evaluated for 81% and 23% of segmental bronchi and 72% and 57% of subsegmental airways, respectively (139). Although these studies clearly show that quantitative evaluation of the candidate airways is feasible, these techniques still require considerable observer interaction, as well as specialized software.
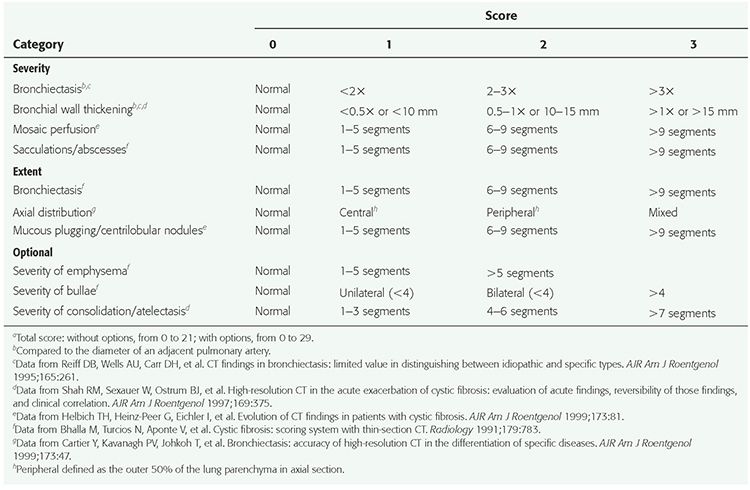
As will be discussed in detail in the Section on Cystic Fibrosis, it is possible to create global semi- and completely automated global scoring of the extent and severity of disease in patients with diffuse airway and lung disease, using contiguous 1-mm high-resolution images (Table 21-3). However, this approach as well remains to be established for routine clinical practice.
TABLE 21-3 HRCT Bronchiectasis Scoring Systemsa
Although, at present, the complexity of quantitative approaches limits routine clinical application, there is software, currently available, for obtaining quantitative airway measurements. Commercially available systems include Virtual Bronchoscopy (Siemens, Forcheim, Germany), Pulmonary Workstation (VIDA Diagnostics, Coraville, Iowa), and Thoracic VCAR (GE Healthcare, Waukesha, WI), while noncommercial applications include Airway Inspector (http://www.airwayInspector.org) and BronCare (Artemis Department, Institut National des Telecommunications, Evry, France) (135). It is anticipated that with further refinement, a growing number of online applications, in particular, will become available, with the expectation that simplified and standardized methods for quantitative airway assessment will continue to evolve and ultimately gain universal acceptance for routine clinical evaluation.
Pitfalls in the Diagnosis of Bronchiectasis
Several potential pitfalls in the diagnosis of bronchiectasis should be avoided (Table 21-4, Figs. 21-24 to 21-26) (140). While transmitted cardiac pulsations and respiratory motion may be problematic, these artifacts are less likely to be seen with newer CT scanners, which allow imaging of the entire thorax in less than 1 second. As previously discussed in Chapter 1, the appearance of bronchial wall thickening depends on the use of appropriate window widths and levels (141). Furthermore, on expiratory scans, bronchi can appear thicker walled and narrower than on inspiratory scans.
TABLE 21-4 Pitfalls in the HRCT Diagnosis of Bronchiectasis
Technical factorsa |
Respiratory and/or cardiac motion artifactsa |
Inappropriate collimation (sections >3 mm) |
Inappropriate window settings (e.g., window width < 1,000 HU) |
Reversible bronchiectasisa |
Lung consolidation/pneumonia |
Atelectasis |
Pseudobronchiectasis (e.g., Langerhans histiocytosis, cavitary metastases, Pneumocystis pneumonia) |
Traction bronchiectasisa |
Increased B-AR in normal subjects or asthmatics, or at high altitudea |
aMost common findings.
Bronchiectasis is difficult to diagnose with confidence in patients who have concurrent parenchymal consolidation or atelectasis; in such patients, peripheral airways often appear dilated, a transient abnormality that reverts to normal after resolution of the lung disease. This occurrence represents so-called reversible bronchiectasis, an oxymoronic term, since bronchiectasis is defined by irreversible dilatation (Fig. 21-26) (142). In subjects with consolidation or atelectasis, and apparent bronchiectasis, follow-up scans are recommended pending radiographic resolution. Another potential pitfall related to lung consolidation is the fact that consolidation may obscure vascular anatomy, rendering interpretation of B-ARs difficult or impossible (4). Ideally, visualization of small structures within the lung requires a high-resolution technique. This is especially true when assessing smaller airways.
Also, a number of diffuse lung diseases show abnormalities that may be difficult to differentiate from bronchiectasis (Figs. 21-27 to 21-29). In patients with Langerhans cell histiocytosis (LCH), bizarre-shaped cysts are often seen, especially in the upper lobes. Because these may appear to branch, their appearance may be suggestive of bronchiectasis, so-called pseudobronchiectasis (Fig. 21-27). In fact, pathologically, some of these cystic abnormalities may represent abnormally dilated bronchi, presumably the result of peribronchiolar inflammation. Rarely, cavitary nodules in patients who have either widespread invasive mucinous adenocarcinoma or cavitary metastases may mimic the appearance of bronchiectasis (Fig. 21-28). Similarly, cystic lesions in patients who have Pneumocystis jirovecii pneumonia may also superficially simulate bronchiectasis. In these cases, it should be recognized that cystic changes usually occur within areas of ground-glass opacity, simplifying the differential diagnosis. Most important, dilated airways are frequently identified as a component of fibrotic lung diseases, so-called traction bronchiectasis (Fig. 21-29). Traction bronchiectasis is easily identified because peripheral bronchi appear irregularly thick walled or corkscrewed and are invariably found in association with diffuse reticular changes, honeycombing, or fibrotic masses (143). Traction bronchiectasis does not represent primary airways disease and is usually unassociated with the typical symptoms of bronchiectasis (143). Similarly, additional care should be exercised to avoid mistaking subpleural honeycombing for cystic bronchiectasis.
Utility of HRCT in the Diagnosis of Bronchiectasis
Even prior to the introduction of MDCT (118,119), it has long been apparent that HRCT is an ideal method for diagnosing bronchiectasis. In addition to establishing the diagnosis, HRCT has emerged as an important means for following the course of disease in patients with a variety of chronic airways diseases. As discussed in greater detail later in this chapter, most studies assessing a role for sequential HRCT have been performed in patients with CF (144–148). Less attention has been paid to evaluating serial HRCT studies in patients with other causes of bronchiectasis. However, in one study of 48 patients with bronchiectasis in whom serial CT studies at baseline and follow-up were compared with PFTs, serial changes in pulmonary function correlated with the presence of air trapping due to mucous plugging on expiratory images, whereas the greater the severity of mucous plugging, bronchiectasis, and bronchial wall thickening proved predictive of decreased FEV1 (149).
Caution must be exercised in diagnosing bronchiectasis in subjects with subtle abnormalities. As with the bronchoarterial ratio (described earlier), which may be increased in some normal subjects (52,79,88), Matsuoka et al. (150) have pointed out that variability in bronchial wall luminal area and wall thickness may be seen in subjects without evidence of cardiopulmonary disease. In one study of 52 asymptomatic patients without evidence of cardiopulmonary disease, Matsuoka et al. employed semiautomatic image processing to evaluate a variety of quantitative airway features, including LA (luminal area), total airway area (TA), and airway wall area (WA) and wall thickness (WT), among others, on contiguous 2-mm sections selectively obtained through the right lower lobe. These authors noted that while luminal area decreased in a normal fashion in most individuals as airways extended toward the lung periphery, in approximately one-third of cases, LA actually increased toward the lung periphery, with LA increasing by 10% or more in 101 of 943 (10.7%) bronchi (150). As important, relative WA increased by more than 5% between two contiguous images in 29% of airways, whereas the ratio between wall thickness and luminal diameter (WT/D) increased by more than 0.02 in 35.8% of cases. These findings suggest that caution should be exercised in assuming that focal changes in the caliber of airways or wall thickness are necessarily indicative of disease.
DISEASES ASSOCIATED WITH BRONCHIECTASIS
Determining the cause of bronchiectasis is generally based on a consideration of clinical parameters, laboratory tests, and HRCT findings. Nonetheless, a specific diagnosis may be difficult to make in some patients. In two studies, which made use of both clinical data and CT for diagnosis, specific etiologies could be determined in only 47% to 74% of patients, while the remaining cases were considered to be idiopathic (151,152).
Although it is well documented that HRCT is accurate in diagnosing bronchiectasis, and although different patterns of airway abnormalities have been reported in different diseases (Figs. 21-18, 21-19, 21-22, 21-30, and 21-31), several reports have questioned the reliability of HRCT in distinguishing among the various potential etiologies of bronchiectasis (32,153,154). For example, Reiff et al. (32) evaluated the HRCT in 168 patients who had chronic purulent sputum production, suspected of having bronchiectasis. With the exception of a predominant lower lobe distribution in patients who had syndromes of impaired mucociliary clearance, these authors found no significant difference in lobar distribution between cases of idiopathic bronchiectasis and those with a known etiology. Although central bronchiectasis was more common in patients who had ABPA (Fig. 21-18), the sensitivity of this finding proved to be only 37% (32). The extent and severity of disease were most pronounced in patients who had both ABPA and CF, but these features were of only limited diagnostic value in individual cases (32).
Lee et al. (154), in a similar study of CT in 108 patients with bronchiectasis resulting from a variety of causes, found that a correct first-choice diagnosis was made by three experienced observers in only 45% of cases; more problematic still, a high confidence level was reached in only 9%, and of these, a correct diagnosis was made in only 35%, leading these investigators to conclude that CT was of little value in diagnosing specific etiologies of bronchiectasis. However, these studies were all interpreted without the benefit of clinical history.
The described limitations in the accuracy of CT for diagnosing specific causes of bronchiectasis have recently been challenged. Specifically, it has been reported that the diagnostic accuracy of HRCT may be significantly improved if the patient’s ethnicity is considered (155). In one observational study of 106 patients with bronchiectasis confirmed using HRCT, CT findings were correlated with a number of additional variables including a clinical questionnaire, PFTs, sputum microbiology, immune function testing, and ethnicity. In this study, the etiology of bronchiectasis was established in 93.3%. The most common cause of bronchiectasis proved to be immune dysregulation, occurring in 63.2% of cases. Etiologies included immune deficiency (17%); autoimmune disease (31.1%), in particular rheumatoid arthritis (RA); hematologic malignancies (14.2%); and ABPA (0.9%) (155). Other common causes included aspiration (11.3%) and mycobacterial infection (9.4%). Assessed by ethnicity, RA occurred in 28.6% of African American patients versus 6.2% of European Americans, while hematologic malignancies accounted for 20.0% of cases among European Americans versus only one of the African American patients. Similar findings, suggesting the importance of ethnicity when determining etiology in bronchiectasis have been reported. In a study of trends in bronchiectasis among Medicare beneficiaries by Seitz et al. (34), the prevalence of bronchiectasis found in Asian Americans proved 2.5- and 3.9-fold higher when compared with European Americans and African Americans, respectively.
The need to carefully evaluate the immune status of patients with bronchiectasis has also been emphasized by Venrell et al. (156). In their study of the immunologic status of 107 patients with documented bronchiectasis of unknown etiology, with normal IgG levels, immune deficiency, defined as failure to respond to pneumococcal unconjugate vaccine and Haemophilus influenzae type b conjugate vaccine, was established in 12 (11%) cases (156). Further evidence of an association between immune dysfunction and bronchiectasis has been reported in a patient with chronic GVHD following BMT (157).
When attempting to diagnose bronchiectasis on HRCT, it is important to keep in mind that only a few diseases are commonly encountered in routine clinical practice. In many of these, while HRCT findings might be nonspecific, in the appropriate clinical setting, their recognition can aid in the diagnosis or are sufficiently typical to warrant a detailed description. The most important of these common diseases are nontuberculous mycobacterial infection (Figs. 21-4, 21-19, and 21-31), CF (Figs. 21-3, 21-20, 21-22, and 21-32 to 21-36), asthma (Figs. 21-37 and 21-38), and ABPA (Figs. 21-2, 21-18, and 21-39 to 21-44). Bronchiectasis in association with lung nodules is characteristic of nontuberculous mycobacterial infection resulting from MAC (Figs. 21-4, 21-19, and 21-31) and is described in detail in Chapter 17. It should also be recognized that bronchiectasis is a common feature of diseases usually regarded to predominantly involve small airways, such as CB (BO) and panbronchiolitis. These are described in detail later in this chapter.
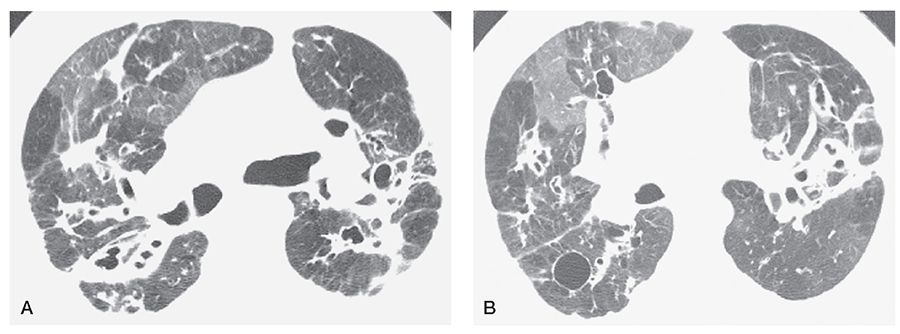
FIGURE 21-35 A and B: CF in an adult. HRCT scans through the upper lung zones show central bronchiectasis and inhomogeneous opacity due to mosaic perfusion. Note the presence of decreased vessel size and abnormal bronchi in the relatively lucent lung regions. A cyst is visible in the posterior right lung.
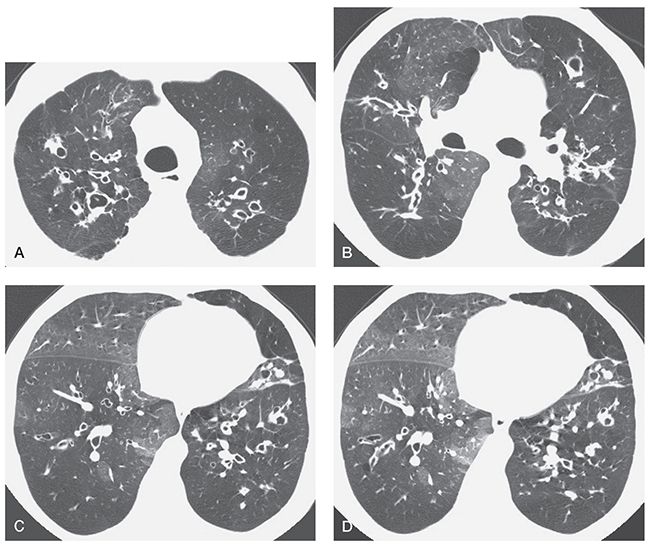
FIGURE 21-36 CF in an adult patient who has bronchiectasis, mosaic perfusion, and air trapping on an expiratory scan. HRCT scans through the upper (A), middle (B), and lower (C) lung zones show multiple thick-walled and dilated bronchi. Bronchiectasis is most evident in the central lung regions, a finding typical of CF and termed central bronchiectasis. On the inspiratory scans (A–C), the lung appears inhomogeneous in opacity, with decreased vessel size and abnormal bronchi visible in the lucent lung regions. This is typical of mosaic perfusion secondary to air trapping. An expiratory scan (D), obtained at the same level as C, shows air trapping in lucent lung regions.
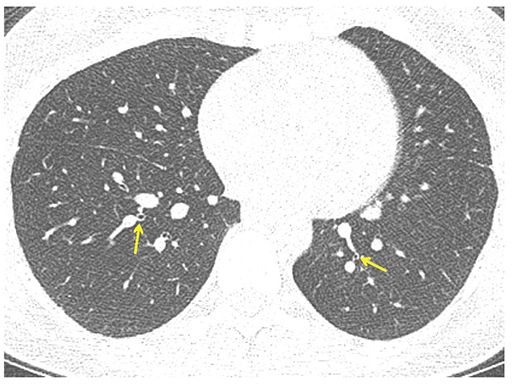
FIGURE 21-37 Asthma. One-millimeter section through the lower lobes shows bronchial narrowing with airways appearing smaller than accompanying pulmonary arteries (arrows). This finding is characteristic of long-standing asthma resulting in diffuse airway remodeling.
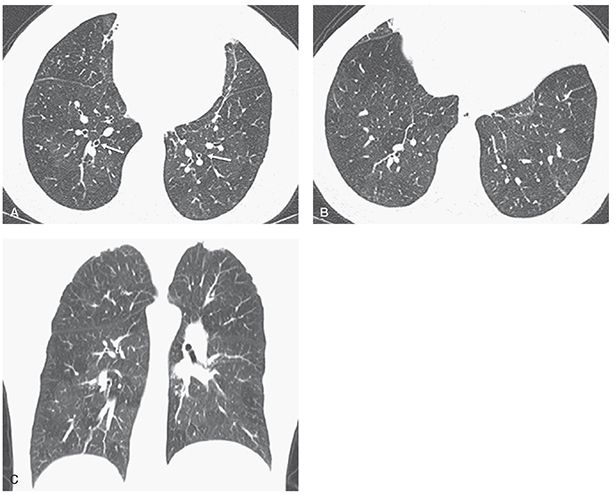
FIGURE 21-38 Asthma. A and B: One-millimeter sections through the lower lobes show hyperinflated lungs associated with mild bronchial wall thickening (A, white arrows) and heterogeneous lung attenuation with subtle lucency in several secondary lobules, especially in the right lower lobe in B. C: Coronal image shows to better advantage the extent and distribution of heterogenous lung density, in this case due to patchy airway obstruction and mosaic perfusion.
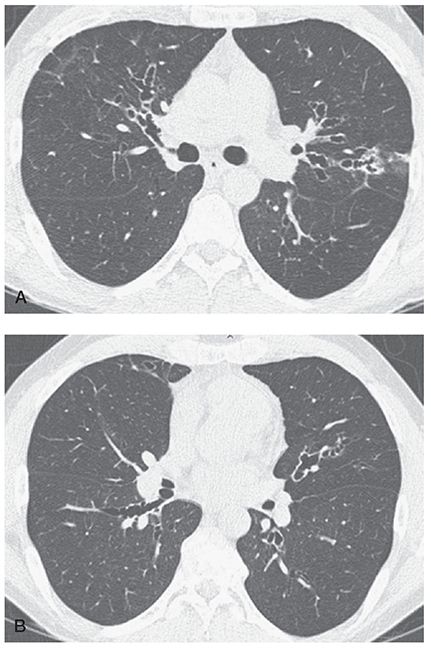
FIGURE 21-39 A and B: Allergic bronchopulmonary aspergillosis. HRCT images through the mid-lung in a patient with ABPA show characteristic pattern of predominantly central bronchiectasis with near-complete sparing of the lung periphery.
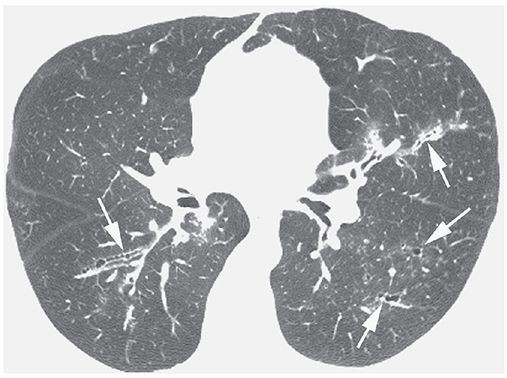
FIGURE 21-40 ABPA with central bronchiectasis. Irregular, thick-walled, and mildly dilated bronchi (arrows) are visible in both lungs.
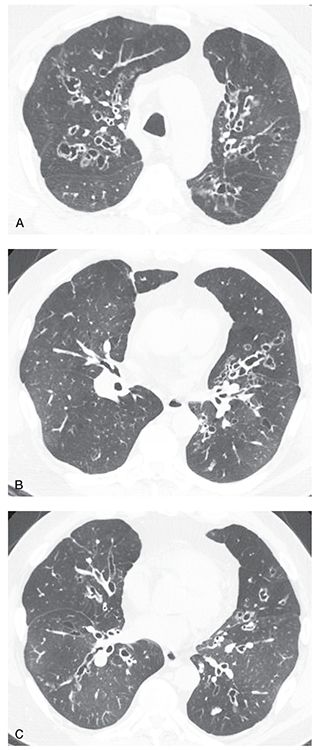
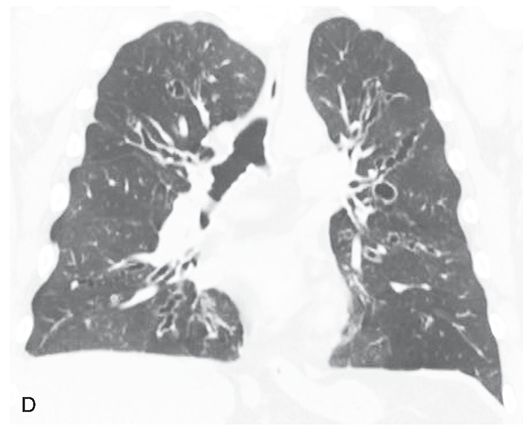
FIGURE 21-41 Allergic bronchopulmonary aspergillosis. A–C: HRCT images through the upper and mid-lungs show predominantly central bronchiectasis with relative sparing of the lung periphery. Multiple lucent regions of mosaic perfusion are visible. This pattern, although nonspecific, is characteristic of ABPA. D: Coronal reconstruction shows the central and upper lung predominance.
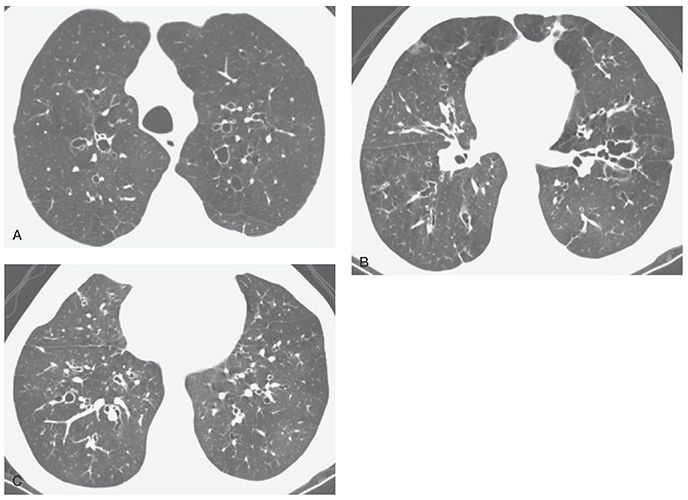
FIGURE 21-42 A–C: ABPA with mild central bronchiectasis. Thick-walled and dilated bronchi are visible diffusely, but with upper lobe predominance. Mild inhomogeneity of lung attenuation reflects mosaic perfusion.
FIGURE 21-43 ABPA: high-density mucoid impaction. Noncontrast-enhanced CT section through the upper lung shows atelectasis of the right upper lobe. Within are a number of rounded high-attenuation foci representing dilated airways containing high-attenuation mucous plugs. This finding is characteristic of long-standing ABPA. The high attenuation presumably reflects the presence of calcium, metallic ions, or both, within viscous mucus, concentrated by the fungal organisms.
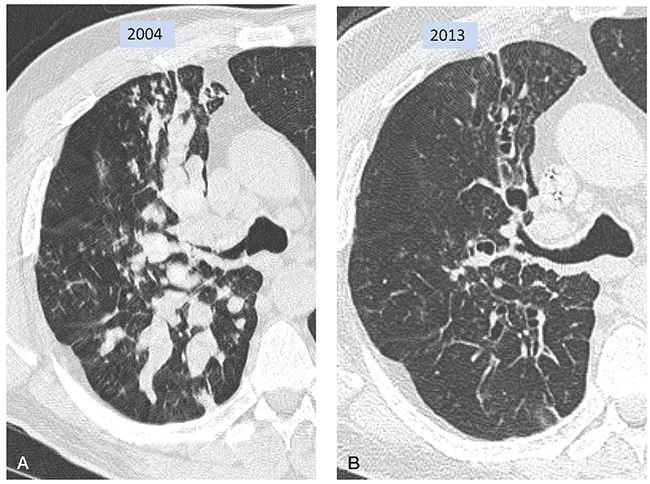
FIGURE 21-44 Allergic bronchopulmonary aspergillosis. A: Target-reconstructed 1-mm section shows narrowing of the proximal right upper lobe bronchus associated with extensive mucoid impaction. Extensive mucous plugging is also seen in the superior segment of the right lower lobe. TIB is also visible in the anterior lung. B: Follow-up CT 9 years later, at the same level as A, shows clearing of mucous plugs, leaving dilated bronchiectatic airways. Mucoid impaction can result in markedly dilated airways that may mimic pulmonary nodules when sectioned at right angles.
Cystic Fibrosis
CF is the most common cause of pulmonary insufficiency in the first three decades of life (158–161). Initially thought to be uniformly fatal in childhood, with current intensive methods of therapy and counseling, the median life expectancy of individuals is now 37.4 years (162). CF results from an autosomal-recessive genetic defect in the structure of the CF transmembrane regulator protein, which leads to abnormal chloride transport across epithelial membranes. The mechanisms by which this leads to lung disease are not entirely understood, but an abnormally low water content of airway mucus is at least partially responsible, resulting in decreased mucus clearance, mucous plugging of airways, and an increased incidence of bacterial airway infection. Bronchial wall inflammation progressing to secondary bronchiectasis is universal in patients who have long-standing disease and is commonly visible on chest radiographs (163–165).
Radiographic Findings
Plain radiographs can be diagnostic in patients who have CF, showing increased lung volumes, accentuated linear opacities in the central or upper lung regions due to bronchial wall thickening or bronchiectasis, central bronchiectasis, and mucous impaction (163–165). However, plain film findings in patients who have early or mild disease may be quite subtle. Hyperinflation, which can represent an early finding, reflects the presence of obstruction of small airways by mucus; thickening of the wall of the right upper lobe bronchus, best seen on the lateral radiograph, can also be an early sign of disease.
In adult CF patients and patients who have chronic disease, abnormalities can include cystic regions in the upper lobes, representing cystic bronchiectasis, healed abscess cavities, or bullae; atelectasis; findings of pulmonary hypertension or cor pulmonale; pneumothorax; and pleural effusion (166). Initially predominant in the upper lobes, in adults, radiographic abnormalities are more often diffuse in nature (167). In the large majority of patients who have an established diagnosis of CF, clinical findings and chest radiographs are sufficient for clinical management. However, it should be recognized that patients who have CF can have a significant exacerbation of their symptoms with little visible radiographic change (168).
HRCT Findings
HRCT findings in patients who have CF have been well described (Figs. 21-3, 21-20, 21-22, and 21-32 to 21-36) (146,147,169,170). Bronchiectasis is present in all patients who have advanced CF who are studied using HRCT (Table 21-5). Proximal or perihilar bronchi are always involved when bronchiectasis is present, and bronchiectasis is limited to these central bronchi in approximately one-third of the cases, a finding referred to as central bronchiectasis (Figs. 21-3, 21-20, 21-22, and 21-32 to 21-36). Both the central and peripheral bronchi are abnormal in approximately two-thirds of patients. All lobes are typically involved, although early in the disease, abnormalities are often predominantly upper lobe in distribution (Fig. 21-33), and right upper lobe predominance may be present in some patients (171). Cylindrical bronchiectasis is the most frequent pattern seen in 94% of lobes in one study of patients who had severe disease (172). Thirty-four percent of lobes in this study showed cystic bronchiectasis, whereas varicose bronchiectasis was seen in 11%. In another report, cystic lesions representing cystic bronchiectasis or abscess cavities were present in 8 of 14 (57%) patients (173).
TABLE 21-5 HRCT Findings in Adult Cystic Fibrosis
Bronchiectasisa,b |
Central bronchi and upper lobes involveda,b |
Sometimes severe (varicose and cystic) and widespreadb |
Bronchial wall thickeninga,b |
Central and upper lobe distributiona,b |
Right upper lobe first involvedb |
Mucous plugginga,b |
Branching or linear centrilobular opacities (TIB)a,b |
Large lung volumesa,b |
Areas of atelectasisa |
Mosaic perfusiona |
Air trapping on expirationa |
aMost common findings.
bFindings most helpful in differential diagnosis.
Bronchial wall thickening, peribronchial interstitial thickening, or both are also commonly present in CF patients (Figs. 21-3, 21-20, 21-22, and 21-32 to 21-36) (174–177). Thickening is generally more evident than bronchial dilatation in patients who have early disease and may be seen independent of bronchiectasis (173,178).
Mosaic perfusion with air trapping on expiratory images is also common and may be the earliest manifestation of disease (Figs. 21-20, 21-22, 21-35, and 21-36), especially when assessed quantitatively (112). Mucous plugging is reported in one-fourth to one-half of cases (174–176), and may be visible in all lobes (Figs. 21-32 to 21-34) (173,179). Collapse or consolidation can be seen in as many as 80% of cases (173,176,177). In one study, volume loss was visible in 20% of lobes in patients who had advanced disease (172). Branching or nodular centrilobular opacities (i.e., TIB opacities) that reflect the presence of bronchiolar dilatation with associated mucous impaction, infection, or peribronchiolar inflammation also can be an early sign of disease (Figs. 21-32 to 21-34) (20,98,101).
Focal areas of decreased lung opacity representing mosaic perfusion are common. These can be seen to correspond to pulmonary lobules or subsegments, typically are geographic in distribution, and, in as many as two-thirds of patients, appear to surround dilated, thick-walled, or mucous-plugged bronchi (Figs. 21-20, 21-22, 21-35, and 21-36) (174,179). Lung volumes may appear increased on HRCT, although this diagnosis is rather subjective and may be better assessed on chest radiographs (172). Cystic or bullous lung lesions can also be visible and typically predominate in the subpleural regions of the upper lobes (172,173). Hilar or mediastinal lymph node enlargement and pleural abnormalities can also be seen, largely reflecting chronic infection. Pulmonary artery dilatation resulting from pulmonary hypertension can also be seen in patients who have long-standing disease. Bronchial artery enlargement can be seen due to chronic inflammation (Fig. 21-34).
Despite numerous reports detailing the range of abnormalities identified in patients who have CF, few if any of these findings are specific in the absence of close clinical correlation. Reiff et al. (32), in an early assessment of 168 patients who had suspected bronchiectasis from a variety of etiologies, found that patients who had adult CF tended to have more widespread involvement than idiopathic bronchiectasis (p < 0.01). In patients who have early disease, abnormalities are often predominantly upper lobe in distribution, with right upper lobe predominance, as previously mentioned.
The use of FDG PET-CT to serve as an outcome measure in CF has recently been investigated. In a study of 20 CF patients, ranging in age from 6 to 18 years, hospitalized for a pulmonary exacerbation, FDG PET-CT (low dose) was acquired at baseline and following antibiotic therapy (180). Treatment resulted in a significant decrease in SUV(max) (mean difference, 2.3 ± 2.1 [standard deviation], p < 0.0001) from baseline. Pretherapy SUV(max) and posttherapy SUV(max) were significantly different from those of normal control subjects. The changes in SUV(max) and percentage predicted FEV1 were negatively correlated (r = –0.72, p = 0.004). Overall CF-CT scores significantly correlated with SUV(max) (r = 0.40, p = 0.01) (180). Although intriguing, the use of PET-CT scanning to measure airway inflammation awaits further investigation.
HRCT can demonstrate morphologic abnormalities in patients who have early CF who are asymptomatic, have normal pulmonary function, have normal chest radiographs, or a combination of these. Consequently, low-dose HRCT is now considered a standard component of routine clinical evaluation of infants, children, and adults with CF (19,146,147,171,181–184).
Quantitative Evaluation: Global Scoring Versus Specific Finding Scores
Given the importance that has traditionally been placed on the radiographic and clinical scoring of abnormalities in patients who have CF, it is not surprising that CT scoring systems have been carefully evaluated in this population (181,183). Specific advantages related to CT scoring in CF patients include its abilities to (a) evaluate specific abnormalities, (b) obtain global scores reflecting the extent and severity of disease, (c) precisely measure airways and lung density, (d) serve as a clinically useful outcome surrogate, and (e) assess experimental treatment response (185,186).
To date, a number of semiquantitative visual scoring systems have been proposed for assessing disease extent and severity (Table 21-3). These have in common an overall good correlation between HRCT findings and standard pulmonary functional indices (81,173–175,187). It has also been shown that despite differences among these systems in the definition of bronchial dilatation and bronchial wall thickening and other findings, there is good correlation among these systems. As reported by de Jong et al. (94), in a comparison of five previously described scoring systems, scores were reproducible with acceptable inter- and intraobserver reliability. It is worth noting that these scoring systems have in common a reliance on routine HRCT slices obtained every 10 mm in deep inspiration, visual assessment only, and that few use expiratory images to augment scoring.
Use of HRCT scoring systems has proved of greater value than standard pulmonary functional parameters for monitoring disease progression in patients with CF. As reported by Judge et al. (18) in a study of 39 consecutive patients evaluated with HRCT studies obtained more than 18 months apart, although the mean FEV1 declined at a rate of 2.3% per year, the mean HRCT total score declined at a significantly faster rate of 2.7% (p < 0.001). This included six patients in whom HRCT scores worsened while PFT remained stable. On the other hand, although HRCT has proved more sensitive for assessing disease progression, including improvements in response to therapy (175), no clinical advantage has been shown for routine use of HRCT for this purpose (181).
In addition to assessing disease extent and severity, HRCT scoring can be used as an outcome measure, augmenting the more traditional use of FEV1. A number of studies have documented that HRCT findings are closely linked to the severity of disease, are accurate and reproducible, and correlate with response to therapeutic interventions over time (147,182,188–190).
Brody et al., in a study of 61 children with CF, used the number of respiratory tract exacerbations occurring in a 2-year period as a measure of clinical outcome. The authors compared baseline and follow-up PFT and HRCT scores, and found that only the overall HRCT score (r = 0.91, p = 0.001) and the bronchiectasis score (r = 0.083, p = 0.01) were significantly correlated with the number of respiratory tract exacerbations (147). Interestingly, all specific HRCT findings progressed with time, except for mucous plugging and bronchial wall thickening; this is likely due to the fact that these indices reflect reversible abnormalities, rather than long-term structural changes. In a follow-up study, in addition to generating an overall global CF-CT score, these investigators evaluated the use of specific lobar scores for the presence and severity of five findings, including bronchiectasis, mucous plugging, peribronchial thickening, focal air trapping, and parenchymal abnormalities, such as ground-glass opacity and consolidation (188). Of these, the bronchiectasis score proved most sensitive, followed by the scores for focal air trapping and peribronchial thickening, with the lowest sensitivity noted for parenchymal abnormalities (188).
Additional data supporting the use of specific finding scores as effective outcome surrogate markers, rather than global scoring, have been reported by de Jong et al. (182). A study of 119 CF patients at baseline and after 2- to 3-year follow-up evaluated global and composite CT scores as well as individual component scores. The authors found that while pulmonary function and global scores all worsened over time, the peripheral bronchiectasis score proved of greatest value with an increase of 1.7% per year (p < 0.0001) (182).
The relative value of scoring a limited number of specific parameters, rather than global scoring, has been evaluated by Oikonomou et al. (191). Using three “simplified” HRCT parameters, including severity of bronchiectasis, bronchial wall thickening, and atelectasis-consolidation, these authors found excellent correlation between each individual score as well as a composite score of all three parameters (0.892, r = 0.0967, p
Stay updated, free articles. Join our Telegram channel

Full access? Get Clinical Tree


