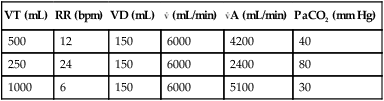
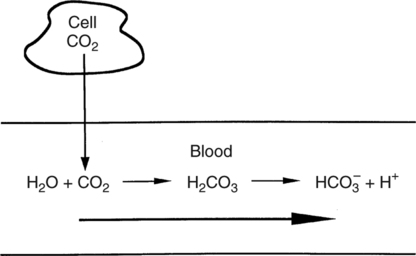
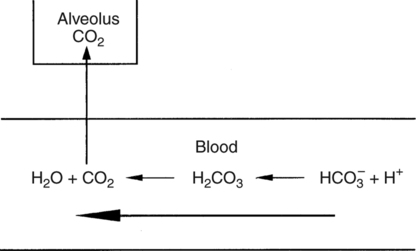
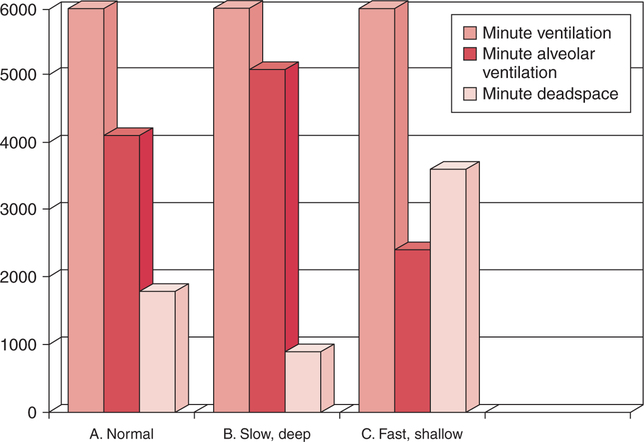
In normal humans, the lungs excrete approximately 13,000 mEq/day of carbonic acid.363 However, the kidneys of an average American adult excrete only 40 to 80 mEq/day of acid.363 Thus, the lungs are the single most important organs involved in the moment- to-moment regulation of acid-base status and pH. When the concentration of the substances on the left side of a chemical reaction at equilibrium is greater than the concentration of the constituents on the right side, the reaction is said to be shifted to the left. For example, the equation shown in Equation 8-1 is said to be shifted to the left because the concentration of reactants on the left is greater than the concentration of H2CO3. Nevertheless, the reaction is still at equilibrium. Also note that the arrow pointing to the left is longer than the arrow pointing to the right. This designation shows that the reaction is shifted to the left at equilibrium. Thus, if there is an increase in one of the reactants on the right side of the equation, the law of mass action causes the equilibrium point to shift to the left to partially counteract the disturbance. For example, in Equation 8-1, if 5 units of external H2CO3 were added to this equilibrium in a closed system, the equilibrium would shift to the left to partially counteract the alteration. The change in units shown in Equation 8-2 shows the direction of changes that would occur in response to the additional H2CO3 in the system. Conceptually, the increase in mass on the right side of the equation pushes the reaction to the left side of the equation. A similar phenomenon occurs if one of the constituents is removed from the closed system. In this case, however, the change in equilibrium is an attempt to restore the lost constituent. If CO2 is removed from Equation 8-2, the equilibrium would shift slightly to the left to attempt to restore the lost CO2. The change in units in Equation 8-3 shows the general direction of changes that would accompany the loss of CO2. Note that the removal of CO2 from the system leads to a fall in H2CO3 concentration due to the law of mass action. CO2 is produced continuously in the cells of the body as an end product of aerobic metabolism. This CO2 then diffuses to the systemic circulation where some of it reacts with water to form carbonic acid. This reaction, shown in Equation 8-4, is called the hydrolysis reaction because water (hydro) is broken down (lysed) as it reacts with dissolved CO2 to form carbonic acid. Because all acids are capable of releasing hydrogen ions, the release of free H+ from carbonic acid is also shown in Equation 8-4. Because of their common involvement in the hydrolysis reaction, there is a direct, linear relationship between the concentration of dissolved CO2 and the concentration of carbonic acid [H2CO3] in the blood. At 37° C, each H2CO3 molecule in solution is in equilibrium with approximately 340 CO2 molecules, as shown in Equation 8-1.364 Earlier estimates reported that the ratio was greater than 700 to 1; however, improved methods suggest the ratio given here. When blood PCO2 levels increase, blood levels of H2CO3 likewise increase. Thus, PCO2 can be used as a marker of blood volatile acid (i.e., H2CO3) levels. Based on the law of mass action, the CO2 that builds up at the tissues leads to a parallel increase in carbonic acid and ultimately hydrogen ions (Fig. 8-1). Thus, there is an increase in the amount of carbonic acid present in the blood as it passes the tissues and CO2 enters. Venous blood has more CO2 and carbonic acid than arterial blood. In fact, that is why venous blood is slightly more acidic (pH = 7.38) compared with arterial blood (pH = 7.40). Actually, the difference in pH would be more substantial were it not for the many effective buffer systems in the blood. When the venous blood reaches the lungs, the increased CO2 and carbonic acid that entered the blood at the tissues must be excreted. This is precisely the role of the lungs in acid-base balance: to excrete CO2 and carbonic acid at the same rate that it is being produced. Figure 8-2 shows that as CO2 diffuses into the alveoli, the law of mass action forces the hydrolysis reaction to the left. The net effect of this action is a reduction in carbonic acid and a decrease in the number of hydrogen ions in the blood. Thus, as CO2 is excreted via the lungs, the body is functionally excreting H2CO3. Large increases in metabolism and CO2 production sufficient to result in PaCO2 elevation may occur occasionally in patients with sepsis (blood infection) or massive burns. Also, an increase in blood PaCO2 can occur after intravenous administration of the drug sodium bicarbonate (NaHCO3) to a patient who is unable to increase alveolar ventilation.365 Because bicarbonate is one of the factors in the hydrolysis reaction, its presence in increased quantities pushes the reaction to the left, which, in turn, has the effect of increasing dissolved CO2 and H2CO3 levels in the blood. The amount of gas moving in and out of the lungs with each breath is called the tidal volume (VT). The number of breaths taken each minute is often referred to as the frequency or respiratory rate (RR). Exhaled minute ventilation ( As shown in Proportion 8-2, PaCO2 is inversely proportional to alveolar ventilation. Alveolar ventilation differs from minute ventilation in that only the gas that reaches functional (i.e., perfused) alveoli is considered alveolar ventilation; in other words, deadspace volume (VD) (see Chapter 6) is subtracted from the tidal volume (VT) to determine alveolar ventilation ( One can readily see that any increase in tidal volume or RR (or a decrease in deadspace) increases alveolar ventilation, assuming of course that all other variables remain constant. An increase in alveolar ventilation, in turn, lowers PaCO2. Conversely, a fall in RR or tidal volume (or an increase in deadspace) decreases alveolar ventilation and increases PaCO2. When a change in PaCO2 is seen clinically, Equation 8-6 should be analyzed to determine what variable has resulted in the change in the patient’s ability to excrete CO2. Table 8-1 shows three sets of parameters where the minute ventilation is the same (6000 mL/min); however, alveolar ventilation and CO2 excretion are grossly different.Figure 8-3 similarly illustrates how alveolar ventilation and deadspace ventilation would be impacted by the breathing patterns inTable 8-1. During normal breathing (seeFig. 8-3,A), most ventilation is effective alveolar ventilation. If minute volume remains constant, alveolar ventilation will increase with larger tidal volumes and a slower respiratory rate (seeFig. 8-3,B). Finally, if breathing is very rapid and shallow, deadspace ventilation can actually exceed alveolar ventilation (seeFig. 8-3,C) despite a constant minute ventilation. Table 8-1 Minute Ventilation Versus Alveolar Ventilation Note likewise that the PaCO2 varies inversely with the alveolar ventilation. The inadequacy of minute ventilation as an index of the adequacy of ventilation is clearly shown in Table 8-1 and Figure 8-3. The PaCO2 is the only reliable index of the adequacy of ventilation. It should also be noted that inTable 8-1 and Figure 8-3, deadspace is considered a constant 150 mL/breath. In these sets, changes in alveolar ventilation are due to alterations in VT and RR. In many disease states, deadspace varies considerably from this value. Thus, even when tidal volume and RR are known, the blood gas and specifically the PaCO2 are necessary to assess the adequacy of As described in Chapter 3, gases dissolve in liquids in direct proportion to their partial pressures. Furthermore, the volume of gas dissolved in a given liquid depends on the solubility coefficient of that gas in that particular fluid. The solubility coefficient of CO2 in blood is approximately 0.072 vol%/mm Hg, which, of course, is much higher than the solubility coefficient of O2(0.003 vol%/mm Hg). Given a normal PaCO2 of 40 mm Hg, the normal volume of dissolved CO2 in the arterial blood is approximately 2.9 vol%. As shown previously in Equation 8-1, the concentration of carbonic acid [H2CO3] in the blood varies directly with the quantity of dissolved CO2, because these two substances are related directly via the hydrolysis reaction. The amount of actual H2CO3 in the blood, however, is minute (0.006%) in comparison with total CO2 transport. The reason for this unbalanced relationship is that the chemical equilibrium point of the reaction is such that the ratio of dissolved [CO2] to [H2CO3] is approximately 340 to 1 (see Equation 8-1).364 In other words, the reaction is shifted far to the left. Thus, although the quantitative relationship between dissolved CO2 and H2CO3 is very important from an acid-base perspective, the volume of CO2 being transported in the form of H2CO3 is negligible.
Acid-Base Homeostasis
HYDROGEN IONS AND pH
Free Hydrogen Ions
Clinical Significance
pH Homeostasis
Acid Homeostasis
Acid Excretion
THE LUNGS AND REGULATION OF VOLATILE ACID
Underlying Chemistry
Chemical Equilibrium
 Equation 8-1
Law of Mass Action
 Equation 8-2
 Equation 8-3
Hydrolysis Reaction
 Equation 8-4
Direct Relationship between [CO2] and [H2CO3]
Carbonic Acid Production
Carbonic Acid Excretion
CO2 Homeostasis
 Proportion 8-1
CO2Production
CO2Excretion
 Proportion 8-2
Minute Ventilation
 E) can be calculated as shown in Equation 8-5.
 E Equation 8-5
Alveolar Ventilation
 A). The formula for calculation of alveolar minute ventilation is shown in Equation 8-6.
 A=(VT-VD)×RR Equation 8-6
Minute Ventilation versus Alveolar Ventilation
VT (mL)
RR (bpm)
VD (mL)
 (mL/min)
 A (mL/min)
PaCO2 (mm Hg)
500
12
150
6000
4200
40
250
24
150
6000
2400
80
1000
6
150
6000
5100
30
 A and the ability of the body to maintain CO2 homeostasis.
CO2Transport
Dissolved CO2
Carbonic Acid
![]()
Stay updated, free articles. Join our Telegram channel

Full access? Get Clinical Tree


Acid-Base Homeostasis
 CO2.
CO2. A. The balance of
  CO2 and
  A determines the arterial PaCO2 at any given instant, which is shown in Proportion 8-1.
 CO2 is considered to be a constant and the number one is substituted in the numerator. The proportion becomes simply an inverse relationship between PaCO2 and alveolar ventilation.An increase in alveolar ventilation results in a decreased PaCO2. Conversely, a decrease in alveolar ventilation causes an increased PaCO2.
VT×RR=
Only gold members can continue reading. Log In or Register to continue
