We sought to measure the accuracy of 2-dimensional transthoracic echocardiography in determining aortic valve structure in patients with aortic stenosis (AS) undergoing aortic valve replacement (AVR). Few studies have compared aortic valve structure determined by echocardiogram to that determined by examination of the operatively excised stenotic aortic valve. Two-dimensional echocardiograms were reviewed and interpreted by an expert echocardiographer in blinded fashion in 100 patients >50 years of age (mean 70) who had undergone AVR for isolated AS ± aortic regurgitation and the aortic valve structure (unicuspid, bicuspid, tricuspid) was compared to that from examination of the operatively excised stenotic valve. After excluding 14 cases in which echocardiograms were uninterpretable because of heavy calcium and/or poor image quality, congenitally malformed valves were present in 44 patients (51%) and tricuspid valves in 42 of the 86 patients (49%). Ten of the 14 patients (71%) with uninterpretable echocardiograms had congenitally malformed valves. Valve structure by echocardiogram was concordant with morphologic interpretation in 57 of 86 patients (66% accuracy, kappa = 0.33). Accuracy trended toward improvement as degree of AS decreased. In patients with valve areas similar to those enrolled in the recent transcatheter aortic valve implantation trial (PARTNER; 0.7 ± 0.2 cm 2 ), aortic valve structure was accurately determined by echocardiography in 21 of 35 patients (60%). In conclusion, aortic valve structure was interpretable by transthoracic echocardiogram in 86 of 100 patients and accurate in 57 of these 86 patients (66%).
Determining the number of aortic valve cusps is essential in patients with aortic stenosis (AS) who are considered for transcatheter aortic valve implantation without replacement because the presence of a congenitally malformed valve is a relative contraindication to this procedure. At least 4 previously published studies have compared the accuracy of aortic valve structure determined by transthoracic echocardiography to that determined by the surgeon at the time of aortic valve replacement (AVR) or by examination of the excised stenotic valve. Each of these 4 studies had deficiencies that limited their usefulness such as including only patients <50 years of age, including patients with pure aortic regurgitation (AR) of those with AS, or relying entirely on interpretation of valve structure by the cardiac surgeon. We compared aortic valve morphology determined by 2-dimensional echocardiography in patients >50 years of age with AS to that determined by examining the operatively excised valve.
Methods
From December 21, 2004 to May 27, 2010, 687 operatively excised stenotic aortic valves (± AR) in patients having isolated AVR (± coronary bypass) without associated mitral stenosis or mitral valve replacement were received in the surgical pathology department at Baylor University Medical Center (BUMC). The valve was weighed and its structure was determined by W.C.R. in all cases during the week that the valve was excised. Any patient having replacement of a cardiac valve other than the aortic valve was excluded from the study.
Patients’ isolated aortic valve disease was confirmed by examination of their preoperative cardiac catheterization and/or echocardiographic reports, which were available on the Baylor Physician Portal and/or cardiovascular computer database (Apollo Advance C/S 4.2.13, LUMEDX Corp., Oakland, California). Patients were considered to have AS if the peak systolic transvalvular gradient was >10 mm Hg. Aortic valve gradient and valve area were obtained from the cardiac catheterization report.
The December 2004 date was chosen because that was the time the echocardiograms were available on the Cardiology Consultants of Texas computerized database and/or on the Baylor Physician Portal (Baylor electronic medical record).
Of the 687 patients, 100 were >50 years of age at the time of AVR and had preoperative echocardiograms available on the Cardiology Consultants of Texas computerized database and/or on the Baylor Physician Portal. Echocardiograms were recorded from 2 to 1,460 days (mean 89, median 36) before AVR. Of 100 echocardiograms, 80 were recorded <120 days before AVR. At least 1 parasternal long-axis and 1 parasternal short-axis view of the aortic valve were available in each patient.
Echocardiograms were interpreted by a staff cardiologist (P.A.G.) who was blinded to the surgical, pathological, and echocardiographic reports. His interpretations were the primary focus of our analysis. Echocardiograms were also independently reviewed and interpreted by a second cardiologist (R.F.A.) who is a fellow in training (third year) and these interpretations were used to measure interobserver agreement.
Aortic valve structure was interpreted as unicuspid, bicuspid, tricuspid, or indeterminate. The latter was because of heavy calcium and/or because of poor image quality. A valve was considered bicuspid if 2 of 3 echocardiographic criteria were present: (1) elliptical or slitlike orifice in ventricular systole in the parasternal short-axis view, (2) cuspal doming in ventricular systole, or (3) an asymmetrical closure line in the parasternal long-axis view. There were no prespecified echocardiographic criteria for unicuspid or tricuspid valves.
We also reviewed echocardiographic reports made at the time the echocardiograms had originally been recorded. In addition, we reviewed the surgeons’ interpretations of the aortic valve structure from the operative reports. We used the echocardiographic report closest to the date of AVR.
Associations between various factors (demographic, clinical, and anatomic) and echocardiographic interpretations of aortic valve structure (uninterpretable, interpretable, concordant with morphologic interpretation, and discordant with morphologic interpretation) were tested with a Wilcoxon (for continuous factors) or a chi-square (for categorical factors) test. A Bonferroni correction was employed to account for multiplicity. Kappa tests, specificity, and sensitivity were used to assess agreement between echocardiographic and morphologic interpretations of aortic valve structure.
This study was approved by the institutional review board at BUMC .
Results
Table 1 presents demographics and pertinent cardiac findings in all patients, those with interpretable versus uninterpretable echocardiograms for aortic valve structure, and those with concordant versus discordant echocardiographic (P.A.G.) and morphologic (W.C.R.) interpretations. Patients’ age ranged from 51 to 91 years (mean 70 ± 10); 61 were men and 39 were women. Body mass index ranged from 19.7 to 47.1 kg/m 2 (mean 29.0 ± 5.8, median 27.5). There were 3 unicuspid, 51 bicuspid, and 46 tricuspid valves as determined morphologically (W.C.R.).
| Factor | All (n = 100) | Echocardiographic Interpretation of Aortic Valve Structure | |||||
|---|---|---|---|---|---|---|---|
| Interpretable (n = 86) | Uninterpretable (n = 14) | p Value ⁎ | Concordant † (n = 57, 66%) | Discordant † (n = 29, 34%) | p Value ‡ | ||
| Age (years), range (mean ± SD) | 51–91 (70 ± 10) | 51–91 (71 ± 10) | 54–78 (69 ± 8) | 0.481 | 51–91 (71 ± 10) | 52–88 (69 ± 9) | 0.421 |
| Men:women | 61:39 | 54:32 | 7:7 | 0.365 | 41:16 | 13:16 | 0.112 |
| Body mass index (kg/m 2 ), range (mean ± SD) | 19.7–47.1 (29.0 ± 5.8) | 19.7–47.1 (29.3 ± 6.1) | 20.2–35.3 (27.2 ± 4.0) | 0.404 | 19.7–38.9 (28.7 ± 5.0) | 21.4–47.1 (30.4 ± 7.7) | 0.455 |
| Aortic valve morphology (tricuspid:bicuspid:unicuspid) § | 46:51:3 | 42:42:2 | 4:9:1 | 0.221 | 28:29:0 | 14:13:2 | 0.538 |
| Aortic valve weight (g), range (mean ± SD) | 0.81–18.38 (3.03 ± 2.11) | 0.81–18.38 (2.99 ± 2.17) | 1.15–6.32 (3.24 ± 1.72) | 0.691 | 0.81–18.38 (3.18 ± 2.46) | 0.82–7.17 (2.63 ± 1.44) | 0.265 |
| Peak systolic transvalvular gradient (mm Hg), range (mean ± SD) | 11–125 (49 ± 22) | 11–125 (47 ± 21) | 38–113 (61 ± 22) | 0.122 | 11–96 (45 ± 18) | 17–125 (53 ± 27) | 0.241 |
| Aortic valve area (cm 2 ), range (mean ± SD) | 0.25–1.69 (0.81 ± 0.29) | 0.25–1.69 (0.82 ± 0.29) | 0.48–1.33 (0.76 ± 0.26) | 0.577 | 0.42–1.69 (0.89 ± 0.29) | 0.25–1.34 (0.68 ± 0.23) | 0.023 |
| Coronary bypass | 44 (44%) | 41 (47%) | 3 (21%) | 0.101 | 27 (47%) | 14 (48%) | 0.941 |
⁎ Corrected (Bonferroni) p value for significance between interpretable and uninterpretable groups and the given factor.
† In echocardiograms that were interpretable for aortic valve structure (n = 86), echocardiographic interpretations (P.A.G.) were concordant or discordant with morphologic interpretations (W.C.R.).
‡ Corrected (Bonferroni) p value for significance between concordant and discordant groups (excluding 14 uninterpretable cases) and the given factor.
Aortic valve weights ranged from 0.81 to 18.38 g (mean 3.03 ± 2.11). Peak systolic transvalvular gradients (by cardiac catheterization) ranged from 11 to 125 mm Hg (mean 49 ± 22). Aortic valve area (by cardiac catheterization) ranged from 0.25 to 1.69 cm 2 (mean 0.81 ± 0.29). Sixteen valves had areas >1 cm 2 but only 2 of these 16 valves had valve areas >1 cm 2 when measured by echocardiogram. Of these 16 patients, peak systolic gradients ranged from 19 to 96 mm Hg (mean 40 ± 18), mean transvalvular gradients ranged from 14 to 77 mm Hg (mean 31 ± 15), and aortic valve weights ranged from 1.47 to 6.33 g (mean 3.22 ± 1.43, normal aortic valve weight ≤0.50 g).
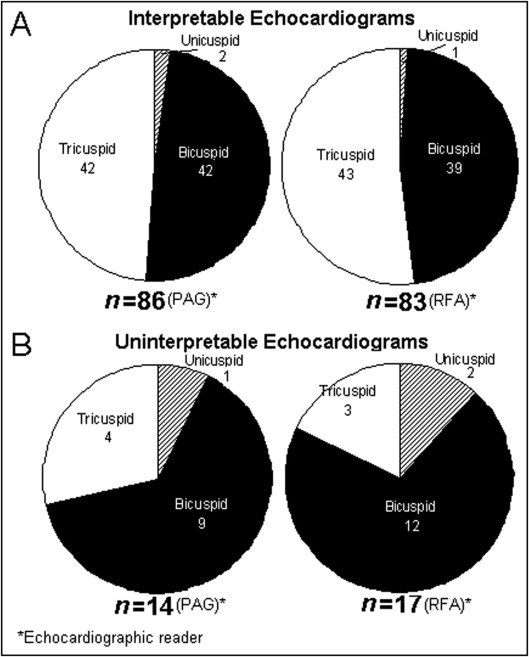
Of the 100 patients, 86 had echocardiograms that were interpretable for aortic valve structure (P.A.G.). In 57 of these 86 patients (66%), echocardiographic interpretation was concordant with morphologic interpretation (kappa test = 0.33). Aortic valve structure in patients with interpretable compared to uninterpretable echocardiograms is shown in Figure 1 . Ten of the 14 patients (71%) who had echocardiograms that were uninterpretable (P.A.G.) had congenitally malformed valves ( Figure 1 ).

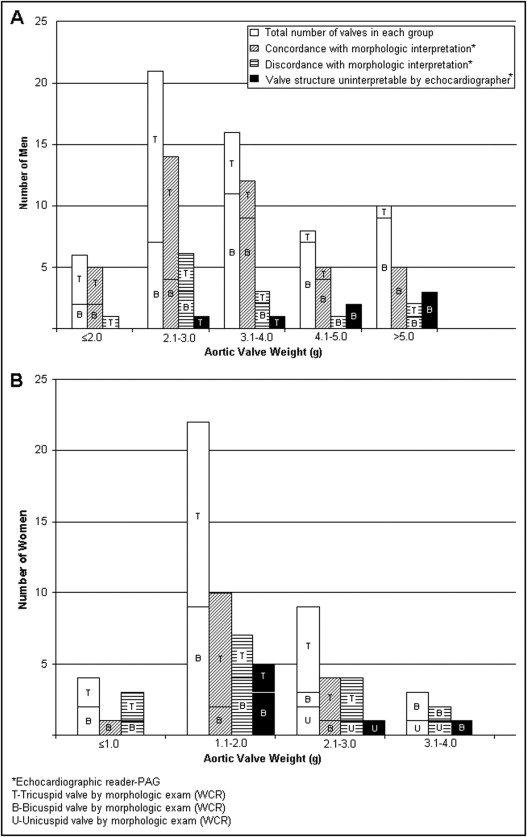
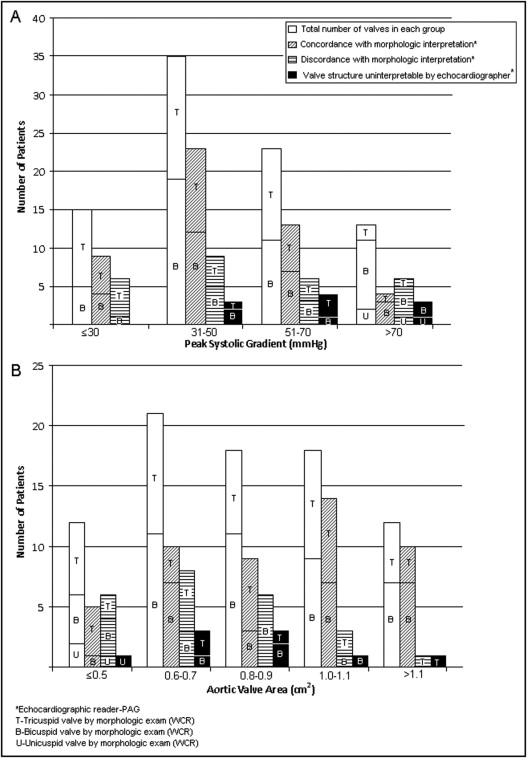
Graphical comparisons of echocardiographic interpretability and concordance of echocardiographic (P.A.G.) and morphologic (W.C.R.) interpretations of aortic valve structure in different groups according to valve weight, gender, age at time of AVR, body mass index, peak systolic gradient, and valve area are shown in Figures 2 to 5 . Unadjusted associations between these factors and echocardiographic interpretability and accuracy are presented in Table 1 .


At heavier valve weights (>4 g in men and >3 g in women), stenotic valve structure was less interpretable (71% vs 90%) but equally accurate (66%) by echocardiogram compared to lighter weights (<4 g in men and <3 g in women; Figure 2 ). Frequency of congenitally malformed valves in these heavier valves was also higher than in the lighter valves (90% vs 44%; Figure 2 ).
Men had higher mean valve weights (quantity of calcium) than women (3.76 ± 2.36 vs 1.86 ± 0.69 g; Figure 2 ). Aortic valve structure was similarly interpretable by echocardiography (82% vs 88%) but less accurately interpreted (48% vs 76%) in women than in men ( Figure 2 ).
Echocardiographic interpretability appeared higher in patients >80 years old (100% vs 84%) than in patients ≤80 years old at time of AVR ( Figure 3 ). Echocardiographic accuracy was similar in the 2 age groups (73% vs 65%; Figure 3 ). Older patients (>80 years old) had a lower frequency of heavily calcified valves (weight >4 g in men and >3 g in women) than younger patients (<80 years old, 7% vs 37%; Figure 3 ). Older patients also had a higher frequency of tricuspid valves than younger patients (80% vs 33%; Figure 3 ).
Overall, echocardiographic interpretability and accuracy did not change with body mass index ( Figure 4 ). Nevertheless, comparison of the largest and smallest body mass index groups showed differences. Of the 12 patients with body mass index >35 kg/m 2 , in only 5 (42%) was the echocardiogram interpretable and accurate; in contrast, of the 33 patients with body mass index ≤25 kg/m 2 , in 17 (52%) the echocardiogram was interpretable and accurate.
Echocardiographic interpretability and accuracy decreased slightly (86% vs 94% and 59% vs 68%, respectively) with higher peak systolic transvalvular gradient (>50 vs ≤50 mm Hg; Figure 5 ). In patients with valve area ≤0.7 compared to >0.7 cm 2 , echocardiographic accuracy was lower (50% vs 80%), but interpretability was similar (86% vs 91%; Figure 5 ).
Comparisons of aortic valve structure determined by echocardiogram by the 2 readers to each other and to that determined by examination of the operatively excised stenotic valve are presented in Table 2 . Sensitivity and specificity of echocardiography (P.A.G.) were 69% and 67% for detection of a bicuspid and 67% and 69% for detection of a tricuspid aortic valve, respectively. Neither echocardiographic reader accurately identified any of the 3 unicuspid valves. Both readers accurately identified 28 (61%) of the 46 tricuspid valves. P.A.G. accurately identified 29, and the fellow in training (R.F.A.), 24 of the 51 bicuspid valves (57% vs 47%). P.A.G. and R.F.A. were concordant with morphologic findings in 69% and 63% of bicuspid valves, respectively, that were interpretable by echocardiography. Of tricuspid valves interpretable by echocardiography, their rates of concordance were 67% and 65%, respectively. In 62% of interpretable echocardiograms, the 2 readers agreed in their interpretation of aortic valve structure (kappa test = 0.20).
| Echocardiographic Interpretation | Morphologic Interpretation ⁎ | ||||||||
|---|---|---|---|---|---|---|---|---|---|
| Unicuspid (n = 3) | Bicuspid (n = 51) | Tricuspid (n = 46) | |||||||
| P.A.G. † | R.F.A. † | P.A.G. = R.F.A. ‡ | P.A.G. † | R.F.A. † | P.A.G. = R.F.A. ‡ | P.A.G. † | R.F.A. † | P.A.G. = R.F.A. ‡ | |
| Bicuspid | 1 | 29 | 24 | 15 | 14 | 15 | 6 | ||
| Tricuspid | 1 | 1 | 1 | 13 | 15 | 5 | 28 | 28 | 18 |
| Indeterminate–heavily calcified | 1 | 2 | 1 | 7 | 6 | 2 | 4 | 2 | |
| Indeterminate–poor image quality | 2 | 6 | 1 | 1 | |||||
Stay updated, free articles. Join our Telegram channel

Full access? Get Clinical Tree


