Fig. 7.2 An ECG showing right atrial (RA) enlargement, from a patient with pulmonary hypertension (QRS axis shifted to the right, a dominant R wave in lead V1, repolarization changes [inverted T waves] leads V1–V3 due to right ventricular ‘strain’). Compare with a normal ECG (see Fig. 6.3). The abnormal P wave findings are really quite subtle; there is a peaked P wave in lead II (so-called ‘gothic’ P wave, or P pulmonale). What amplitude of the P wave in lead II constitutes P pulmonale is debatable. The early positive amplitude of the P wave in lead V1 is also increased; an early voltage in lead V1 of ≥ 0.15 mV (i.e. ≥ 1.5 mm) is fairly suggestive. Unfortunately, most patients with RA enlargement do not have these ECG signs, and most patients with these ECG signs do not have RA enlargement.
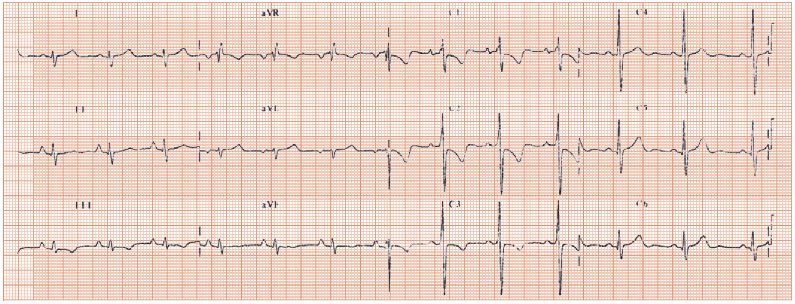
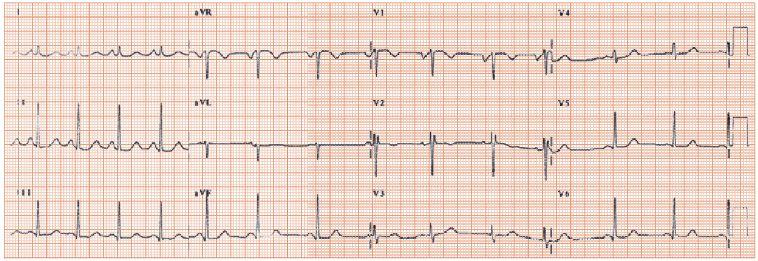
Fig. 7.3 An ECG showing left atrial (LA) enlargement. Aside from the changes to the P wave, the ECG is otherwise normal. There is a wide (though surprisingly not bifid) P wave seen in lead II, and a large late negative deflection in the P wave in lead V1. This comes from a patient with severe isolated mitral stenosis, with a very large LA.
The P wave shape is altered in atrial enlargement (though the relationship between ECG and cardiac ultrasound findings is not close) and arrhythmias. The normal P wave is the sum of the right and left atrial depolarization vectors (Fig. 7.1a,b) and is best examined in lead II and V1:
Stay updated, free articles. Join our Telegram channel

Full access? Get Clinical Tree


