This report determines if the classic Romhilt–Estes score would predict better if points for its components were determined using a Cox hazard model and if the Cornell voltage criteria should replace the original criteria. Of the 20,903 subjects, the mean age was 43 ± 10 years and 90.6% were men. The mean follow-up for the population was 17 years, with 881 cardiovascular deaths; they were tested from 1987 to 1999 and followed until 2013. The new score was created with multipliers based on the Cox hazards of its elements with age bracket and gender included. The Cornell criteria were analyzed individually using Cox hazards with and without adjustments for age, gender, and African-American ethnicity and subsequently incorporated into the new score for analysis. For the new score, all 7 components were significant predictors of cardiovascular mortality with gender producing the greatest hazard ratio (HR) and left axis deviation and QRS duration >110 ms producing the lowest. For the original Romhilt–Estes score, 367 patients (1.8%) met the “definite” cutoff and had an HR of 5.6 (95% confidence interval 4.3 to 7.1). For the new score, 208 patients (1.0%) met the “definite” left ventricular hypertrophy cutoff and had an HR of 13.6 (95% confidence interval 10.8 to 17.3). The Romhilt–Estes had an area under the curve of 0.63, whereas the new score and new score with Cornell voltage both had an area under the curve of 0.7. In conclusion, our modified Romhilt–Estes score with new multipliers and without voltage criteria outperformed the original score.
Voltage criteria for R and S wave amplitude have traditionally been believed to be important predictors of cardiac hypertrophy and prognosis. In a previous report, we examined 17 criteria for electrocardiographic left ventricular hypertrophy (ECG-LVH) and demonstrated that those based only on R and S wave amplitudes conferred minimal risk of cardiovascular (CV) mortality except for the Cornell classification. Additionally, composite criteria such as the Romhilt–Estes score and the Framingham score held the most prognostic value. However, the original Romhilt–Estes study gives no rationale as to the assignment of the point score multipliers for its elements. These observations have led us to develop a modified score which incorporates age, gender, and the prognostic components of the Romhilt–Estes score and compare its prognostic capabilities to the original point scores.
Methods
In our retrospective study, the initial electrocardiogram obtained at the Veterans Affairs Palo Alto Health Care System on patients <56 years from 1987 to 1999 was considered. The MUSE computerized ECG system and 12SL automated analysis program were used (GE Healthcare, Wauwatosa, Wisconsin). Electrocardiograms were ordered at the discretion of health care providers and were usually obtained to establish a baseline as part of routine medical evaluations.
Of these 21,169 electrocardiograms, those obtained from intensive care units (0.4%) and those with atrial fibrillation (0.6%), pacemakers (0.1%), Wolff-Parkinson-White pattern (0.2%), and acute myocardial infarction (0.1%) were excluded. After these exclusions, the target population consisted of 18,941 men and 1,962 women aged between 20 and 55 years.
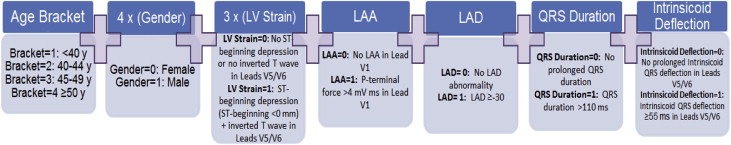
The original Romhilt–Estes point score consists of the following components: left ventricular (LV) strain pattern, left atrial abnormality, left axis deviation (LAD), QRS duration, intrinsicoid QRS deflection, and voltage criteria. The Romhilt–Estes score considers a score of ≥4 points to be probable LVH and ≥5 points to be definite LVH, and both cutoffs were used for our analysis. Additionally, each component of the Romhilt–Estes point score was analyzed. The prevalence of the QRS duration, LV strain, and intrinsicoid QRS deflection components, previously based on visual analysis, were modified to account for the increased accuracy possible with computerized measurements and make the prevalence of the criteria similar to the original studies. These modifications were included in our newly developed score. QRS prolongation was redefined from ≥90 to >110 ms, decreasing the prevalence from 57.4% to 6.0%. Likewise, LV strain was redefined from a cutoff of ST depression ≥1 to <0 mm, increasing the prevalence from 0.4% to 3.6%. Intrinsicoid QRS deflection was redefined from ≥50 to ≥55 ms, decreasing the prevalence from 6.2% to 2.3%. Additionally, the Cornell voltage was analyzed individually for risk of CV mortality by calculating hazard ratios (HR) with adjustment for age, gender, and African-American ethnicity. It was then incorporated into the newly developed score to create a new score with Cornell voltage. The cutoffs for these 2 new scores were chosen on the basis of the prevalence of the original Romhilt–Estes score “probable” and “definite” classifications.
The primary end point was death from CV causes, defined according to the Ninth International Statistical Classification of Diseases (ICD-9) code numbers 390-459. The California Health Department Service and Social Security Death Indexes were used to ascertain the vital status of each patient as of April 2013. Accuracy of all causes of death was confirmed using the Veterans Affairs computerized medical records by 2 physicians blinded to the ECG results. The health care records were used to specify CV cause of death.
NCSS software 9 (NCSS, Kaysville, Utah) was used for the transformations and most of the statistical analyses. We tested the Cox proportional hazard assumption using the Schoenfeld residual method. A p value <0.05 was considered to be statistically significant and all continuous variables are presented as mean ± standard deviation.
A weighted score was developed including age, gender, and the aforementioned components of the Romhilt–Estes score. Age was converted to brackets from 1 to 4 using quartiles on the basis of population prevalence (1 = <40, 2 = 40 to 44, 3 = 45 to 49, and 4 = ≥50) for scaling purposes. Relative weighting of the variables was accomplished by dividing the smallest HRs into the largest ( Figure 1 ). The predictive value of the developed scores, new score, and new score with Cornell was tested by Cox hazards. Receiver operating characteristic curves of the score with CV death as the outcome were also computed.
Results
The overall population characteristics can be found in Table 1 . There were 906 (4.3%) patients who met the “probable” LVH Romhilt–Estes cutoff, and 367 patients (1.8%) who met the “definite” LVH Romhilt–Estes cutoff ( Table 2 ).
| Variable | Cohort | Male | Female |
|---|---|---|---|
| Composition | 100 | 90.6 % | 9.4 % |
| Age (years) | 43 ± 8 | 44 ± 8 | 40 ± 10 |
| Height (m) | 1.76 ± 0.09 | 1.77 ± 0.08 | 1.64 ± 0.08 |
| Weight (kg) | 85.1 ± 18.9 | 86.5 ± 18.4 | 71.1 ± 18.2 |
| Body Mass Index (kg/m 2 ) | 27.6 ± 5.8 | 27.7 ± 5.7 | 26.5 ± 6.7 |
| Heart rate (beats/min) | 74 ± 15 | 74 ± 15 | 72 ± 14 |
| African American | 16.4 % | 16.5 % | 15.6 % |
| Other | 83.6 % | 83.5 % | 84.4 % |
| Annual All Cause Mortality | 1.24 % | 1.34 % | 0.34 % |
| Annual Cardiovascular Mortality | 0.25 % | 0.28 % | 0.05 % |
| Score | HR | CI | Prevalence | AUC | p-value | Sensitivity | Specificity |
|---|---|---|---|---|---|---|---|
| Original Romhilt-Estes | – | – | – | 0.63 | – | – | – |
| Original Romhilt-Estes ≥ 4 | 4.2 ∗ | 3.5-5.1 ∗ | 4.3 % | – | <.001 | 14 % | 96 % |
| Original Romhilt-Estes ≥ 5 | 5.6 ∗ | 4.3-7.1 ∗ | 1.8 % | – | <.001 | 8 % | 99 % |
| Modified Romhilt-Estes Score | – | – | – | 0.72 | – | – | – |
| Modified Romhilt-Estes Score ≥ 11 | 10.4 | 8.7-12.6 | 2.2 % | – | <.001 | 15 % | 98 % |
| Modified Romhilt-Estes Score ≥ 12 | 13.6 | 10.8-17.3 | 1 % | – | <.001 | 9 % | 99 % |
| Modified Romhilt-Estes Score Cornell | – | – | – | 0.72 | – | – | – |
| Modified Romhilt-Estes Score Cornell ≥ 11 | 10.4 | 4.9-7.2 | 2.3 % | – | <.001 | 15 % | 98 % |
| Modified Romhilt-Estes Score Cornell ≥ 12 | 13 | 1.1-2.0 | 1.2 % | – | <.001 | 9 % | 99 % |
In a previous study, commonly used voltage criteria were deemed to be weak predictors of CV mortality. Because of this, when developing the new score, all Romhilt–Estes components except voltage were included in a Cox proportional hazard analysis along with age and gender. They are predictive in the following order: gender, LV strain, left atrial abnormality, intrinsicoid QRS deflection V5/V6 ≥55 ms, age, QRS duration >110 ms, and LAD ≥30. On the basis of these HRs, points were assigned to each component. Gender received 4 points, LV strain received 3 points, and all other components received 1 point. Because age was stratified, the first age bracket (<40) received 1 point with each ascending bracket receiving 1 additional point ( Table 3 ). Cornell voltage criteria were a strong predictor of CV death, displaying an HR of 4.5. A further analysis showed a greater prevalence of ECG abnormalities in the Cornell-positive versus the Cornell-negative classifications. After adjusting for the ECG findings in a Cox model, the HR of the Cornell voltage decreased from 4.5 to 2.1 ( Table 4 ). Additionally, when the Cornell voltage was included in the score, its individual HR decreased to 1.5.
| Prevalence | HR | CI | Points | |
|---|---|---|---|---|
| Modified Romhilt-Estes Score | ||||
| Left ventricular strain pattern ∗ | 3.6 % | 3.8 | 3.1-4.7 | 3 |
| Left Atrial Abnormality † | 2.2 % | 2.1 | 1.7-2.9 | 1 |
| Left Axis Deviation ≥ -30 | 4.2 % | 1.5 | 1.2-1.8 | 1 |
| QRS duration > 110 ms ‡ | 6.0 % | 1.5 | 1.2-1.8 | 1 |
| Intrinsicoid QRS deflection V5/V6 ≥ 55 ms § | 2.3 % | 2.0 | 1.6-2.7 | 1 |
| Age<40=1 point, Age 40-44=2 points, Age 45-49=3 points, Age>50=4 points | 1.6 | 1.5-1.7 | 1 | |
| Male | 90.6 % | 4.6 | 2.8-7.4 | 4 |
| Modified Romhilt-Estes Score With Cornell voltage | ||||
| Left ventricular strain pattern ∗ | 3.6 % | 3.6 | 2.9-4.4 | 3 |
| Left atrial abnormality † | 2.1 % | 2.1 | 1.6-2.7 | 1 |
| Left axis deviation ≥ -30 | 4.2 % | 1.4 | 1.1-1.8 | 1 |
| QRS duration > 110 ms ‡ | 6.0 % | 1.4 | 1.2-1.8 | 1 |
| Intrinsicoid QRS deflection V5/V6 ≥ 55 ms § | 2.3 % | 2.0 | 1.5-2.6 | 1 |
| Age<40=1 point, Age 40-44=2 points, Age 45-49=3 points, Age>50=4 points | 1.6 | 1.5-1.7 | 1 | |
| Male | 90.6 % | 4.6 | 2.9-.5 | 4 |
| Cornell | 2.2 % | 1.5 | 1.1-2.0 | 1 |
Stay updated, free articles. Join our Telegram channel

Full access? Get Clinical Tree


