Myocardial Ischemia and Necrosis
9.1. Introduction
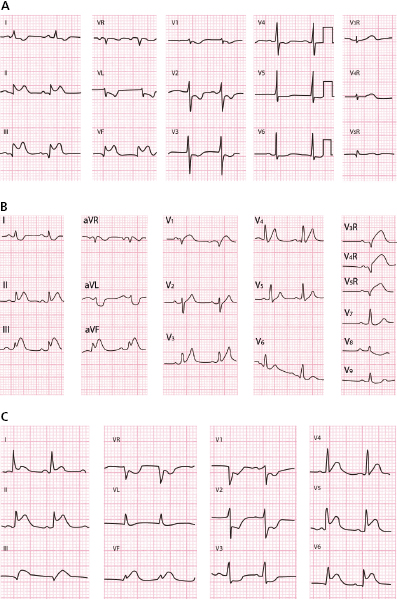
- Table 9.1 shows the various clinical presentations with ECG abnormalities due to myocardial ischemia and/or necrosis.
- These ECG disturbances occur mainly in the T wave, ST segment, and the QRS complex.
- Myocardial ischemia can also alter the P wave and other ECG parameters, such as the PR and QT intervals. In fact, the first disturbance due to ischemia is a delay in repolarization in the ischemic tissue, which can originate a lengthening of the QT interval. However, this is usually very difficult to recognize because we do not have the baseline value.
- This ischemia can provoke all types of arrhythmias and is the main cause of SD. We will review these types of arrhythmia at the end of the chapter. In addition, some of these aspects will be briefly discussed in the section on arrhythmias (Chapters 11–13).
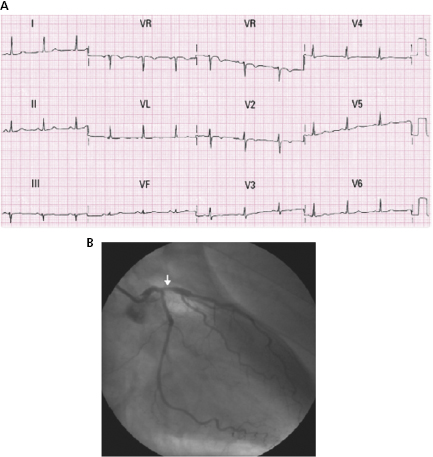
- Ischemia may originate ECG abnormalities due to reduced coronary blood flow or increased blood demand. We discuss especially the ECG abnormalities caused by reduced blood flow due to coronary occlusion produced by atherothrombosis in patients with a narrow QRS. In the acute phase, this includes acute coronary syndrome (ACS), of which there are two types depending on the presence of ST elevation, and in the chronic phase it includes infarction with or without a Q wave. [A]
- ECG abnormalities due to increased blood demand usually present clinically as exercise angina or its equivalent (Table 9.1). [B]
- We will briefly mention ECG abnormalities in patients with wide QRS and other confusing factors (left ventricular hypertrophy), as well as ACS not due to atherothrombosis.
- For more information especially on these aspects, we will refer first and mainly to cases with narrow QRS (Bayés de Luna, 2012a).
Table 9.1 Clinical settings due to myocardial ischemia and ECG abnormalities
|
9.2. ACS with ST Elevation (STEACS)
This is caused by total occlusion, or in the hyperacute phase sometimes subtotal occlusion of a coronary artery due to atherothrombosis with transmural involvement. This process must be treated immediately with percutaneous coronary intervention (PCI). If this is not possible, fribrinolysis should be used to avoid extensive infarction.
This clinical syndrome due to acute ischemia, with occluded-near occluded artery with transmural involvement that presents an ST elevation in its evolving phase as a more clear ECG manifestation, is named ST elevation ACS (STEACS). However, it has to be understood that in the evolving process of STEACS, other ECG patterns may be present at different moments of evolution. We call them atypical patterns, which may be confused with ECG patterns of no ST elevation ACS (NSTEACS). It is important to know this for the better management of each case (see atypical patterns of STEACS).
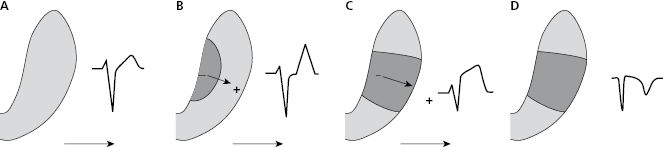
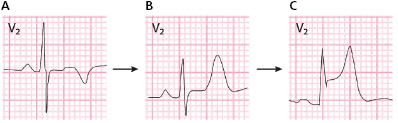
9.2.1. Evolutive ECG Abnormalities [C]
The successive degrees of ischemia that appear after total occlusion of a coronary artery in ACS-STE are accompanied of different ECG patterns (Fig. 9.1). First, in the hyperacute phase occlusion originates a predominantly subendocardial ischemia: a high, and sharp T wave (B). Next, the ischemia, which is now more severe, becomes transmural: ST elevation (C). Finally, if the occlusion is not successfully treated or spontaneously resolved, a necrosis pattern may appear: necrosis Q wave and negative T wave (D).
9.2.2. Electrophysiological Mechanisms of Typical ECG Patterns during the Acute Phase of STEACS
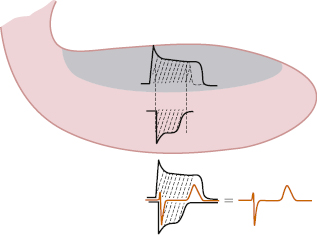
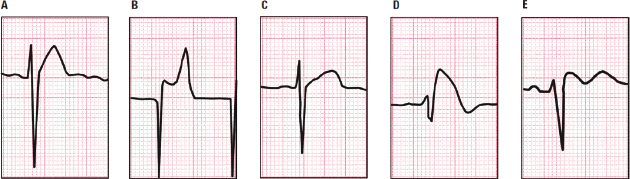
9.2.2.1. Origin of the High, wide T Wave
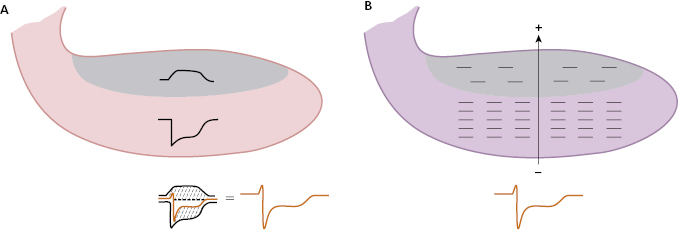
The initial changes in the T wave into wider, more symmetrical morphology, and a generally higher and more peaked wave in the hyperacute phase of STEACS, are due to subendocardial ischemia (A). This may be explained by two mechanisms: (1) the sum of TAP of the subendocardium and subepicardium and (2) the formation of a vector of subendocardial ischemia that moves away from the ischemic zone. [D]
A. TAP Sum (Fig. 9.2)
The high, peaked T wave are explained by changes that occur in the second part of repolarization. This occurs because the TAP in the subendocardial zone, which is the first to suffer ischemia because it is more poorly perfused than the subepicardial zone (e.g. terminal perfusion, etc.), is prolonged more than the TAP in normal circumstances (see the normal endocardial TAP, pointed in B and C). However, it conserves the same morphology if the ischemia is not very severe or was already previously present in the subendocardial zone. Consequently, the sum of the two TAPs, one positive and longer (subendocardial) and the other negative and shorter (subepicardial) explain, according to Ashman (Fig. 2.4), the presence of a higher, wider T wave and/or symmetrical T wave. This is because the area it encompasses is greater, but without apparent changes in the ST segment, because the morphologies of the two TAPs in the initial phase (as we have just explained) are usually the same (Fig. 9.2A).
However, when the subendocardial ischemia is more severe but still is not transmural, the shape of subendocardial TAP is different (lower area) and the sum of both TAP may then originate an ECG pattern with high T wave and some degrees of ST depression (see Fig. 9.2B) (Birnbaum et al., 2012; Bayés de Luna, 2012a).
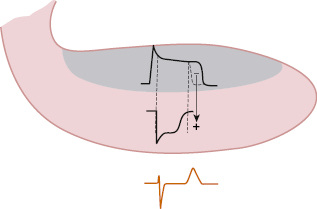
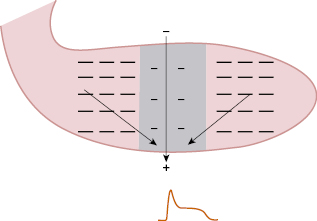
B. Ischemic Vector (Fig. 9.3)
Because repolarization is longer in the ischemic subendocardium, subepicardial repolarization finishes beforehand. In this ischemic subendocardial zone with remaining negative charges that are not repolarized, an ischemia vector is generated that moves to the already-repolarized area of the subepicardium. The head of this vector faces the subepicardium which is already repolarized (+), while the subendocardium still presents negative changes as the TAP of the subendocardium is not yet complete. This bigger area of subendocardial TAP which is still not repolarized explains the increase in voltage in the T wave, without, in general, (see before) changes in the first part of repolarization (ST segment).
In addition, due to lengthening repolarization, the QT interval is also longer, but this parameter is more difficult to evaluate because we do not generally know its value before the appearance of ischemia.
9.2.2.2. Origin of ST Elevation [E]
Ischemia quickly becomes transmural and the ECG shows a change typical of STEACS, ST elevation, often known as the pattern of subepicardial injury, but this is wrongly named, because this pattern appears when acute ischemia is of a higher degree (what was termed injury) and become transmural.
This transmural severe acute ischemia in the surface ECG (ST elevation) appears only during systole, already at the end of QRS, because the ECG recording devices are designed based on the isoelectric line being stable during diastole.
The mechanisms that explain the appearance of ST elevation are as follows:
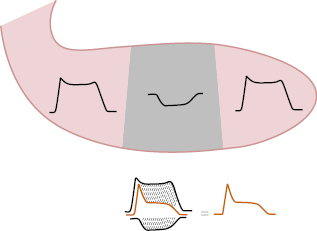
A. Sum of TAP in the Transmurally Affected Zone with TAP in Neighboring Areas (Fig. 9.4)
The transmurally affected area presents a TAP with a shorter and slower phase 1, and a smaller area because it presents a degree of depolarization in the diastole and thus its DTP is closer to zero, explaining the formation of what we call a ‘poor quality’ TAP. The sum of this abnormal TAP, which, according to Ashman (1941) is negatively recorded because the exploratory electrode located in this area faces the most negative areas of the neighboring zones, with a normal TAP in the healthy neighboring zones, explains the ST elevation pattern.
B. Formation of the Severe Transmural Ischemic Vector (Classically Named Injury Vector) (Fig. 9.5)
The transmural zone with severe ischemia presents fewer negative charges than the rest of LV and therefore are relatively positive. Consequently the flow of the current generated between the two zones which comes from the most negative part to the least negative part (the ischemic one proportionally positive) originates a vector, of severe transmural isquemia called the injury vector, which is directed to the subepicardium. An electrode placed in the subepicardium records this in the form of ST elevation already from the end of QRS (end of depolarization). On the contrary, the ischemic vector of subendocardial ischemia (peaked T wave) is recorded only in the second part of repolarization (see before).
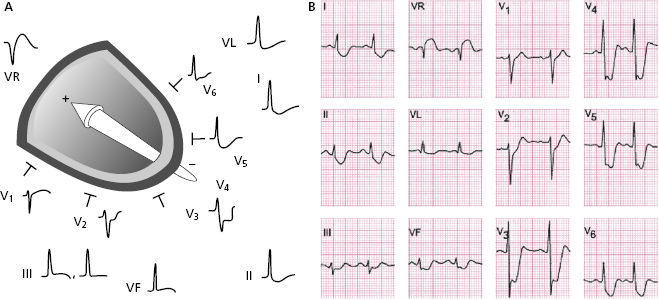
9.2.3. Electrocardiographic Diagnosis
9.2.3.1. Diagnostic ECG Criteria in STEACS
The key ECG criteria are represented by ST elevation, and hence the name ACS with ST elevation (STEACS)*.
9.2.3.1.1. ST Elevation Due to Ischemia
- Typical pattern. New elevation of the ST segment in at least two continuous leads at the level of the J point and ≥1 mm in all leads except V2–V3, where the new elevation must be >2 mm in men (>2.5 mm in younger than 40 years) and ≥1.5 mm in women (Thygessen, 2012). The elevation and depression in the ST segment (see later) may also be measured several ms (20, 40, 60, etc) from the J point. In these cases the value of an abnormal shift is different. The elevation is measured from the level above the PR segment and depression from the lower level. If the PR segment is down-sloping, it is measured from the start of QRS (Fig. 4.12). Figure 4.9 shows an example of how the ST shifts in STEACS are measured (Bayés & Fiol-Sala, 2008).
- Evolution of ST elevation in STEACS. Before the current treatment (PCI) or, when not possible, fibrinolysis, the evolution of STEACS almost always evolves to Q-wave MI with negative T wave (intraventricular pattern due to electrical window) effect (see Figs 9.30 and 9.31), with a considerable loss of myocardial mass that may be expressed by a reduction in the ejection fraction (EF) from 10 to more than 20 points.
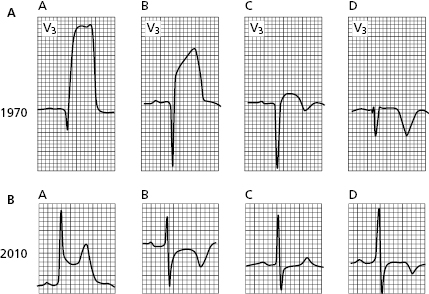
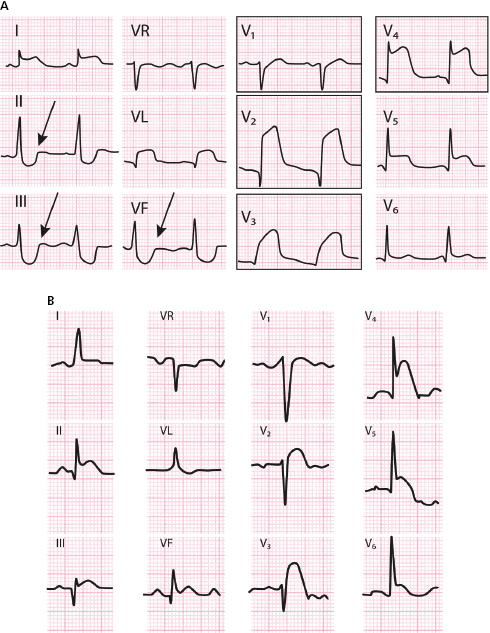
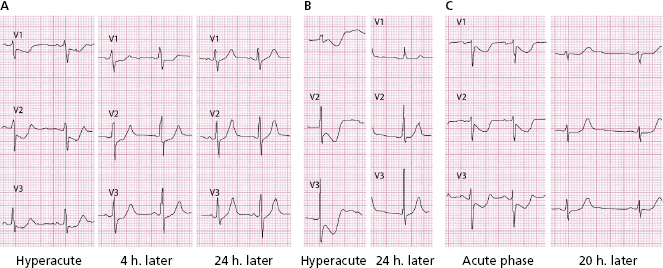
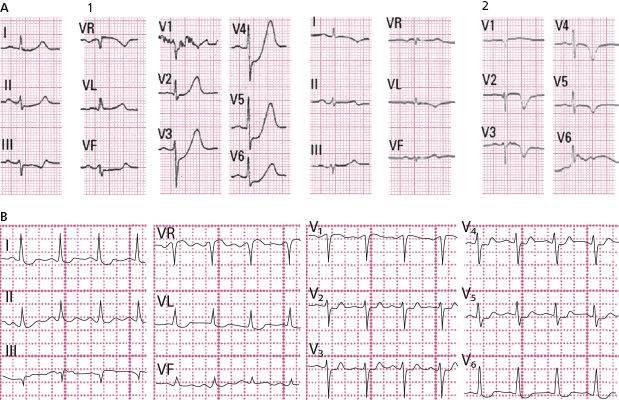
Figure 9.6A shows a typical example of this in a patient with proximal left anterior descending coronary artery (LAD) occlusion who suffered acute infarction in the 1970s. See the evolution over a 1-month period in which a necrosis Q wave and a negative T wave appear. This negative T wave is not indicative of subepicardial ischemia, but rather is a postischemic pattern (electric window effect) (see before) (see Figs 9.30 and 9.31).
Today this situation is very different. In the ECG in Figure 9.6B, we see a patient with a similar previous STEACS (A) in whom an emergency PCI was performed to avoid infarction. See the negative T wave of reperfusion (post-ischemic T wave) (B). A few hours later the patient presented once again with pain, and the ECG pseudonormalized (C), suggesting the stent thrombosis. A new PCI allowed the artery to be opened and the infarction was avoided (aborted infarction) (D), with a negative T wave appearing once again. The entire process took place in less than 24 hours.
Although this clinical course is seen in countries that have ideal conditions for optimal treatment of ACS, there are still many parts of the world, especially in developing or undeveloped countries, where neither emergency PCI nor even sometimes fibrinolysis can be used to treat STEACS.
Persistent ST elevation (for days), which rarely occurs with today’s treatment, is a sign of poor prognosis and can be a marker for cardiac rupture or ventricular aneurysm.
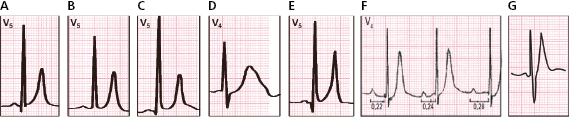
- The importance of ST to evaluate the degree of ischemia. ST elevation allows the severity of ischemia to be quantified. According to the Birnbaum–Sclarovsky grading system (1993), severity increases proportionally as ST elevation pulls the S upward. See a typical example of maximum grade ischemia in Figure 9.7. [G]
- The importance of ST to evaluate the extension of ischemic area. Even with limitations, it may be assumed that the spread of ischemia is considerable if the sum of the shifts in ST (elevation and depression) is ≥15 mm (Hatheway et al., 1998).
- Evolution of ST elevation in STEACS. Before the current treatment (PCI) or, when not possible, fibrinolysis, the evolution of STEACS almost always evolves to Q-wave MI with negative T wave (intraventricular pattern due to electrical window) effect (see Figs 9.30 and 9.31), with a considerable loss of myocardial mass that may be expressed by a reduction in the ejection fraction (EF) from 10 to more than 20 points.
9.2.3.1.2. Other Electrocardiographic Patterns that may be Seen in STEACS that are useful in the Diagnosis and prognostic Evaluation
We refer to the presence of mirror pattern and atypical electrocardiographic patterns.
A. Mirror Patterns [H]
In the acute phase of STEACS mirror patterns may appear (ST depression) in opposite leads.
The correlation of the leads with ST elevation and mirror patterns allow, in cases of LAD occlusion (ST elevation in precordial leads), the site of occlusion to be located (Fig. 9.8). In cases of ST elevation in II, III and VF (right coronary [RC] or circumflex [CX] occlusion), this correlation allows the occluded artery to be identified (Fig. 9.11).
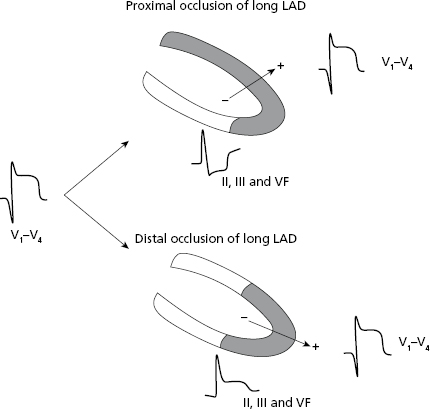
Locating the site of occlusion in LAD. (Figs 9.8–9.10): In ACS due to LAD occlusion and ST elevation in precordial leads, the mirror pattern allows the site of occlusion to be located (Figs 9.8–9.10). If the occlusion is high, proximal to the first diagonal (DI), and the LAD is long, wrapping the apex which is something that frequently occurs, the vector of severe transmural ischemia (injury vector) moves upward (↑ of ST in V2-V4-5) and from II, III, and VF we see its tail. Thus, an ST depression is recorded in the inferior leads (Fig. 9.10A). If the occlusion is also proximal to the first septal (SI), ST would also be elevated in V1 (Bayés & Fiol-Sala, 2008).
However, if the occlusion is distal to the first diagonal (Figs 9.8 and 9.9), the vector of severe ischemia (injury vector) would also be directed forward but downward instead of upward, and thus II, III, and VF would record an isoelectric or positive ST segment (Fig. 9.10B).
It is important to remember the rare cases of total occlusion of the left main trunk (LMT) that arrives alive to the hospital, present STEACS resembling proximal LAD occlusion to D1 and S1. Very frequently in these cases RBBB+LAH appear, that sometimes may make it difficult to evaluate the ECG changes.
The hemodynamic presentation in total occlusion of LMT is much serious that in LAD proximal occlusion. Approximately 50% of patients die from cardiogenic shock (Fiol et al., 2012). Later on we will see that in most cases LMT involvement is shown by subocclusion, not total occlusion, originating NSTEACS, with a depression of ST in seven or more leads.
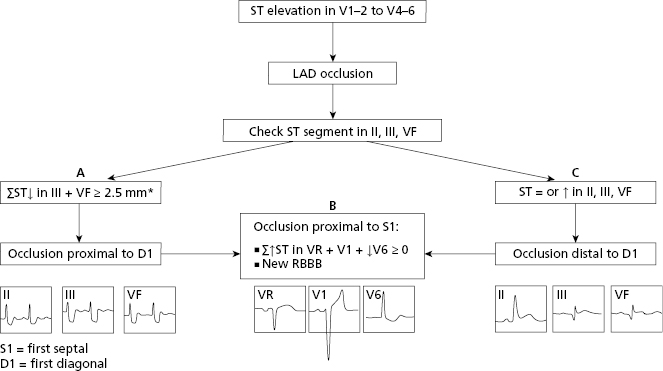
In conclusion, the algorithm of Figure 9.9 can be used to locate the site of occlusion in the LAD in the case of STEACS (Fiol et al., 2009). We must look at (1) the appearance of ST in II, III, and VF to determine if the occlusion is proximal or distal to D1 and (2) whether occlusion is proximal to the first septal (S1) (Fig. 9.9B). Figure 9.10 shows the ECG in two cases of LAD occlusion, one proximal and one distal to D1.
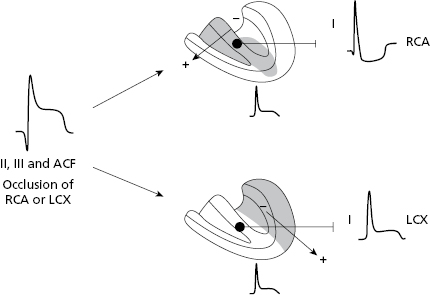
CX occlusion versus RC occlusion in the case of ST elevation in II, III, and VF (Fig. 9.11–13): In ACS with ST elevation in II, III, and VF the occluded artery is RC at the proximal or distal level if a depression in the ST segment is seen in lead I. This occurs because the severe ischemia vector (injury vector) is directed more toward the right since the affected area in RC occlusion is located more in this zone (Figs 9.11 and 9.13A and B). By contrast, if occlusion is in the CX artery, the severe ischemia vector (injury vector) is directed more to the left because it is the most affected area and then in lead I we may see ST elevation (Figs 9.11 and 9.13C).
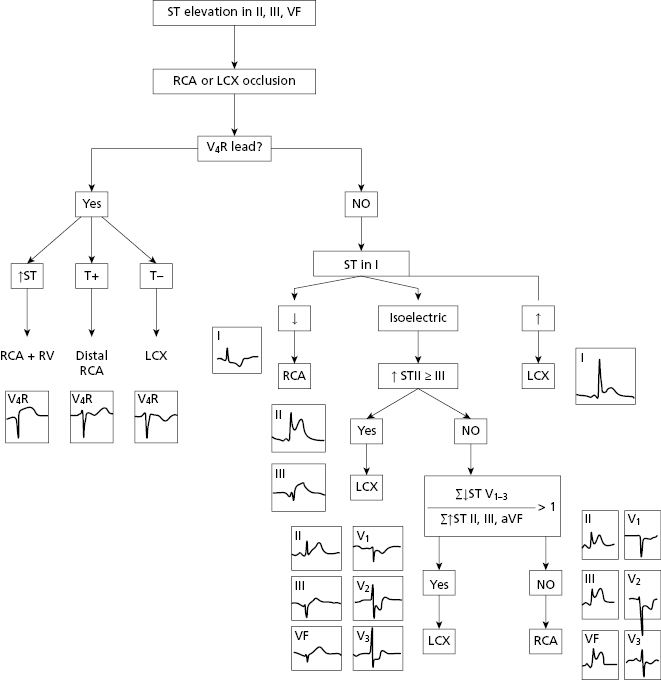
In case of doubt or when the ST is isoelectric, we may use other criteria to identify the culprit artery (Fig. 9.12) (Fiol-Sala et al., 2004). This figure shows the successive steps that allow the location of the involved artery with high SP and SE, in case of STEACS with ST elevation in II, III and VF.
B. Atypical Patterns of STEACS
In addition to typical patterns of ST elevation, there are some ECG patterns seen in the evolving course of an STEACS considered atypical and that we discuss below (De Winter et al., 2008; Nikus et al., 2010; Bayés de Luna, 2012; Birnbaum et al., 2012). [I]
- STE equivalent (Figs 9.14 and 9.15): Is a mirror image of true STEACS. It corresponds to a mirror pattern of severe transmural lateral ischemia due to occlusion in CX, that originates an ST elevation in the back leads but are recorded in V1–V2 as mirror pattern (ST depression in V1–V2). Often they are considered to be a true ST depression and they are incorrectly diagnosed as NSTEACS. The presence of sometimes very small ST elevations in inferior and/or lateral leads and in V7–V9 (Fig. 9.15), and above all to know that this pattern exists, is useful to make the correct diagnosis.
- In the hyperacute phase a final positive T wave is not present at the end of the ST depression (Fig. 9.14). However, a positive T wave usually appears after a few hours coinciding with a decrease in the ST depression. This change of pattern corresponds to the mirror image that appears in the back leads; less ST elevation and the appearance of a negative T (Fig. 9.15). Also often, a high R of lateral infarction appears in V1 that is the mirror pattern of Q in back lead. These considerations are important in making the differential diagnosis with the pattern of severe subocclusion in the proximal LAD (Figs 9.15 and 9.23A).
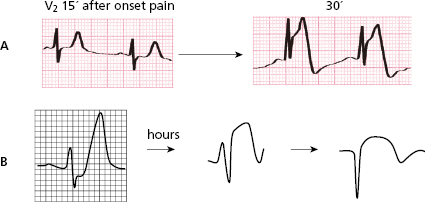
- Peaked, symmetric and tall T wave (Fig. 9.16) may appear in the hyperacute phase of STEACS and is caused by the isolated initial subendocardial ischemia that is present in this phase in STEACS. It occurs usually in case of LAD occlusion, (V1 to V2–V3), but rarely may be seen in cases of LC or CX occlusion.
The presence and duration depends on when the first ECG is taken. It is generally brief (Fig. 9.16A) and usually is recorded during this first ECG because already an ST elevation is present. There are times, however, that the duration is longer and it may rarely (≈2% of LAD occlusion cases) be accompanied by a generally small ST depression, especially if subendocardial ischemia was already present previously (De Winter, 2009) (see before and Fig. 9.16B).
- Deep inverted T wave (Fig. 9.17). This is a pattern often seen in STEACS if the artery, usually LAD, opens spontaneously or under treatment (PCI or fibrinolysis) before the ST elevation pattern evolves to Q-wave MI. Therefore, a deep negative T wave from V1-V2 to V4-V5 may appear, generally with some lengthening of QT, indicating that the artery is more or less open (T wave of reperfusion), although it may close again (Fig. 9.17). In these cases it is necessary to carry out PCI as an urgent, but not emergent, procedure. At this time the negative T wave pattern indicates that there is no active ischemia (no pain). Therefore, this is mainly a reperfusion pattern as seen following fibrinolysis or PCI, or coronary spasm. However, without treatment the process can resume (Fig. 9.17), presenting pseudonormalization or even if angina persists, an ST elevation.
- Peaked, symmetric and tall T wave (Fig. 9.16) may appear in the hyperacute phase of STEACS and is caused by the isolated initial subendocardial ischemia that is present in this phase in STEACS. It occurs usually in case of LAD occlusion, (V1 to V2–V3), but rarely may be seen in cases of LC or CX occlusion.
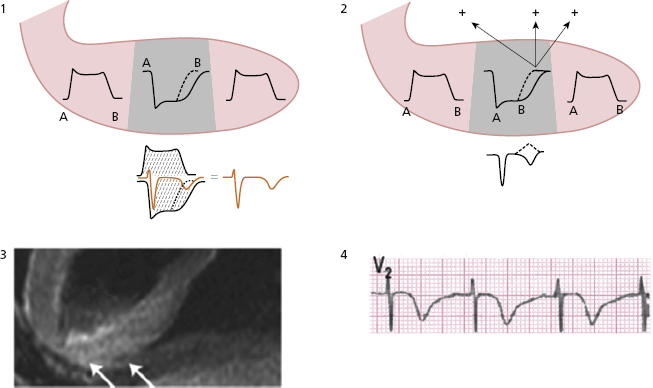
This post-ischemic T wave that appears in the clinical course of STEACS or coronary spasm (see later) occurs because a slower repolarization persists in the affected transmural zone when compared to neighboring areas due to a slowing in the ionic exchange during repolarization (Fig. 9.18). This may be explained (A) (Fig. 9.18-1) by the sum of the longest TAP in the affected transmural zone and the shortest TAP of the neighboring areas, and (B) because a vector is generated in the affected transmural zone in the second part of repolarization (not yet completely repolarized and with a longer TAP) that goes from this to the neighboring areas (vector of ischemia) (Fig. 9.18-2). MRI in small series of these cases has shown transmural edema with the negative T wave disappearing conjointly with the edema (Migliore et al., 2011) (Fig. 9.18-3).
Later in this chapter, we will explain the basis for other negative T waves that appear during the clinical course of ischemic heart disease (e.g. NSTEACS, Q wave infarction) (see Figures 9.25, 9.34, 9.38).
- Other patterns. On rare occasions, a negative U wave may be seen when a negative T wave is pseudonormalized or a residual negative U wave may remain in an aborted STEACS.
9.2.4. Differential Diagnosis [J]
9.2.4.1. Differential Diagnosis of the High, Peaked T Wave of Subendocardial Ischemia
We must remember that the high, peaked T wave in subendocardial ischemia is generally transitory, although some cases of LAD occlusion with persistently high T wave have been described, sometimes with a slight ST depression, that appears in the hyperacute phase of an STEACS (see before and Bayés de Luna, 2012a).
In the chronic phase of lateral infarction RS is sometimes seen in V1–V2 with a high T wave as a mirror pattern of Q and negative T wave that are recorded in direct lateral leads (see Fig. 9.38).
Figure 9.19 shows examples of non-transitory high, peaked T waves which are not due to subendocardial ischemia.
9.2.4.2. Differential Diagnosis in Ischemic ST Elevation [K]
ST elevation can also be seen in certain clinical situations other than the acute phase of STEACS, including normal variants, hyperkalemia, Brugada pattern, etc. (Fig. 9.20). We should remember that in patients with STEACS, if ST persists in the subacute phase, it is a risk marker for cardiac rupture. On the other hand a persistent ST elevation that remains in the chronic phase post-MI, obliges us to rule out ventricular aneurysm (see Fig. 9.45).
9.3. Acute Coronary Syndrome without ST Elevation (NSTEACS)
This syndrome includes the cases of subtotal thrombotic occlusion of one coronary artery without transmural involvement. Only in more serious cases is this indicated an emergent PCI. The myocardial area most affected by hypoperfusion is the subendocardium, although ischemia may often reach patching parts of the rest of the ventricular wall. [L]
ST depression is the most frequent ECG change in the acute phase, starting the depression already at the end of QRS. When the clinical situation improves usually the ECG changes to a flat/mildly negative T wave, or even a normal ECG may be recorded. If angina again appears, the ECG may change from flat/negative T wave to ST depression.
If a patient with suspected NSTEACS arrives at the hospital, already without pain, the first ECG may present a flat or mildly negative T wave, or the ECG is normal or unchanged. The negative T wave is formed in the second part of repolarization.
Patients showing ST depression have a poorer prognosis, especially when ST shows a clear depression in various leads (see later).
We remember that in the evolving phase of STEACS, ST depression may be seen with a tall T wave, or deep negative T wave. The first may occur in the early phase of STEACS before the artery is completely occluded (Fig. 9.16B). The deep negative T wave occurs when an STEACS, usually with treatment, does not evolve to Q-wave MI (pattern C) (see before atypical patterns of STEACS). Also sometimes a clear STEACS with ST elevation become a NSTEACS (ST depression) after treatment that partially opens the artery.
9.3.2. Electrophysiologic Mechanisms that Explain the Patterns of ST depression and Flat Negative T Wave [M]
9.3.2.1. Origin of ST Depression
A. Sum of the TAPs (Fig. 9.21A)
The subendocardium presents an important change in the TAP, with a slower ascent and smaller area with varying length (often longer), due to severe hypoperfusion in a zone that is already poorly perfused. The sum of the TAP of the subendocardium and the remaining areas of LV explains ST depression, sometimes with a final positive T wave.
B. Vector of Severe Subendocardial Ischemia (Injury Vector) (Fig. 9.21B)
Another way to explain ST depression, when severe ischemia occurs in an already poorly perfused area such as the subendocardium, is the presence of a vector of severe ischemia known as an injury vector. An injury vector moves from the most perfused area, the subepicardial zone with the most negative charges, to the least perfused area, the subendocardial zone, which is only partially depolarized and thus presents fewer negative charges and is relatively positive compared to the subepicardium (B). The vector points toward the subendocardium and an ST depression is recorded on the surface of the body.
9.3.2.2. Origin of Flat or Negative T Wave in NSTEACS
The pattern reflects a certain degree of improvement in the subendocardial ischemia in the affected zone in patients who generally no longer present symptoms. Although there is not a clear electrophysiological explanation for this pattern, probably the TAP duration in the ventricular wall is similar, and this may explain why the T wave becomes flat or only slightly negative.
As previously explained, when a flat or negative T wave exists in NSTEACS it is never deeply negative and generally does not appear during an angina crisis (see Fig. 9.25). In the opposite situation, during angina if previous ECG shows a negative T wave, this may evolve into ST depression (see Fig. 9.26). This represents another argument in favor of the belief that a negative T wave is not induced by acute ongoing ischemia.
9.3.3. Electrocardiographic Diagnosis
9.3.3.1. ECG Diagnostic Criteria for NSTEACS [N]
9.3.3.1.1. ST Depression Due to Ischemia
- ST depression, with sometimes a mirror pattern of ST elevation in one or two leads, generally VR and V1, is the most characteristic ECG pattern in NSTEACS.
- ST depression is considered to be indicative of ischemia when the ST depression is new, at J point measures ≥0.5 mm, and is horizontal or descending for at least 80 ms in two contiguous leads (Thygessen, 2012). Many studies have described that this measurement may be performed later than the J point (20, 40 or 60 m). However, then the measurement of abnormal ST is different (Fig. 4.9).
- NSTEACS with ST depression may be categorized into two groups:
A. Extensive Involvement (Circumferential) [O]
(See Figs. 9.22 and 9.23; Nikus et al., 2010; Kosuge et al., 2011.)
- This is usually due to subocclusion of the main trunk (LMT) or two or three proximal vessels. Less frequently it is due to proximal LAD severe subocclusion, and rarely to proximal occlusion of the dominant LCX artery.
- In all cases, ST depression exists in ≥7 leads (for some authors in ≥8 leads). When the subocclusion occurs in the left main trunk (Fig. 9.22) the ST depression in precordial leads does not present a final positive T wave, or it is only minimal. The final positive T wave is usually more evident if the subocclusion is in the proximal LAD or in two to three vessels (Fig. 9.23).
- In all cases ST elevation in VR exists and often in V1; this is more evident in LMT/2–3 vessel disease.
- Differentiating between subocclusion in 2–3 vessels and in proximal LAD (Fig. 9.23) is difficult in the ECG, because in both cases there is ST depression in the right or middle precordial leads. In our experience, patients with subocclusion in 2–3 vessels present more ST elevation in VR than in the isolated subocclusion of proximal LAD, and the final T wave in mid-precordial leads is less evident (Fig. 9.23A and B). Cases of severe subocclusion of the proximal LAD may evolve more often to Q-wave myocardial infarction if not treated in time (Fig. 9.23A), and are equivalents of atypical pattern B2 of STEACS (Fig. 9.16B).
- The differential diagnosis between critical proximal LAD subocclusion and CX occlusion is not easy, especially after the hyperacute phase. In both cases (see before) an ST depression in V1–V3 may be seen, but in LCX occlusion the T wave is usually negative in the hyperacute phase, although in the follow-up a final positive T wave appears as a mirror pattern of evolving lateral MI (Fig. 9.15B). In the critical subocclusion of the LAD the final T wave is positive already in the early phase. This is relevant to evaluating the degree of urgency in performing PCI.
- In all cases ST elevation in VR exists and often in V1; this is more evident in LMT/2–3 vessel disease.
As a summary: If the final positive T wave appears late in the evolving phase of an ACS when the ST depression is not very evident, much probably the occluded artery is the LCX. In case of subocclusion of LAD, the final positive T wave already is present from the first moment, and often evolves to complete occlusion (STEACS and Q wave MI) (compare Figs 9.15 and 9.23A).
B. Regional Involvement (Fig. 9.24)
- Usually there are 1-2 vessels involved.
- The most ECG criteria are the following:
- ST depression in less than seven leads.
- ST elevation in VR, if present, is usually <1 mm
- ST depression in less than seven leads.
- The ST depression may be seen (Pride et al., 2010):
- V1 to V4. In 80% of cases, it is explained by LAD subocclusion. In these cases there is usually, as has been explained in the case of circumferential involvement (Fig. 9.23), a final positive T wave, and in V1 there is nearly no ST depression. There may be slight depression in some leads of the FP. The regional involvement in the case of proximal LAD subocclusion is more frequent than the circumferential involvement already discussed (Fig. 9.23A).
- It should be emphasized that in 20% of patients the presence of ST depression in V1–V4 is due to total CX occlusion, in which case the ECG pattern is equivalent to STEACS (atypical pattern A) (Pride et al., 2010). In this case, the acute phase of ST depression generally occurs without a final positive T wave, at least in V1 and V2, and almost always a slight ST elevation in inferior or lateral leads (Fig. 9.13A) (see before). We have already commented on the differential diagnosis between LCX occlusion (STEACS) and LAD subocclusion (NSTEACS) that often evolves to STEACS (see before).
- In II, III, and VF. Very infrequent. Due to RC/CX subocclusion.
- In V3-V5-6 and some FP leads. Frequently there is 2–3 vessel disease, but it is very difficult to identify the culprit artery, although if ST depression is present in lead I, more frequently the RCA is affected (Fig. 9.24).
- In II, III, and VF. Very infrequent. Due to RC/CX subocclusion.
- V1 to V4. In 80% of cases, it is explained by LAD subocclusion. In these cases there is usually, as has been explained in the case of circumferential involvement (Fig. 9.23), a final positive T wave, and in V1 there is nearly no ST depression. There may be slight depression in some leads of the FP. The regional involvement in the case of proximal LAD subocclusion is more frequent than the circumferential involvement already discussed (Fig. 9.23A).
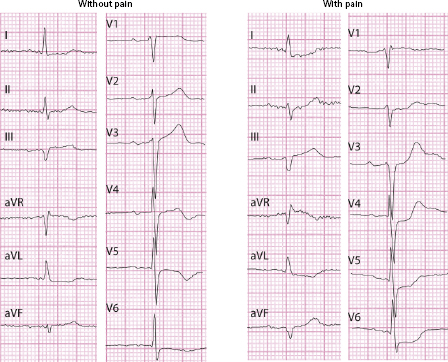
9.3.3.1.2. Flat or Negative T Wave (Figs 9.25 and 9.26) [P]
In NSTEACS, a flat or slightly negative T wave may also be observed, although not generally ≥2 mm:
- The flat or slightly negative T wave in NSTEACS usually appears after the resolution phase of angina. During angina the negative T wave either is not modified, or it is converts into a more or less evident ST depression (Fig. 9.26).
- The symmetrical flat or negative T wave is shallow (<2.5 and usually <1.5 mm) and in general appears in leads with a tall R. However, it may also be seen in V1–V3 and other leads with rS (Figs 9.25 and 9.26).
- In our opinion, the presence of a negative T wave with the nadir measuring ≥1 mm in two contiguous leads with R or R/S ≥1, does not correspond to acute ischemia, as described by Thygessen (2012). However, it may appear immediately after acute ischemia, as occurs with deep negative T waves that appear just after aborted STEACS (post-fibrinolysis, post-PCI) or after coronary spasm.
- We must also remember that a deep negative T wave following a Q wave infarction does not correspond to acute ischemia (electric window effect) (Fig. 9.30A).

Full access? Get Clinical Tree


