Atrial Abnormalities
5.1. Initial Considerations
This concept includes atrial enlargements and atrial blocks. These entities are different, but they are frequently associated and often have a shared ECG pattern.
Interatrial blocks, the only type of block in the atria that are well-known, are characterized in all types of heart block by the following: (1) they may have a transitory appearance; (2) they may appear without an associated pathology to explain the pattern, in this case added atrial enlargement; and (3) they may be provoked experimentally. [A]
Patterns of atrial enlargement are due more to dilation than hypertrophy of the cavity because of the lack of thickness in the atrial wall.
Abnormalities in atrial repolarization are also briefly discussed in this chapter.
5.2. Atrial Enlargements
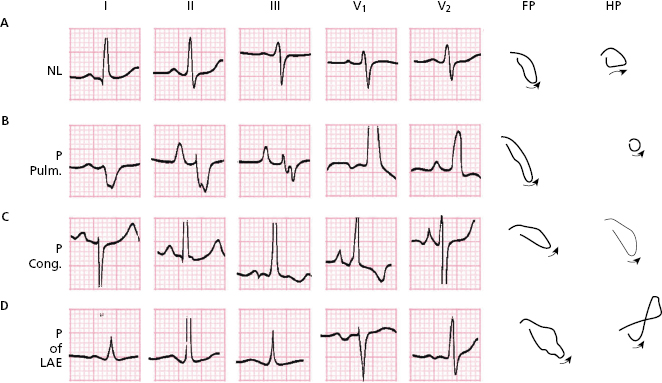
Figures 5.1, 5.2B, and 5.2D show the P wave morphologies in cases of right atrial enlargement (RAE) and left atrial enlargement (LAE) (Bayés de Luna, 2012a).
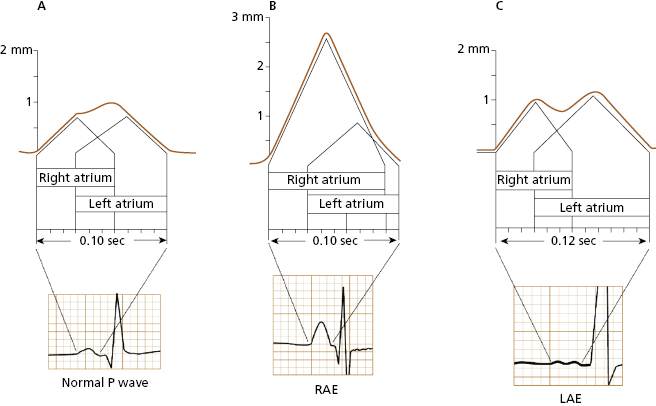
5.2.1. Diagnostic Criteria for RAE (Fig. 5.1B and 5.2B and C)
The right atrium is enlarged mainly in some congenital (Fig. 5.2B) and valvular heart diseases, and in cor pulmonale (Fig. 5.2C).
The most common ECG criteria for the diagnosis of RAE include: [B]
- P wave criteria:
- P wave >2.5 mm in height.
- Positive first part of the P wave in V1 >1.5 mm.
- ÂP to the right in (P pulmonale), and often even to the left (P congenitale) (Fig. 5.2).
- P wave >2.5 mm in height.
- QRS criteria:
- Voltage in V1 < 4 mm
- Voltage ratio V2/V1 > 5
- qr or QR morphology in V1.
- Voltage in V1 < 4 mm
These criteria are very specific, and if they exist they therefore confirm the presence of the pathology in question, but they have low sensitivity. Thus, they are often not present, even when the pathology exists.
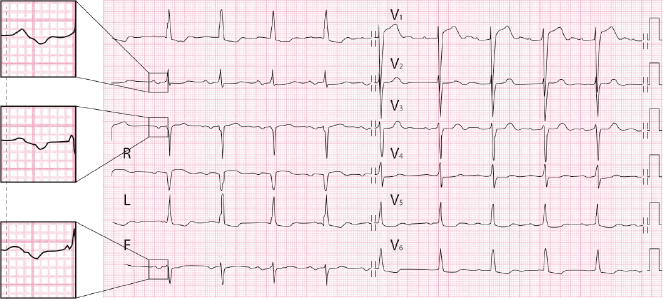
5.2.2. Diagnostic Criteria for LAE (Figs 5.1C and 5.2D) [C]
An enlarged left atrium is mainly found in mitral stenosis and regurgitation, cardiomyopathies, arterial hypertension and ischemic heart disease. Figures 5.1C and 5.2D show examples of ECG changes in the P wave in the context of LAE.
The most commonly used ECG criteria for the diagnosis of LAE, which present generally more specificity than sensitivity, are listed below.
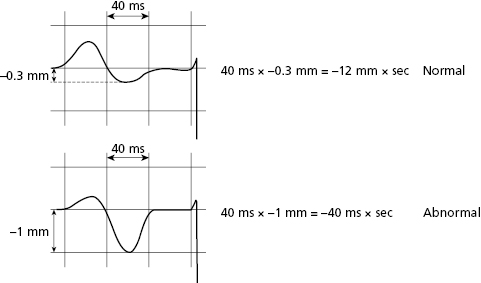
- The Morris index = the duration and depth of the negative part of the P wave in V1 ≥40 ms × −1 mm. Figure 5.3 shows the negative component of the P wave under normal conditions (above) and in cases of LAE (below) in V1. In this example, the negative mode lasts 40 ms and measures −1 mm, strongly indicating LAE.
- P wave duration in I, II and/or III ≥0.12 s + negativity of P in V1 >40 ms.
- P wave ± in II, III, VF. Very specific but with very little sensitivity.
- P wave duration in I, II and/or III ≥0.12 s + negativity of P in V1 >40 ms.
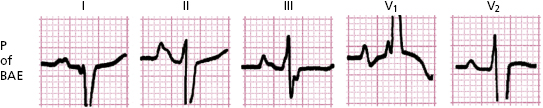
5.2.3. Biatrial Enlargement
The diagnostic criteria are the same as in RAE and LAE, as shown in Figure 5.4.
5.3. Atrial Blocks
5.3.1. Heart Block
Heart block refers to a conduction disturbance or block in any part of the heart (sino-atrial junction, atria, AV junction, and ventricles) in which a stimulus is delayed (first-degree or partial block) or completely blocked (third-degree or advanced block). When a first or third degree block only occurs intermittently, it is referred to as second-degree block.
At the atrial level conduction only disturbances or blocks that occur between both atria (interatrial block), can be detected clearly in the ECG (Bayés de Luna, 2012a).
Furthermore, some abrupt and transitory changes in the P wave morphology that cannot be explained by any other cause (escape or fusion beats, artifacts, etc), and often without the P wave characteristics of interatrial block (see below) can correspond to some type of atrial block usually in the right atrium included in the concept of atrial aberrancy (see Section 10.7.3 in Chapter 10).
5.3.2. Interatrial Block (Fig. 5.5)
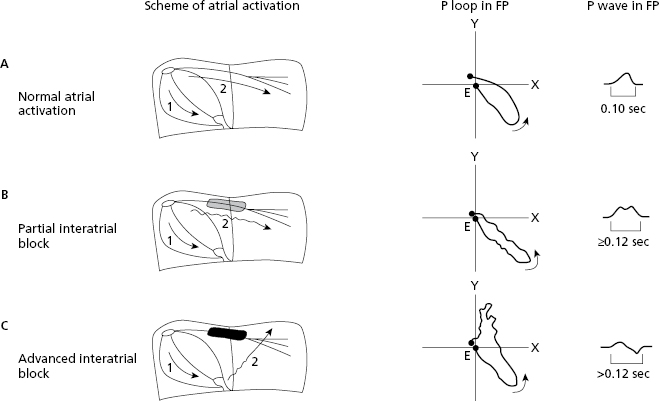
Like all other types of heart block, interatrial block can be classified by three degrees (Bayés de Luna et al., 2012c).
5.3.3. ECG Diagnosis
- First-degree: This type of interatrial block occurs frequently in the elderly (Spodick and Ariyarajah, 2008). The stimulus travels through the Bachmann bundle from the right atrium to the left atrium with a delay. This generates a longer P wave (Fig. 5.5B). LAE is often associated with first-degree interatrial block, but it may also be recorded as an isolated finding. In this case the negativity of the P wave in V1 is usually not as evident as in case of LAE. [D]
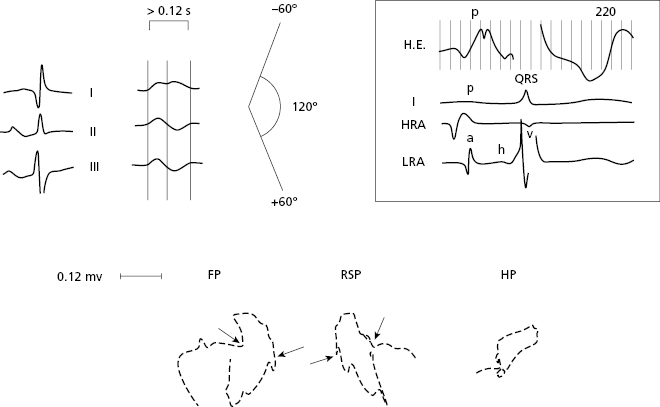
- Third-degree (Figs 5.6 to 5.8): This type of interatrial block is less frequent and is very often associated with LAE, and paroxysmal supraventricular arrhythmia constituting a true arrhythmological syndrome (Bayés de Luna et al., 1985, Conde et al., 2014). [E]
The stimulus is blocked in the zone of Bachmann and reaches the left atrium through a retrograde conduction from the mid-lower interatrial septum (Fig. 5.5C). This explains the presence of the longer P wave and a ± morphology in II, III, and VF, caused by the caudocranial activation of the left atrium. In V1–V3, there is also frequently a P± morphology due to associated LAE (Fig. 5.5C).
- Second-degree: Transitory appearance of first- or third-degree interatrial block (Fig. 5.9B). This very rare pattern may be included in the concept of atrial aberrancy. This means, in the presence of sinus rhythm, an abnormal and transitory activation of some part of the atria; in this case the zone of Bachman’s bundle exists (Fig. 5.9A) [F]
Atrial aberrancy may also present a transient bizarre P wave without the morphology of interatrial block (Fig. 5.9B) (Chung, 1972) (see Section 10.7.3 in Chapter 10) (Bayés de Luna, 2012a).
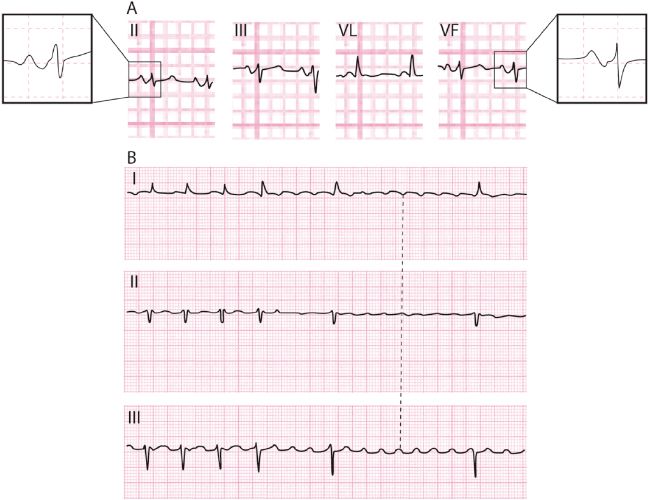
5.4. Atrial Repolarization Abnormalities
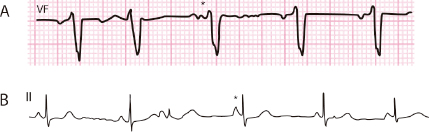
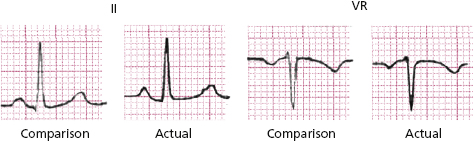
The PR segment depression in II and elevation in VR as an expression of atrial injury (atrial ST-T) is an important abnormality, because it may represent the only ECG abnormality indicating acute pericarditis (Fig. 5.10). [G]
The PR segment can also present changes in atrial infarction, but in this case other parts of the ECG will present abnormalities such as necrosis Q (acute infarction).
The typical morphology of normal atrial repolarization may be seen in cases of sympathetic overdrive (Fig. 4.4).
Self-assessment
A. What are the differentiating characteristics between atrial enlargement and interatrial block?
Stay updated, free articles. Join our Telegram channel

Full access? Get Clinical Tree


