The ECG in Genetically Induced Heart Diseases and Other ECG Patterns with Poor Prognosis
16.1. Concept
There are ECG patterns in sinus rhythm that by themselves, in the absence of current symptoms, indicate heart disease with a poor prognosis generally due to a risk of potentially serious arrhythmia.
Naturally, the presence of active or passive arrhythmia, especially third-degree AV block or VT, already constitute a risk factor. They will not be discussed in this chapter.
These ECG patterns may be classified in two groups: (A) ECG patterns with poor prognosis that are genetically induced; and (B) ECG patterns with poor prognosis that are not genetically induced (Table 16.1).
Table 16.1 ECG patterns with poor prognosis
|
16.2. Genetically Induced ECG Patterns
These patterns are all markers of processes that can give rise to VT/VF and that require ICD implantation (Bayés de Luna, 2011).
16.2.1. Long QT Syndrome
This is a channelopathy (disease of the ionic channels with no structural involvement) due to a slow activation of the K channels and incomplete inactivation of the Na channels. This explains the long QT interval and the tendency for malignant ventricular arrhythmia and sudden death to occur (Moss and Robinson, 1992; Schwartz et al., 1993).
Table 4.2 shows the limits of normal QT according to age and sex. It is important to measure QT in a recording with various leads in order to determine when they start and when they finish (an average of five cycles). QT must be corrected according to the heart rate. Generally, QTc >460 ms is always pathologic (Chapter 4). [A]
16.2.1.1. ECG Patterns
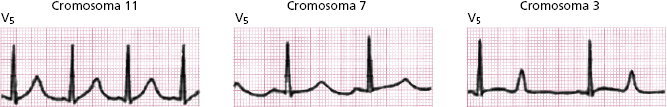
Figure 16.1 shows the most typical ECG morphologies (genotype–phenotype correlation) of the three types of congenital long QT syndrome best studied (I, II, and III) (Zareba et al., 1998; Zareba and Cygankiewicz, 2008).
As seen in Figure 16.2, the presence of ST-T alternance is a very characteristic ECG pattern.
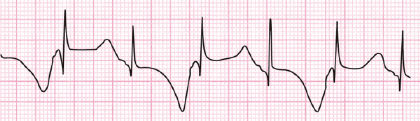
A malignant ventricular arrhythmia is usually torsades de pointes VT, which is often preceded by long and negative T/U waves.
16.2.2. Short QT Syndrome [B]
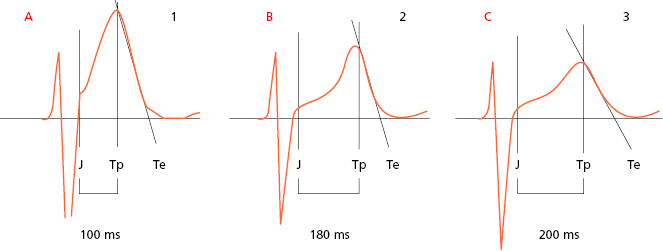
This is a rare channelopathy characterized by the presence of short QT (<300 ms) and some high and symmetrical T waves (Fig. 16.3). It is sometimes associated with atrial fibrillation in young people and with early repolarization.
16.2.3. Brugada Syndrome
This is a genetically induced syndrome (Brugada and Brugada, 1992) due to inactivation in the outflow tract of the RV, of Na channels, with the K current having transitory predominance (Ito). It originates a voltage gradient between the epicardium and the endocardium of this zone in the RV, giving rise to malignant arrhythmia and sudden death (multiform VT/VF).
16.2.3.1. ECG Patterns [C]
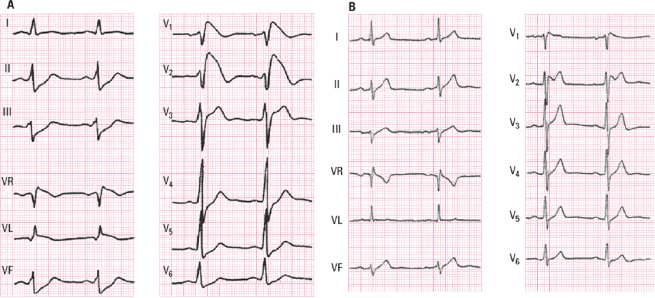
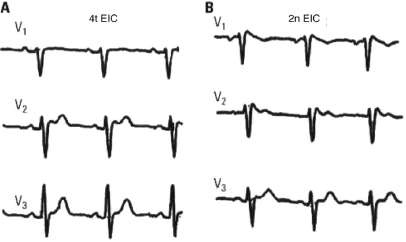
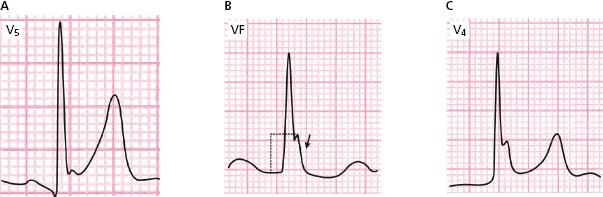
Although the presentation of three ECG patterns has been described, it is currently accepted that there are only two well-defined ECG patterns with characteristic patterns in V1-V3 (Fig. 16.4) (Bayés de Luna, 2012a,b).
- Type I pattern (coved): A rounded ascent appears at the end of QRS with a height that is generally ≥2 mm (dubious cases between 1 and 2 mm) followed by a concave or rectilinear descending curve. May mimic an ACS-STE like pattern in asymptomatic patients. This pattern is the most dangerous which presents as VT/VF (Fig. 16.4A).
- Type II pattern (saddle-back pattern): This presents r’ (sometimes called the J wave) that is rounded and ≥2 mm, followed by a downsloping descending branch that gives way to ST elevation measuring at least 0.5 mm. ST is followed by a T wave that is positive in V2 and varies in morphology in V1 (Fig. 16.4B).
- In both types QRS is longer in V1 than in V6 (Fig. 16.6), as occurs in ARVD. This is not observed in cases with r’ in V1, due to variants of normality, such as pectus excavatum, athletes, or patients with partial RBB.
- Characteristically, the QRS morphology can vary from one intercostal space to another. It is always necessary to record V1-V2 in the second and fourth intercostal spaces (Fig. 16.5).
- The ECG pattern is dynamic and there are various factors behind it (e.g. fever, some drugs) (see www.brugadasyndrome.net/). Drugs that act on the sodium channels (ajmaline or some equivalent) are useful in determining whether the Brugada pattern is revealed or whether a change from type 1 to type II pattern occurs.
- Phenocopies of the Brugada pattern: this term, proposed by Perez Riera and Baranchuk, represents ECG patterns identical to Brugada patterns (Baranchuk, 2013) that are not due to a genetic origin. These patterns appear transiently, usually in relation with environmental factors that preferentially affect RV such as ischemia of RV, tumors, pulmonary embolism, etc. The prognosis of this pattern is not well known; it is most probably different from the true Brugada pattern.
- Type II pattern (saddle-back pattern): This presents r’ (sometimes called the J wave) that is rounded and ≥2 mm, followed by a downsloping descending branch that gives way to ST elevation measuring at least 0.5 mm. ST is followed by a T wave that is positive in V2 and varies in morphology in V1 (Fig. 16.4B).
16.2.3.2. Differential Diagnosis of the Brugada Pattern in the ECG [D]
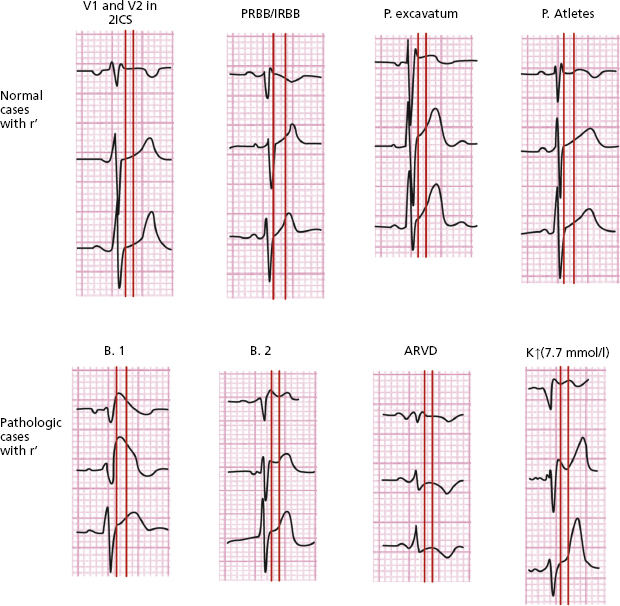
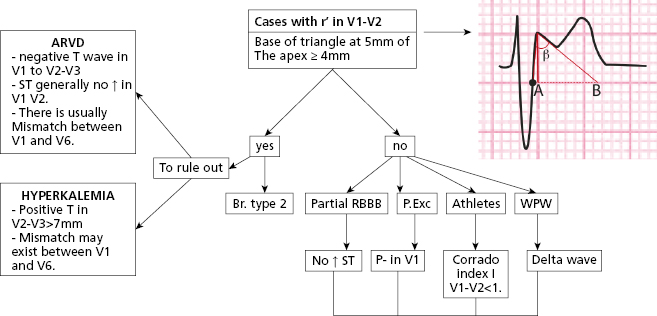
Figure 16.6 shows the differences between different morphologies that present rSr’ in V1. The bottom four patterns are pathologic (Brugada type I and II), and arrhythmogenic RV dysplasia (ARVD); hyperkalemia and the last four are variants on normality (V1 lead located in high position, pectus excavatum, athletes and partial RBBB).
- The differential diagnosis between type II Brugada pattern and other patterns with r’ inV1 (Fig. 16.6) is sometimes very difficult. To evaluate the characteristics of r’ is very important (Bayés de Luna, 2012a). The angle of the ascendant and descendent branch of r’ is wider in the Brugada pattern (Chevalier, 2011). We have proposed the measurement of the base of r’ at 5 mm from the vertex of r’ (AB of Fig. 16.7) that is usually ≥4 mm in the Brugada II pattern and <4 mm in pectus excavatum, partial RBBB and athletes (Bayés de Luna et al., 2012b; Serra et al., 2014). This criterion is easier to measure than the β angle.
- ARVD may present a positive wave in V1 (є wave) that is somewhat separate from QRS and generally without ST elevation.
- In pectus excavatum the P wave is usually negative in V1 and r’ is narrow. This is also seen in athletes and partial RBB.
- Figure 16.6 also shows, in the first vertical line, the differences in duration of QRS between V1 and middle/left leads in the ECG of the two types of Brugada pattern, hyperkalemia and ARVD. This does not occur in the four remaining examples of rSr’ in V1, which are variants on normality. The second vertical line located 80 ms from the first shows how in the two Brugada patterns the curve of S-T in V1–V2 descends, while in athletes, pectus excavatum, and partial RBB it is ascending, at least in V2 (Corrado index) (Corrado et al., 2010; Bayés de Luna et al., 2012b).
- Figure 16.7 shows the algorithm that we consider most useful for this differential diagnosis (Baranchuck et al., 2014).
- ARVD may present a positive wave in V1 (є wave) that is somewhat separate from QRS and generally without ST elevation.
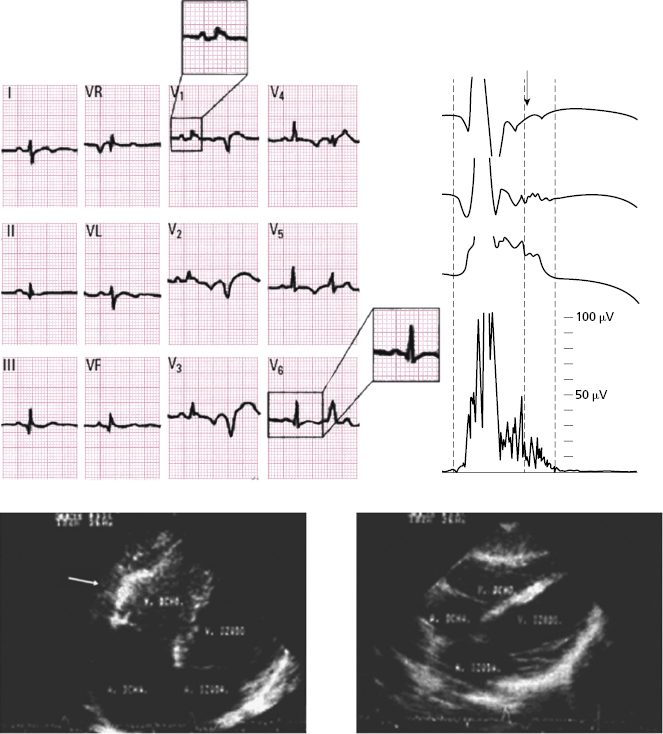
16.2.4. Hypertrophic Cardiomyopathy
- This is a genetic disease characterized by abnormalities in the proteins of the sarcomere, resulting in a disarray of the fibers, LV hypertrophy, and a risk of VT/VF (McKenna, 2002; Maron, 2010).
- The ECG is abnormal in 95% of patients and is sometimes found to be already abnormal before detecting LVH by echocardiography. Unlike long QT syndrome, there is no clear genotype/phenotype correlation. [E]
- Often, a high-voltage LVH pattern with strain exists, that is difficult to differentiate from LVH due to other etiologies.<\bl>
However, two typical patterns may be found: ( A) high voltage R followed by a very negative and peaked T wave (apical hypertrophy) and (B) a fine and sometimes deep Q wave (QS) due to septal hypertrophy, sometimes with low voltage (Fig. 16.8).
16.2.5. Arrhythmogenic Right Ventricular Dysplasia (ARVD)
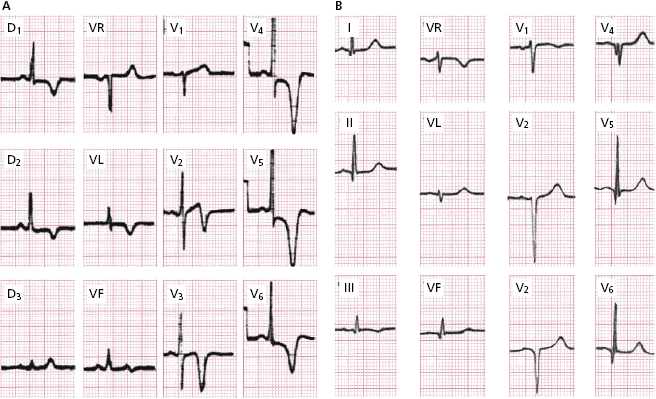
This is a genetic disease characterized by a fatty infiltration and fibrosis in the RV that can originate VT/VF. The ECG is abnormal in 80% of patients. The most characteristic ECG abnormalities (Marcus, 2009) include: [F]
- Atypical RBB pattern with a QRS duration in V1 > V6 (Fig. 16.9).
- In some cases (≈ 10% of cases), there is delayed activation in the RV that is recorded as a wave somewhat separate from QRS (ε wave) and which may mimic partial RBBB (Fig. 16.6). The late potentials that expressed this activation, are positive (see below). Sometimes the ε wave is very small, but its presence is very important for the diagnosis.
- Frequent right ventricle PVCs that may trigger VT with LBBB morphology are frequently with left ÂQRS.
- ST segment in V1-V2 is not usually elevated, or the elevation is very small.
- The T wave is negative and symmetric in V1 to V2-V4.
- In some cases (≈ 10% of cases), there is delayed activation in the RV that is recorded as a wave somewhat separate from QRS (ε wave) and which may mimic partial RBBB (Fig. 16.6). The late potentials that expressed this activation, are positive (see below). Sometimes the ε wave is very small, but its presence is very important for the diagnosis.
16.2.6. Non-Compacted Cardiomyopathy
- This is a genetic disease that is diagnosed today thanks to CV-MRI. It is characterized by an increase in the trabeculated mass in the right ventricle.
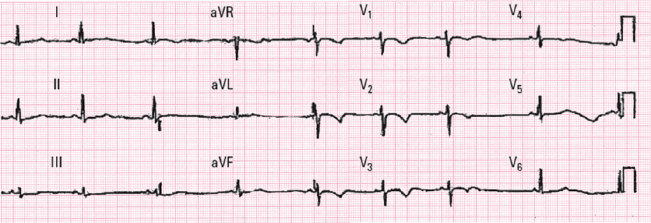
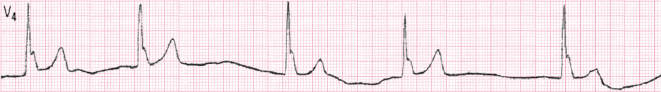
- The ECG is abnormal in 95% of cases and the most characteristic abnormality (70%) is a symmetrical negative T wave in precordial leads beyond V2 (V1 to V3–V5) (Fig. 16.10). [G]
- This pattern must not be confused with the normal pattern of a negative T wave seen in young people, which is usually asymmetrical and not present beyond V2.
- Intraventricular conduction disturbances, LVH, and long QT are also frequent.
- Other types of genetically induced VT (Table 16.1) are very rare and are not described here (see Bayés de Luna, 2011 and 2012a).
16.3. High Risk ECG Patterns That Are Not Genetically Induced
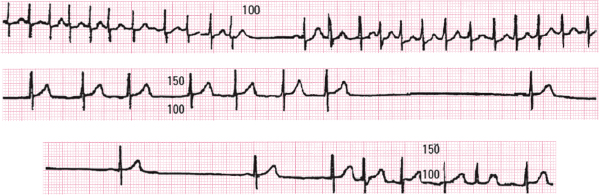
16.3.1. Severe Sinus Dysfunction [H]
Although it may be of genetic origin, it is generally found in the elderly due to degeneration of the sinus node and is sometimes associated with the use of some drugs.
The ECG shows the presence of marked bradycardia. This constitutes sick sinus syndrome, which is frequently associated with depressed automatism in the AV junction and frequent crisis of supraventricular tachyarrhythmia. This gives rise to symptoms ranging from those due to tachyarrhythmia to syncope due to severe bradyarrhythmia (brady-tachycardia syndrome). Pacemaker implantation is needed in order to avoid very slow rate and to properly treat the rapid tachyarrhythmias.
Figure 16.11 shows a Holter recording in which runs of tachyarrhythmias with very pronounced sinus pauses may be seen.
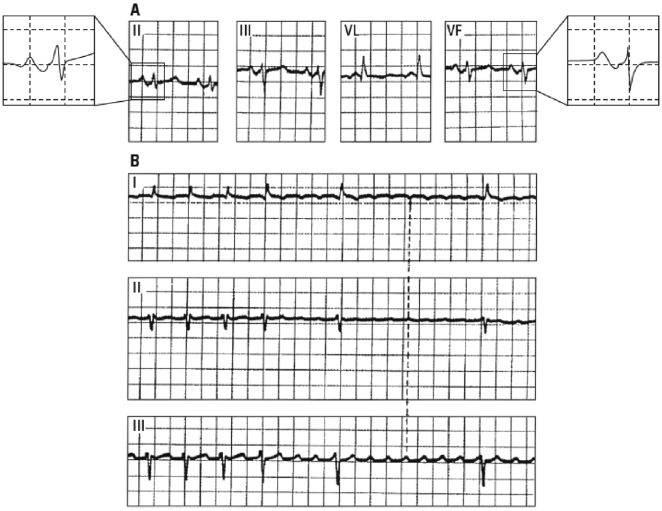
16.3.2. Third-Degree Interatrial Block
This is especially found in advanced valvular heart disease and in patients with cardiomyopathy or ischemic heart disease, often with heart failure.
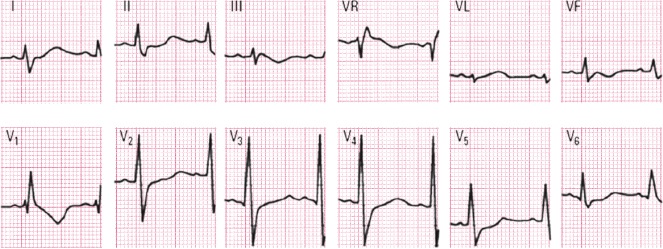
As explained in Chapter 5, it is diagnosed based on the presence of a long P wave (>120 ms) and ± morphology in II, III, and VF, as well as V1–V2. It is frequently associated with left atrial enlargement and very frequently with supraventricular tachyarrhythmia (especially atypical flutter). This represent a true cardiological syndrome (Bayés de Luna et al., 1985; Conde and Baranchuck, 2014) (Fig. 16.12). [I]
16.3.3. Advanced Second-Degree AV Block (Chapter 13)
This occurs when various successive P waves are suddenly blocked.
Figure 13.4C shows a clear example of this type of block, in this case needs urgent pacemaker implantation.
16.3.4. ECG Pattern of Ventricular Enlargement of Poor Prognosis (Chapter 6) [J]
- In both the right and left ventricular enlargement the presence of high R and strain-type repolarization morphology indicates severe and advanced ventricular enlargement.
- In RVE a pattern of rsR’ with QRS <120 ms may be an expression of poor prognosis as in the isolated pattern of advanced RBB (in V1 rSR’ with QRS >120 ms).
- The presence of atrial fibrillation adds another risk factor, as does the presence of frequent ventricular extrasystoles.
16.3.5. High Risk Ventricular Block (Chapter 7) [K]
This group includes:
- The appearance of advanced RBBB in patients with sudden dyspnea (possible pulmonary embolism) or anginal pain with ST elevation in precordial leads (possible proximal LAD occlusion or complete occlusion of the main trunk) can lead to a very critical hemodynamic situation, especially in the latter case.
- RBBB and LBBB alternance, or RBBB+SAH alternating with RBBB+IPH (Rosenbaum–Elizari syndrome) (Fig. 7.24). In these cases u rgent pacemaker implantation is required.
- Masked block. This is characterized by the presence of RBBB in the HP (R in V1) with very left ÂQRS in the FP and without S in I and VL. This pattern is due to bifascicular block (RBBB+SAH) with important LVH. This is due to the fact that the late forces of activation are forward and not directed to the right, but rather to the left. Consequently there is no S in I and VL, although there is terminal R in V1 (Fig. 7.25B).
- Generally, in acute and chronic ischemic heart disease and in cardiomyopathies with heart failure, the presence of branch block, especially LBBB, is a marker of poor prognosis. In patients with advanced LBBB and left ÂQRS, a terminal R wave in VR suggests that a large dilation in the RV exists (Van Bommel et al., 2011) (see Chapter 7).
16.3.6. High Risk WPW Syndrome [L]
Patients with episodes of very fast AF and very short RR intervals and those who present certain risk factors (fixed pre-excitation in the stress test or very short refractory period in the electrophysiologic study (EPS) are at risk of VF (Fig. 8.11) and must undergo ablation of the accessory pathway.
16.3.7. High Risk ECG Patterns in Acute and Chronic Ischemic Heart Disease
A. Acute Ischemic Heart Disease [M]
- High risk ACS in relation to the ECG pattern
- ECG pattern of severe and extensive ischemia: ascending S wave being pushed upward by ST elevation and the sum of shifts of ST ≥15 mm (Fig. 9.8).
- ECG pattern of STE-ACS due to complete occlusion of the proximal LAD or left main trunk (Fig. 9.11A).
- Persistent ST elevation (several days). This is a marker of cardiac rupture.
- ECG pattern of left main subocclusion: NSTE-ACS with ST depression in seven or more leads and ST elevation in VR ≥ 1 mm (Fig. 9.21).
- Presence of frequent ventricular extrasystoles, atrial fibrillation, or AV block.
- Presence of confounding factors (LVH with strain pattern, bundle branch block, pacemaker, etc.)
- ECG pattern of severe and extensive ischemia: ascending S wave being pushed upward by ST elevation and the sum of shifts of ST ≥15 mm (Fig. 9.8).
- Coronary spasm with pattern of ST elevation, that looks like TAP pattern, ventricular arrhythmias and/or ST/TQ alternans accompanied by arrhythmia.
B. Chronic Ischemic Heart Disease [N]
- Presence of frequent PVC’s in patients with depressed ejection fraction.
- Presence of sinus tachycardia.
- Presence of residual ST elevation. It is necessary to rule out ventricular aneurism (Fig. 9.45).
- Presence of intraventricular conduction disturbances, especially if are viewed.
- Presence of pacemaker.
- Presence of atrial fibrillation.
The presence of these patterns as risk markers should be considered in the global clinical setting of patients with acute and chronic ischemic heart disease. In the chronic cases the presence of low ejection fraction and the demonstration of electric instability are especially important. In the acute phase the clinical setting and the hemodynamic situation together with an evaluation of the biomarkers are of great importance.
16.3.8. Hypothermia and Other ECG Patterns with J Wave [O]
16.3.8.1. Hypothermia Produces Characteristic ECG Changes
These include (Fig. 16.13):
- Irregularity of the baseline.
- Bradycardia , occasionally with no apparent P wave (undetectable sinus activity, sinoventricular conduction, or escape rhythm).
- Lengthening of the PR and QT intervals.
- Appearance of a clear J wave.
- Risk of serious arrhythmia.
16.3.8.2. Early Repolarization (ER)
J wave or slurring appear at the end of QRS, and are recorded especially in V3-V6 and sometimes II, III, VF, I, and VL (see Fig. 16.14). This pattern is usually benign, especially if it is not present in inferior leads. It is frequently seen in athletes and in the presence of high vagal tone, and is usually followed by ascending ST (Fig. 16.14A). The amplitude of the J wave is measured from the high take-off of the J wave to the level of isoelectric line in the PR interval (Fig. 16.14B), or in the case of slurring at the moment of transition point (Nakagama et al., 2014).
It is considered that it may be dangerous if the J-wave is greater than 2 mm, and particularly if it is recorded in the leads of the inferior wall and is followed by a horizontal/descending ST segment. This malignant type of ER is very rare (Fig. 16.14B).
Recently, it has been proposed to combine all processes involving the presence of the J wave, under the term ‘J wave syndromes’ (Antzelevitch and Yan, 2010). These authors consider that the electrophysiological explanation of early repolarization (ER) and Brugada syndrome (BS) are similar and that the r’ of BS is a J wave. Therefore, they include BS in J wave syndrome. There are currently some discrepancies about this classification. However, it is true that occasionally both BS and EP patterns appear in the same patient (Sarkozy et al., 2009), which is a marker of bad prognosis.
16.3.9. Ionic Disturbances
Ionic disturbances refer especially to abnormalities in blood levels of potassium, which produce the most marked and potentially dangerous ECG changes (Surawicz, 1967). They are often associated with other ionic disturbances (see Bayés de Luna, 2012a).
These ionic abnormalities may be observed, between other situations, after the administration of certain drugs such as diuretics (hypokalemia) and in renal failure (hyperkalemia).
1. Hyperkalemia (Fig. 16.15) [P]
The ECG changes appear progressively in relation to the levels of K.
- There is a high and peaked T wave with ST elevation.
- In more advanced cases the QRS is wider and the P wave disappears.
- The rhythm may progressively slow down (escape rhythm).
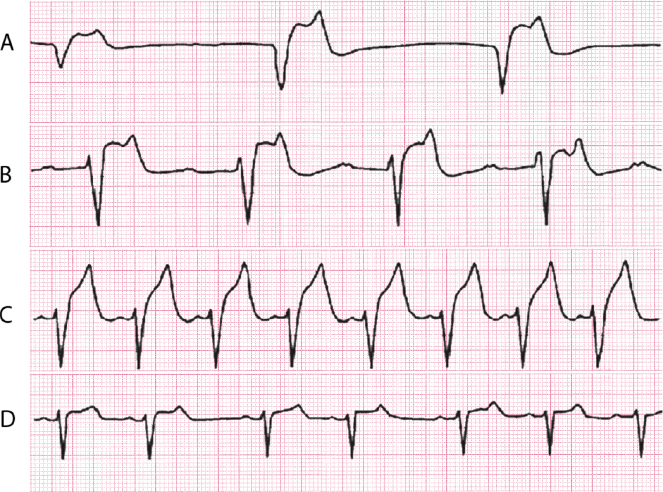
Figure 16.15 shows an ECG in a patient with severe renal failure whose abnormalities regress when the problem is solved.
2. Hypokalemia (Fig. 16.16) [Q]
The ECG changes include ST depression and a lengthened QT interval, partly because the U wave is mixed with the end of a flat T wave.
16.3.10. Acquired Long QT Interval
An acquired prolongation of the QT interval is also dangerous and it may provoke serious arrhythmia (pro-arrhythmic effect). The cause of acquired long QT syndrome may be related to ionic and metabolic imbalances, poisoning, or the administration of certain drugs. The risk of provoking VT/VF is clear when the medication lengthens QT to >60 ms or the QT interval is >500 ms. [R]
The most common drugs associated with lengthened QT are the following:
- Antiarrhythmic agents, especially quinidine-like.
- Antibiotics, such as eritromicine.
- Fluoroquinolones .
- Antidepressants: amitriptyline, fluoxetine, etc.
- Antihistaminic agents: terfenedine (off the market).
- Digestive tract: cisapride (off the market).
However, with low doses of these drugs, serious problems are very rare. It is useful to monitor the QT interval when these medications are given over long periods of time. See www.qtdrugs.com
16.3.11. Patients with Pacemakers
Although the implantation of a pacemaker can save many lives, when implanted in the right ventricle (still the most frequent site), it may cause heart failure over time due to the asynchrony of the contraction of the two ventricles, especially in patients with heart disease or in the elderly. This may require the implantation of a pacemaker in the LV (resynchronization therapy) (see Chapter 13).
Self-assessment
A. What are the typical ECG abnormalities in congenital long QT syndrome?
Stay updated, free articles. Join our Telegram channel

Full access? Get Clinical Tree


