Ventricular Blocks
7.1. General Concepts
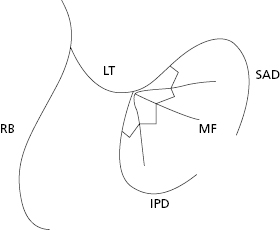
- In the specific intraventricular conduction system there are four fascicles (Fig. 7.1): the right bundle branch (RBB), the left bundle branch (LBB) and its two divisions, the superoanterior (SA) and inferoposterior (IP), as well as some middle fibers that exist between two divisions and that occasionally constitute a true fascicle (see Section 7.7).
- In Chapter 5 we discussed how block in any part of the heart, whether at sinoatrial, atrial, AV junction, or ventricular level, refers to the slowing of the conduction (partial or first-degree block), or complete block of the conduction in the area in question (advanced third-degree block). When only some stimuli are blocked, either in the form of partial or advanced block we refer to it as second-degree block.
- Block in the right and left branches may be at the proximal (trunk) or peripheral level. Here we refer mainly to the ECG criteria of proximal blocks. However. the characteristics of right and left peripheral bundle branch block, are similar to proximal ones. For details consult Bayés de Luna (2012a). [A]
- The diagnostic criteria for bundle branch block and two divisions of LBB were established many years ago by the Mexican School (Sodi et al.) in 1967) and Rosenbaum and Elizari in 1968, respectively. Recently, some of these criteria have been questioned, especially the width of QRS for the diagnosis of advanced LBB block (LBBB) (Strauss et al., 2011). We continue to use the classic criteria in this book.
- It is worth mentioning that block in the peripheral divisions of the RBB may originate SI SII SIII morphologies that are practically identical to those seen in RVE and as variants on normality (Bayés de Luna et al., 1987).
- In addition, block of the middle fibers of the LBB will be briefly discussed at the end of the chapter.
- The diagnostic criteria for bundle branch block and two divisions of LBB were established many years ago by the Mexican School (Sodi et al.) in 1967) and Rosenbaum and Elizari in 1968, respectively. Recently, some of these criteria have been questioned, especially the width of QRS for the diagnosis of advanced LBB block (LBBB) (Strauss et al., 2011). We continue to use the classic criteria in this book.
For more information regarding the diagnosis of the association of bundle branch block with ventricular enlargement, acute ischemia, or necrosis, consult Bayés de Luna (2012a).
7.2. Right Bundle Branch Block (RBBB)
7.2.1. Advanced RBBB (Third-Degree)
We speak of advanced, and not of complete RBBB, and also of advanced, and not of complete LBBB (Section 7.3), because it is difficult to know whether the conduction of the stimulus through the affected branch would be possible, if transeptal depolarization from the other ventricle does not exist.
7.2.1.1 Mechanisms of ECG Changes (Fig. 7.2)
The activation (depolarization + repolarization) of the right ventricle occurs transseptally producing, due to a small number of Purkinje fibers in the septum, a QRS with longer duration. The transeptal activation originates the delayed 3 and 4 vectors of depolarization of the septum and RV, and the formation of a characteristic QRS loop.
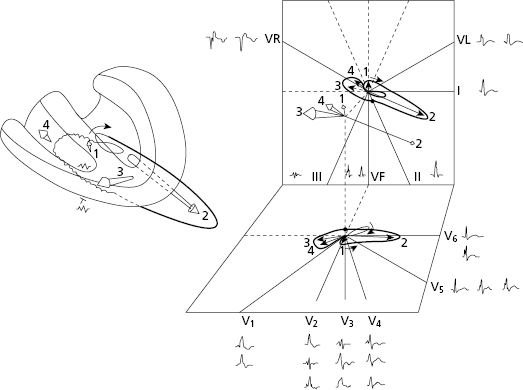
Figure 7.2 shows the correlation of these vectors and the corresponding loop with the hemifield of each lead, all of which explain the morphologies observed. [B]
Figure 7.3 shows how the morphology of ST-T changes seen in advanced RBBB are explained by septal repolarization, which dominates over that of the LV wall. The septal repolarization dipole begins in the left side of the septum, and thus the head (positivity) of the repolarization vector always faces the left side and is recorded as negative in V1 and positive in V6.
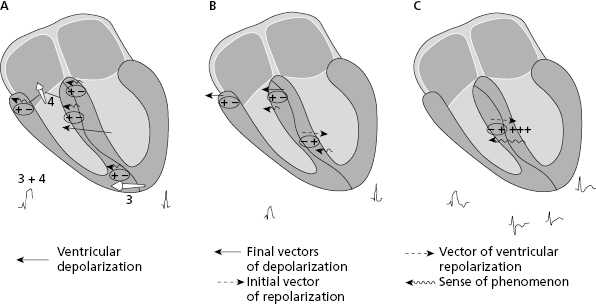
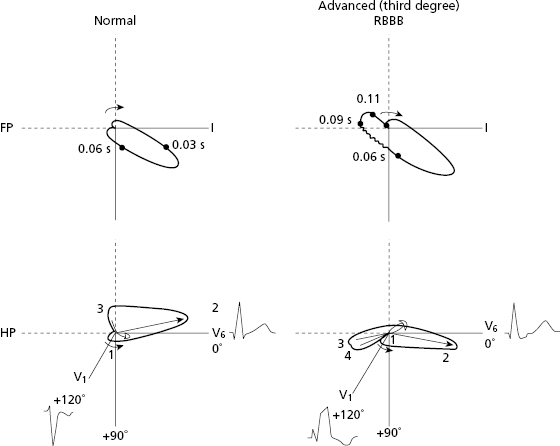
Figure 7.4 compares the QRS loop and morphologies in the FP and HP under normal conditions and in advanced RBBB.
7.2.1.2. Diagnostic Criteria in Advanced RBBB (Third-Degree) [C]
The diagnostic criteria for advanced RBBB are as follows (Sodi et al., 1967; Bayés de Luna, 2012a):
- QRS ≥ 0.12 s with variable ÂQRS.
- Horizontal plane: rsR’ in V1 and in general V2 with slurrings in R’, and in general slightly depressed ST in V1 and an asymmetrical negative T wave in V1–V2 and occasionally in V3. qRs in V5–V6 with slurrings in the ‘s’ wave.
- Frontal plane: QR in VR with slurrings in R, and negative T wave and qRs in I and usually VL with slurrings in S wave. ÂQRS may be located in the normal range in the absence of RBBB. More to the right or left according to the rotation of the heart and/or presence of right or left ventricular enlargement.
Figure 7.5 shows a typical example of advanced RBBB in a normal heart without rotations.
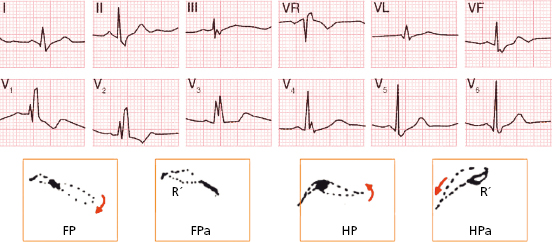
The key leads for diagnosis are V1, V6 and VR.
7.2.2. Partial RBBB (First-Degree)
In this case the transseptal activation is more (B) or less (A) important (grey area) depending on the degree of stimulus delay in the right bundle branch (Fig. 7.6). Consequently, a greater or lesser part of the RV is depolarized with a delay (striped area). [D]
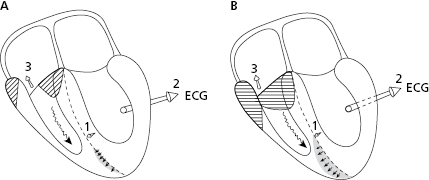
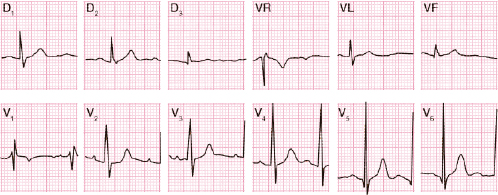
For this reason, the ECG of first-degree RBBB is characterized by the following (Fig. 7.7):
- QRS measures <120 ms.
- rSr’ in V1. The r’ is not wide and may have a voltage more or less evident. It may be seen in the initial phases as an RS morphology, because the first part of QRS loop goes a little forwards before the last part presents the forward slurrings. This explains the RS pattern in V1 (Fig. 7.8). However, to avoid overdiagnosis, we can give the diagnosis of partial RBBB in the presence of r’ in V1.
- Terminal with ‘r’ that is not wide is also found in VR, and ‘s’ in I and V6.
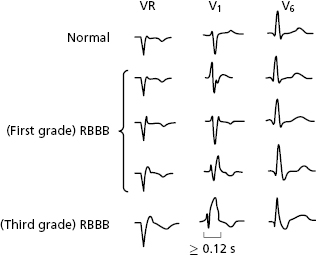
7.2.3. RBBB: Comparative Morphologies (Fig. 7.8)
See the different morphologies in VR, V1, and V6 in the case of normal activation and in first-degree and third-degree RBBB. In V1 the morphology may be from ‘rs’ to ‘rsR’, with QRS ≥120 ms.
7.2.4. Second-Degree RBBB (Fig. 7.9) [E]
In this case a pattern of transient first- or third-degree RBBB appears in the same tracing (see legend and Chapter 11, ventricular aberrancy).

7.2.5. Differential Diagnosis of RBBB Morphology
- The differential diagnosis of RBBB must be made with all processes that present a prominent R or r’ in V1, including pre-excitation, right or biventricular enlargement, athletes, pectus excavatum, and Brugada syndrome, among others (Table 6.1 and Chapter 16).
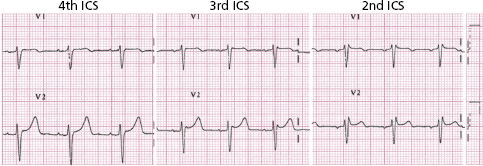
- A mistakenly high placement of the electrodes of V1 and V2 and other variants on the normal ECG must also be ruled out. In cases of high placement in V1–V2, the P wave is negative (Fig. 7.10). A negative P wave in V1 with the electrode located in the correct place, is a common finding in pectus excavatum. See differential diagnosis of r’ in V1 in Table 6.1. [F]
- Naturally, the differential diagnosis is more difficult in partial RBBB because the sole presence of QRS ≥120 ms indicates, once pre-excitation is ruled out based on normal PR, advanced RBBB.
- For more information on the diagnosis of advanced RBBB associated with necrosis, ischemic heart disease, or pre-excitation, and on the diagnosis of peripheral right bundle branch block (which as we have said may present SI SII SIII pattern similar to RVE and variant of normality [Fig. 6.8]), consult Bayés de Luna (2012a).
- Naturally, the differential diagnosis is more difficult in partial RBBB because the sole presence of QRS ≥120 ms indicates, once pre-excitation is ruled out based on normal PR, advanced RBBB.
7.3. Left Bundle Branch Block (LBBB)
7.3.1. Advanced LBBB (Third-Degree)
7.3.1.1. Mechanisms of ECG Changes (Fig. 7.11) [G]
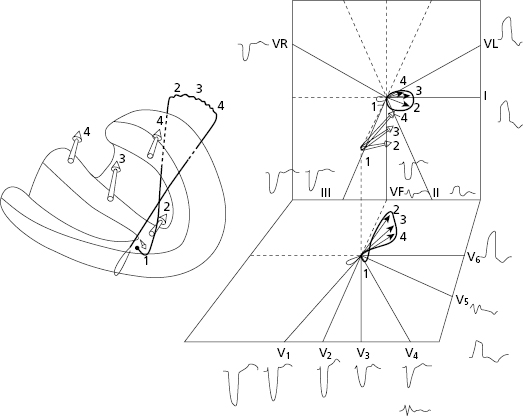
The activation of the entire left ventricle takes place transseptally, as also happens in advanced RBBB. This explains the slowness in forming QRS, because transseptal depolarization is slow due to the few number of Purkinje fibers that exist in the septum. Transseptal and left ventricle activation originate four vectors (Fig. 7.11) that explain the formation of a QRS loop and a wide QRS complex, the morphologies of which can be explained by the loop–hemifield correlation (Fig. 7.11).
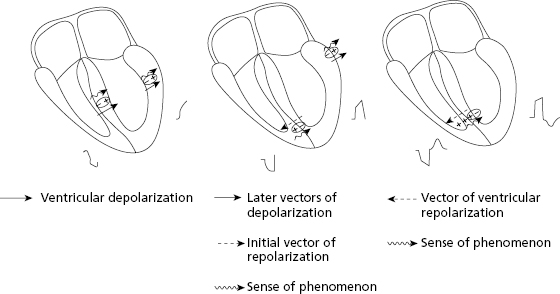
The morphology of ST-T in the case of advanced LBBB is explained because the repolarization of the septum dominates over that of the LV wall (Fig. 7.12). The repolarization dipole that begins on the right side of the septum is directed from right to left, and thus the repolarization vector also moves from right to left with the head (positivity) always facing V1. As a result, the T wave is positive in V1 and negative in V6.
7.3.1.2. Diagnostic Criteria for Advanced LBBB (Third-Degree) (Fig. 7.13)
The classic diagnostic criteria (Sodi, 1967; Willems et al., 1985; Bayés de Luna, 2012a) include the following:
- QRS ≥120 ms. Recent studies suggest that in cases of heart failure, the preferred wideness of QRS for the placement of resynchronization pacemakers has to be ≥130 ms in women and ≥140 ms in men (Strauss, 2011; Gettes and Kligfield, 2012; Zareba, 2013) (see before).
- The presence of notches or slurrings in the middle third of QRS in at least two of the following leads: V1, V2, V5, V6, I, and VL, with a prolongation at the delayed peak in R in V5-V6 to >60 ms.
- Generally, the ST segment is slightly opposed to the QRS polarity, especially when it is ≥140 ms and it is rapidly followed by an asymmetrical T wave of opposed polarity. [H]
- Horizontal plane: QS or rS in V1 with small ‘r’ with ST slightly elevated and positive asymmetrical T wave, and unique R in V6 with negative asymmetric T wave. When the QRS is <140 ms, the T wave in V6 may be even positive.
- Frontal plane: R exclusively in I and VL often with a negative asymmetrical T wave and slightly ST depression, and usually QS in VR with positive T wave. In cases with advanced heart failure and great dilation of right cavities, there is a delay of depolarization of RV that explains the final R in VR (QR pattern) (Van Bommel et al., 2011).
- The ÂQRS is variable. It may be rightwards in patients with RVE and/or congestive heart failure (Fig. 7.14), and leftwards in case of associated superoanterior hemiblock, deleted CM, etc. (Fig. 7.15).
- The presence of notches or slurrings in the middle third of QRS in at least two of the following leads: V1, V2, V5, V6, I, and VL, with a prolongation at the delayed peak in R in V5-V6 to >60 ms.
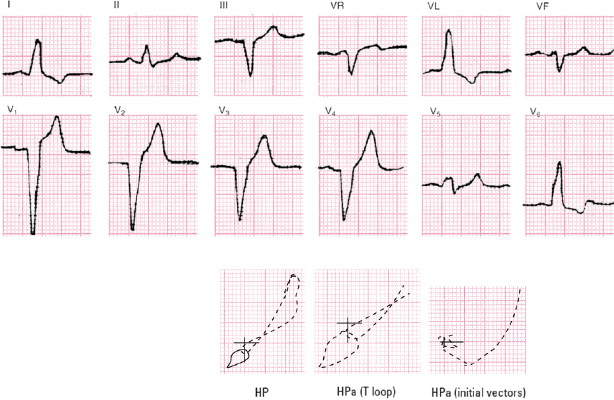

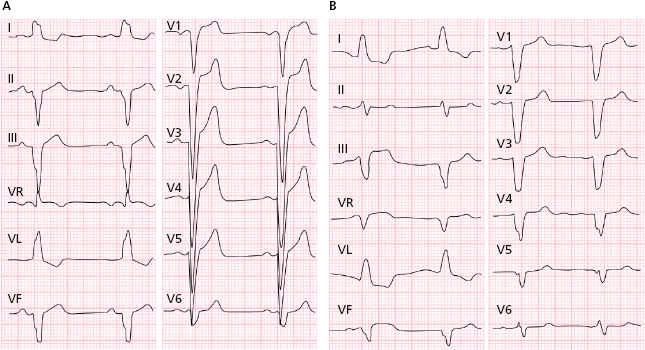
Figure 7.13 shows a typical example of advanced LBBB, and in Figures 7.14 and 7.15 two examples of advanced LBBB with associated pathology are shown (see legends). The association with IHD is briefly explained in Chapter 9 (see Section 9.6).
7.3.2. Partial Left Bundle Branch Block (First-Degree)
In this case, the stimulus passes slowly down the left bundle branch. This explains that some part of the left ventricle is depolarized transseptally and some part is depolarized by a normal pathway (more in B than A in Fig. 7.16). [I]
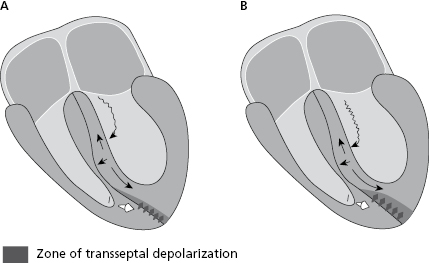
Because the start of septal depolarization occurs from right to left, the septal q wave is not originated and thus a unique R is seen in V6, I, and VL. Initial r is not found in V1 either, or it is very small, due to RV depolarization by the stimulus that passes down the right bundle branch.
The ECG of a .first-degree LBBB is characterized by:
- QRS <120 ms, with a unique R in I, VL, and V6.
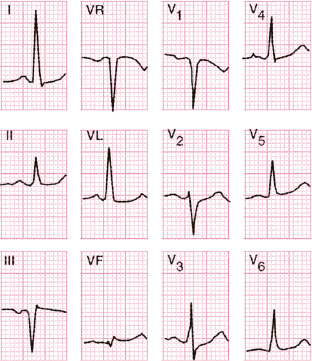
- Repolarization in V6 may be positive or flat/negative according to the accompanying pathology and degree of transseptal depolarization (Fig. 7.17).
7.3.3. Comparative Morphologies
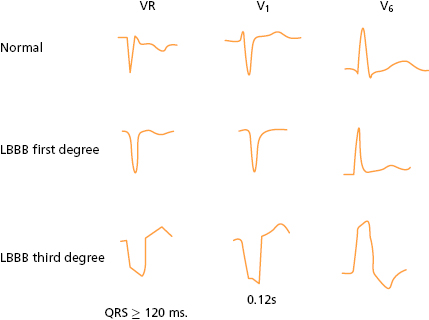
In Figure 7.18 may be seen the different morphologies in the VR, V1, and V6 in cases of normal activation and first- and third-degree LBBB.
7.3.4. Second-Degree LBBB (Fig. 7.19) [J]
As in second-degree RBBB, a pattern of transient first or third degree LBBB appears in the same tracing (see legend and Chapter 11, Ventricular Aberrancy).

7.4. Hemiblocks or Fascicular Blocks
See Rosenbaum et al., 1968; Elizari & Chiale, 2012.
In 1968, Rosenbaum and Elizari defined the ECG criteria of superoanterior and inferoposterior fascicular block of the left branch from a clinical and experimental point of view, calling it hemiblock. Many cases exist of superoanterior hemiblock (SAH) and few of inferoposterior hemiblocks (IPH).
7.4.1. Superoanterior Hemiblock (SAH)
Figure 7.20 shows how ventricular activation occurs in a case of block in this fascicle. [K]
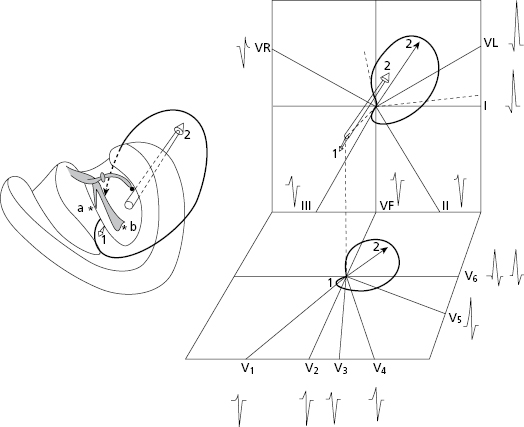
The block in the superoanterior division originates a change in the start of activation that is then made through a small septal vector (vector 1) that moves downward, forward, and to the right, and then depolarizes the rest of the left ventricle upwards and backwards (vector 2).
The loop generated by this activation when projected on the positive and negative hemifields of each lead of the FP and HP explain the different QRS morphologies found in each case.
7.4.1.1. Diagnostic Criteria for SAH [L]
See Rosenbaum et al., 1968; Elizari & Chiale, 2012. The diagnosis of SAH may be made based on the presence of the following electrocardiographic criteria:
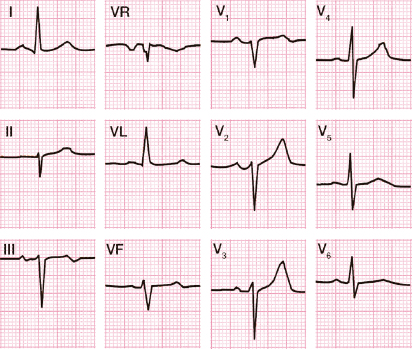
- Leftwards ÂQRS between −45° and −75°. ÂQRS between −30° and −45° may correspond to non-advanced degrees of SAH.
- FP morphology: qR in D1 and VL; rS in II, III, and VF, with SIII > SII and RII > RIII, and sometimes with terminal r in VR.
- HP morphology: S until V6 with intrinsicoid deflection time (IDT) in V6 < IDT in VL and with IDT in VL ≥50 ms. Some changes occur if the precordial electrodes are located above the normal site: in V1-V3 small q waves may appear, simulating a previous septal myocardial infarction, and in V2 an r’ wave may also appear. In V5-V6 the ‘S’ wave may be reduced and a small q may appear.
- QRS duration <120 ms. However, in isolated cases the QRS may not surpass 100 ms. A QRS between 100 ms and 120 ms usually indicates associated LVE.
- In advanced cases, mid-terminal slurrings are present in I and VL.
Figure 7.21 shows a typical example of SAH.
7.4.1.2. Partial SAH
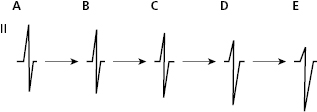
It is not easy to diagnose the presence of partial SAH. Leftwards ÂQRS starting at −30° may correspond to partial SAH if this pattern evolves into AQRS at −45° or more over time, as shown in Figure 7.22.
7.4.2. Inferoposterior Hemiblock (IPH)
Figure 7.23 shows how ventricular activation is carried out in cases of block in this fascicle. As seen in the figure, activation occurs inversely to that observed in SAH (see before). [M]
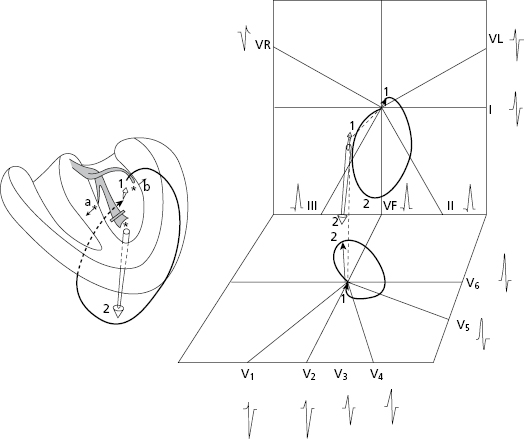
The diagnosis of hemiblock in the inferoposterior division (IPH), a process that is much less common than SAH because this fascicle is larger and narrower, may only be made in the absence of RVE and very vertical heart. According to some authors, a pathology on the left ventricle must also be present.
7.4.2.1. Diagnostic Criteria for IPH [N]
The diagnostic criteria of inferoposterior hemiblock are listed below.
- ÂQRS greatly deviated to the right (between +90° and +140°).
- RS or Rs in I and VL, and qR in II, III, and VF. With regard to precordial leads, the most common morphologies are seen in Figure 7.21.
- QRS <120 ms.
- TDI = >50 ms in VF and V6, with TDI <50 ms in VL.
- Mid-terminal slurrings in II, III, and VF in advanced cases.
Figure 7.24 shows the appearance of an IPH morphology. Very often it appears in association with RBBB.
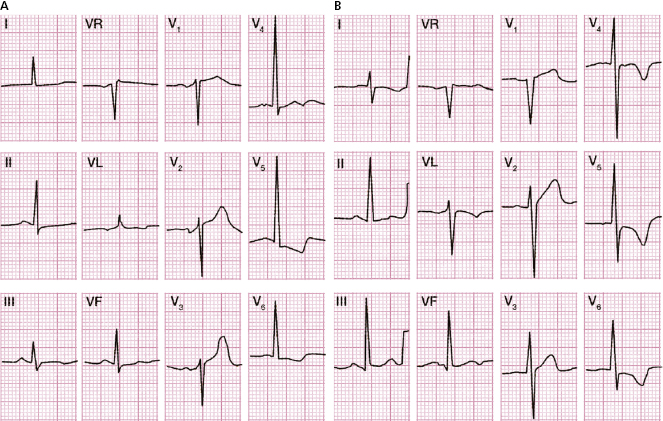
In cases of IPH due to progressive conduction aberrancy of atrial extrasystoles or extrastimulus, it has been observed that cases of partial inferoposterior hemiblock may only be diagnosed by comparative study.
7.5. Bifascicular Block
The most typical cases are due to RBBB associated with SAH or IPH.
A. RBBB + SAH [O]
See the wide QRS (>120 ms), the rsR’ pattern in V1, and the very left ÂQRS with rS pattern in II, III and VF (Fig. 7.25A).
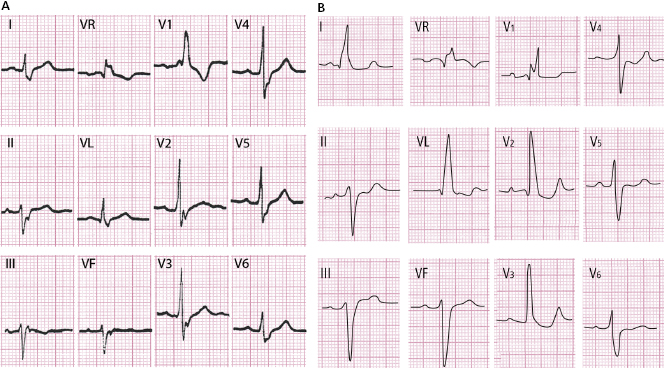
When exists an important delay of LV activation, the final vectors of activation may be directed forwards (R in V1 due to RBBB), but to the left instead of to the right. Due to this, there is no S in I and VL. Thus the HP looks like RBBB and the FP like LBBB. This type of bifascicular block is named ‘masked bifascicular block’ (Bayés de Luna, 2012a) (Fig. 7.25B).
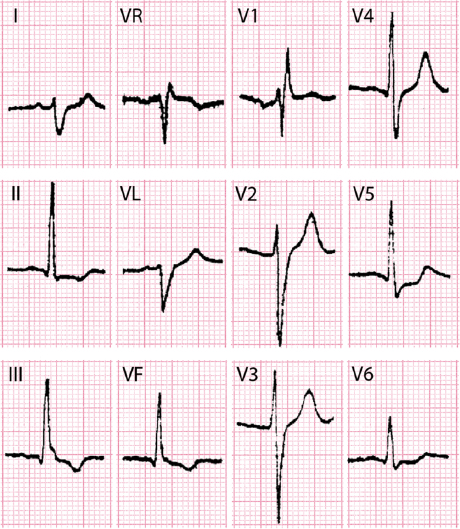
B. RBBB + IPH (Fig. 7.26)
See the wide QRS (>120 ms), the rsR’ pattern in V1, and the right ÂQRS with qR pattern in II, III, and VF to assure the diagnosis, the ECG has to be taken from a patient with no right heart disease or a very vertical heart.
See Bayés de Luna (2012a) for more explanation of the clinical implications of these types of block.
7.6. Trifascicular Block (Fig. 7.27)
In this case a block in three fascicles is present. [P]
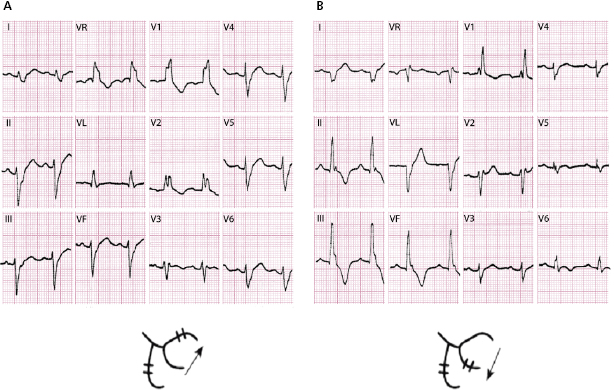
The most typical case presents a morphology of RBBB alternating with SAH and IPH.
See (Fig. 7.27) how in the presence of a wide QRS and a pattern of RBBB in the two ECGs, an abrupt change in ÂQRS occurs in the frontal plane from −70° in A to +130° in B. These patients may present syncopes when trifascicular block coincides, because an abrupt advanced AV block occurs (Rosembaum–Elizari syndrome). These situations require the urgent implantation of a pacemaker.
The presence of LBBB alternating with RBB + SAH has the same clinical considerations as the previous case.
The cases of bifascicular block with a long PR interval may be explained by first degree block in the His bundle. Therefore they cannot be considered due to trifascicular block.
7.7. Block in the Middle Fibers of the Left Branch [Q]
The presence of block in the middle fibers (MF), also known as the septal fascicle (SF), probably originate some ECG changes. At present the following two criteria are the most used to describe this type of block: (1) lack of septal q (lack of q in leads V5-v6 and I) and (2) the presence of a prominent R in V1-V2. The Brazilian school supports more this last criterion.
The presence of these patterns (missing septal q wave in I, V5-V6, or presence of R/S in V1–V2) if transient, confirm that they are due to some type of intraventricular conduction disturbance, although the location of the conduction delay is not certain. The lack of septal q wave in V6, I, may be also explained by first-degree LBBB, and the presence of RS in V1-V2 may occur in case of MF/SF block or partial right bundle branch block (Fig. 7.8) or both. Many other processes may also present prominent R or r’ in V1 (see Table 6.1) (Bayés de Luna et al., 2012d).
Self-assessment
A. What types of block exist at the ventricular level?
Stay updated, free articles. Join our Telegram channel

Full access? Get Clinical Tree


