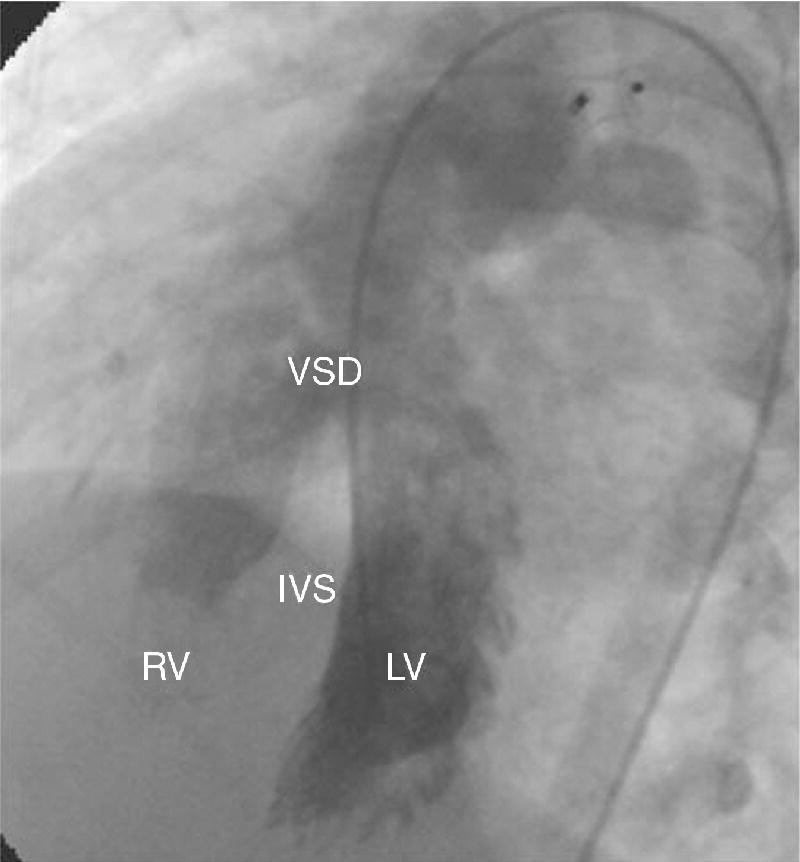
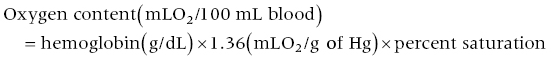
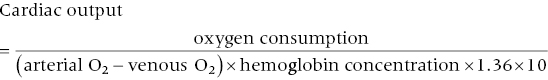
CHAPTER 7 Frederick M. Costello and George A. Stouffer In the normal circulation, blood passes from the venous system through the right heart, into the pulmonary circulation, then into the left heart, and finally into the systemic circulation in a continuous, unidirectional manner. In certain conditions, however, oxygenated blood is shunted from the left heart directly to the right heart, as in the case of atrial septal defects (ASD; Figure 7.1) or ventricular septal defects (VSD; Figure 7.2), or from the aorta to the pulmonary artery (patent ductus arteriosus, PDA). More rarely, unoxygenated blood can be shunted from the right heart to the left heart (e.g., Eisenmenger’s syndrome). Intracardiac shunts can be either congenital (Figures 7.1 and 7.2) or acquired (e.g., VSD as a complication of myocardial infarction). Figure 7.1 Schematic showing the location of various types of atrial septal defects. Figure 7.2 Ventriculogram in an LAO projection showing efflux of dye from the left ventricle into the right ventricle via a VSD. [IVS = intraventricular septum; LV = left ventricle; RV = right ventricle; VSD = ventricular septal defect.] Intracardiac shunting of blood results when there is an opening between the right and left heart chambers and a pressure difference to drive flow between the connected chambers. Because pressures (both systolic and diastolic) on the left side of the heart are generally higher than on the right side, most shunts are predominantly left to right, although right to left and bidirectional shunts are seen (predominantly in Eisenmenger’s syndrome). Of note is that arterial‐to‐venous shunts can exist outside of the heart (e.g., intrapulmonary, intrahepatic, AV malformation) and affect oxygen saturations. We will not address these shunts in this chapter, but rather concentrate on intracardiac shunts. The presence of a shunt can be determined either invasively or noninvasively (e.g., radionuclide studies, magnetic resonance imaging [MRI], or Doppler echocardiography). In current practice, many shunts are suspected based on physical exam or electrocardiogram (ECG), diagnosed at echocardiography and then quantified using right heart catheterization. There are several methods by which an intracardiac shunt can be detected, localized, and quantified in the catheterization laboratory. The indicator dilution method is of historical interest, but is rarely used outside of research studies. It involves injecting a substance, such as indocyanine green, into the venous systems or a right heart chamber and then monitoring its appearance in the systemic circulation. Dye curve measurements are very accurate, but are slow and require specialized equipment that is rarely available in modern catheterization laboratories. Contrast angiography, in which contrast dye is injected into the higher pressure chamber of a suspected shunt (e.g., left ventricle), is occasionally used to identify a VSD or PDA. It has limited ability to diagnose ASD and is a poor tool for quantifying the size of a shunt. Oximetry, or measurement of the oxygen saturations in various locations in the venous system and the right heart (“oxygen saturation run”), is the most frequently used invasive technique due to its simplicity and reliance on readily available equipment. The oxygen saturation run is performed as a catheter is passed through the venous system, right heart, and pulmonary circulation. The samples need to be acquired with the patient breathing room air or a gas mixture containing no more than a maximum of 30% oxygen [1]. Saturation data may be inaccurate in patients breathing more than 30% oxygen, since a significant amount of oxygen may be present in dissolved form in the pulmonary venous sample. Dissolved oxygen is not factored into calculations when saturations are used and thus pulmonary flow will be overestimated and the amount of shunt exaggerated. The oxygen saturation run includes saturations from the superior vena cava (SVC), inferior vena cava (IVC), right heart, pulmonary artery, and arterial circulation. Pulmonary capillary wedge and/or left atrial samples are also sometimes obtained. Samples can be obtained as the right heart catheter is advanced, although many clinicians choose to place the catheter in the pulmonary artery first and then obtain samples as the catheter is withdrawn. This latter technique can improve the speed of obtaining samples, which can become an issue if there is difficulty advancing the catheter into the pulmonary artery. Blood samples should be taken from the locations listed in Table 7.1 and oxygen saturations determined. IVC saturation varies depending on where the sample is obtained, and the sampling site should be at the level of the diaphragm to ensure that hepatic venous blood is taken into account. An arterial blood sample should be collected at the same time as the venous samples are being obtained. Table 7.1 Sites from which oxygen saturation should be measured when quantifying intracardiac shunts. Multiple samples may have to be taken in various chambers to ensure accuracy; however, it is important to note that variability in oxygen saturation (in the absence of shunt) decreases as blood flows through the heart. Oxygen content varies by approximately 2 mL O2/100 mL blood in the right atrium (RA), 1 mL O2/100 mL blood in the right ventricle (RV), and 0.5 mL O2/100 mL blood in the pulmonary artery (PA) [2]. These values were determined by direct measurement of oxygen content in the days prior to the development of oximetry. Oxygen content can be approximated by the following formula: In a patient with a hemoglobin of 15 mg/dL, a difference in saturation of 5% is approximately equal to a difference in oxygen content of 1 mL O2/100 mL blood. The goal of the oxygen saturation run is to measure differences in oxygen saturation in various chambers of the heart. There are several practical factors that must be kept in mind to ensure accurate results: Using the saturation “step‐up” method to detect and quantify intracardiac shunts has some limitations that should be noted. First, because of the inherent variability in determining oxygen saturations, the oximetry method of quantifying shunts loses accuracy when determining small shunts or in the presence of high cardiac output (which decreases AVO2 difference). Second, the magnitude of the step‐up varies with the oxygen‐carrying capacity of blood and the cardiac output. Saturation step‐ups are increased if hemoglobin concentration is low or cardiac output is low. As Shepherd et al. [4] note, a 5% step‐up occurs with a shunt flow of 3400 mL/min when systemic blood flow is 7.5 L/min, a shunt flow of 1300 mL/min when systemic blood flow is 5 L/min, and a shunt flow of only 285 mL/min if systemic blood flow is 2.5 L/min. Third, the relationship between the magnitude of step‐up and the shunt flow is nonlinear and, with increasing left‐to‐right shunting, a given change in shunt flow produces less of a change in the saturation step‐up. In contrast, quantification of shunt size using Qp/Qs is not affected by hemoglobin concentration and the relationship between Qp/Qs and shunt flow is linear. Qp/Qs is sensitive to cardiac output and some investigators advocate using exercise in patients with low cardiac output to improve accuracy. Patients are often referred for cardiac catheterization to confirm and quantify a shunt that has been detected by physical exam and/or imaging. Occasionally, however, a patient will have a shunt that is unsuspected prior to right heart catheterization. These patients can be identified by routinely measuring oxygen saturation in the PA and the RA. Hillis et al. found that the difference (mean ± SD) between RA and PA saturations in 980 patients without intracardiac shunts was 2.3% ± 1.7%. In this same population, the difference (mean ± SD) between SVC and RA saturations was 3.9% ± 2.4%. Using threshold values of 8.7% between SVC and RA and 5.7% between RA and PA as “cut‐offs” (mean + 2 SD) to identify patients with intracardiac shunts had excellent sensitivity and specificity [5]. Similarly, differences in oxygen saturation of 8% between SVC and PA and 5% between RV and PA can be used to detect intracardiac shunts. Quantifying a left‐to‐right shunt is generally done in two ways. The ratio of pulmonary blood flow versus the systemic blood flow can be calculated, termed the QP/QS, where QP is the pulmonary blood flow and QS is the systemic flow. Alternatively, the actual flow of the shunt can be calculated. This is the difference between the pulmonary blood flow and the systemic blood flow (these two are equal in a normal heart). The pulmonary (QP) and systemic (QS) blood flows are calculated using the Fick method of estimating cardiac output (Table 7.2). The only difference between the pulmonary flow equation and the systemic flow equation is in the arterial and venous saturations used. The QP and QS equations are shown as well.
Detection, localization, and quantification of intracardiac shunts
Detection of an intracardiac shunt
Oxygen saturation run
Superior vena cava just above the junction with the right atrium
Inferior vena cava just below the diaphragm
Low right atrium
Mid‐right atrium
High right atrium
Right ventricle
Left, right and/or main pulmonary artery
Pulmonary capillary wedge (or left atrial)
Left ventricle and/or arterial
Limitations of using oximetry to detect and quantify intracardiac shunts
Diagnosis of intracardiac shunts at right heart catheterization
Quantifying a left‐to‐right shunt
Stay updated, free articles. Join our Telegram channel

Full access? Get Clinical Tree


