Anatomical and Electrophysiological Bases
1.1. The Heart Walls
The heart has four cavities, two atria and two ventricles, comprised mainly of contractile cells called cardiomyocytes. The electrical stimulus originating in the sinus node (SN) is distributed through the entire heart by means of a specific conduction system (SCS).
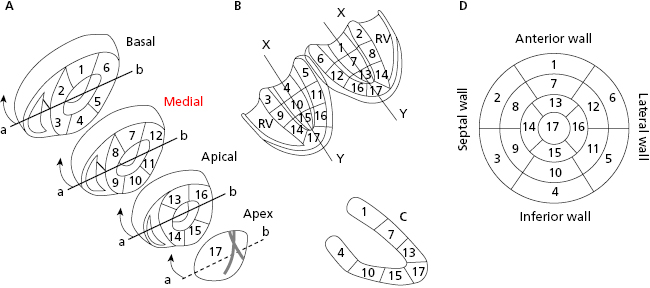
The left ventricle (LV) has four walls: anterior, septal, inferior, and lateral. Figure 1.1 shows the three segments of the anterior and inferior walls, the five segments of the septal and lateral walls, and the apex segment (segment 17). Magnetic resonance imaging has now shown that the previously-named posterior wall corresponds to the inferobasal segment of the inferior wall (segment 4 in Fig. 1.1) (Bayés de Luna et al., 2006a; Bayés de Luna A and Fiol-Sala, 2008). [A]
1.2. Coronary Circulation (Fig. 1.2)
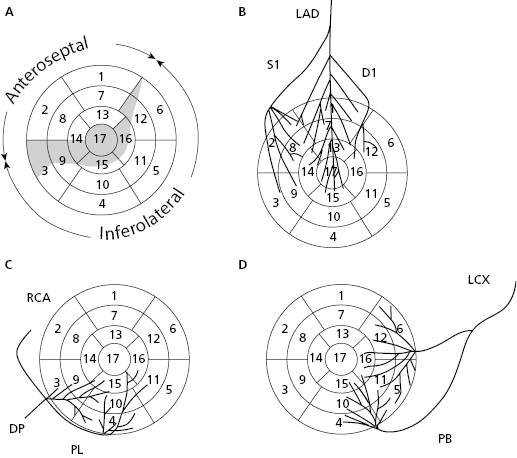
Based on coronary perfusion, the heart is divided into two zones: the anteroseptal zone, perfused by the left anterior descending artery (LAD) (Fig. 1.2A) and the inferolateral zone, perfused by the right coronary artery (RCA) and circumflex artery (CX) (Figs 1.2C and 1.2D). The heart has areas of shared perfusion (shown in grey in Fig. 1.2A) in which one of the two arteries dominates. For example, segment 17 (apex) is perfused by the LAD, if long; otherwise by the RCA and even partially by the CX. [B]
1.3. The Specific Conduction System (Fig. 1.3)
Electrical stimuli pass through the internodal pathways (Bachmann, Wenckebach and Thorel bundles), from the sinus node to the AV node and the His bundle. From there stimuli reach the ventricles through the ventricular conduction system: the right branch (RB) and the trunk of the left branch (LB), and its divisions (superoanterior and inferoposterior fascicles and the middle fibers that exist between them) (Figs 1.3A and 1.3B). [C]
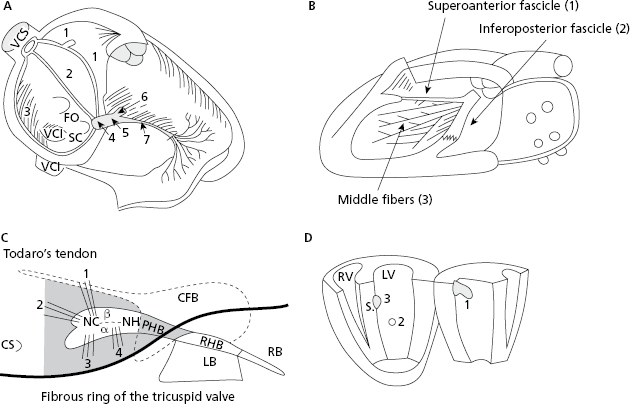
Figure 1.3C shows in grey the structures that the AV junction encompass. Figure 1.3D shows the three activation entry points in the left ventricle (LV) (Durrer et al., 1970).
1.4. The Ultrastructure of Cardiac Cells
- There are two types of cell in the heart:
- Contractile cells or cardiomyocytes, which are responsible for cardiac pump function (contractile). Under normal conditions these cells do not have automatic capacity and cannot generate stimuli. [D]
- Specific cells (cells of specific system of conduction), which are in charge of impulse formation (automaticity) and impulse transmission to the contractile myocardium.
- Contractile cells or cardiomyocytes, which are responsible for cardiac pump function (contractile). Under normal conditions these cells do not have automatic capacity and cannot generate stimuli. [D]
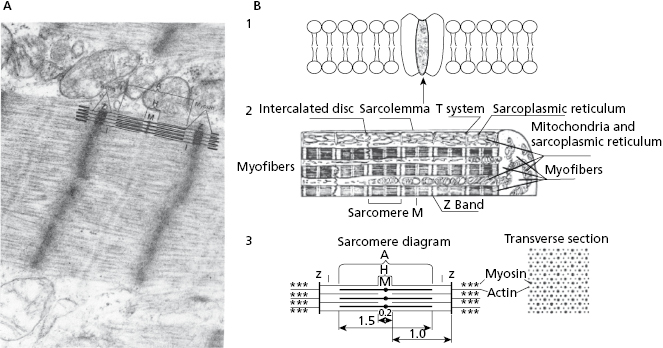
- Contractile cells (Fig. 1.4) are comprised of the following:
- The contractile system made up of myofibers in which the contractile unit is the sarcomere (Figs 1.4A, 1.4B2, and 1.4B3), a structure that can contract and relax. The energy for this activity is provided by mitochondria.
- The cellular activation–relaxation system consisting of the cellular membrane formed by a lipid bilayer (sarcolemma) (Figs 1.4B1 and 1.4B2). Ions (Na+, K+, and especially Ca++), responsible for activation, depolarization and repolarization, systole, and cellular rest (diastole) phases, flow through channels that exist in this membrane.
- The transverse tubular (T) system (Fig. 1.4B2), which allows electrical excitation to enter the cell, and the sarcoplasmatic reticulum (Fig. 1.4 B2) which contains the calcium necessary for cellular contraction.
- The specific cells, non-contractile, are of three types: (a) P cells, the ones with more automaticity, located especially in sinus node 4; (b) Purkinje cells, with less automaticity, located especially in the His bundle, bundle branches and Purkinje network; and (c) transitional cells.
- The contractile system made up of myofibers in which the contractile unit is the sarcomere (Figs 1.4A, 1.4B2, and 1.4B3), a structure that can contract and relax. The energy for this activity is provided by mitochondria.
1.5. The Electrophysiology of Cardiac Cells
1.5.1. Transmembrane Diastolic Potential (TDP) and Transmembrane Action Potential (TAP) in Automatic and Contractile Cells
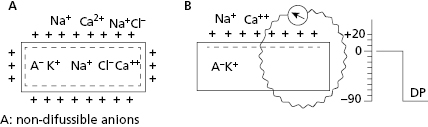
All contractile cardiac cells at rest show equilibrium between the external electrical charges and the internal negative charges (Fig. 1.5A). When a micro-electrode is located inside a contractile cell at rest while a second micro-electrode remains in the exterior (Fig. 1.5B), a difference in transmembrane potential, called the transmembrane diastolic potential (TDP), is produced. Under normal conditions the voltage is –90 mV (Fig. 1.5B). [E]
As contractile cells are not automatic; TDP is rectilinear (Fig. 1.6). This means that during the diastolic phase, an equilibrium between the potassium outward ionic current, and the sodium and calcium inward ionic current takes place.
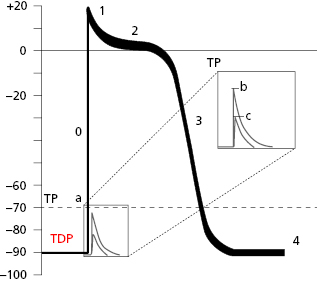
When the contractile cell receives a stimulus transmitted from a neighboring cell, sodium current enters the cell rapidly. This creates a stimulus upon reaching the threshold potential, which forms the transmembrane action potential (TAP) (Fig. 1.6).
Thus, in the contractile cells the formation of TAP (Fig. 1.6), which is the basis of cellular activation (depolarization and repolarization), takes place because a stimulus (a) transmitted from a neighboring cell, originating from a rapid entry of sodium, reaches the threshold potential (TP) and results in a TAP (b and c are stimuli under threshold potential) (Fig. 1.8B). The TAP has four phases: phase 0 that is the depolarization, the loss of external electrical charges, and phases 1 to 3 involve repolarization, the recovery of these charges. [F]
Cells of the specific conduction system (SCS) have an ascending TDP, because they present some diastolic depolarization due to a rapid inactivation of the potassium outward currents. The sinus node (SN) is the SCS structure with the greatest ascending TDP, and thus it presents the greatest automaticity, and is the physiological pacemaker of the heart.
The TAP in automatic cells (Fig. 1.7) takes place when the TDP reaches the threshold potential. This occurs at the exact point when the ionic curves of sodium (arising) and potassium (decreasing) cross (Fig. 1.8), resulting in the entry of sodium into the cell. This occurs more rapidly when the TDP curve is sharper, as in SN automatic cells.
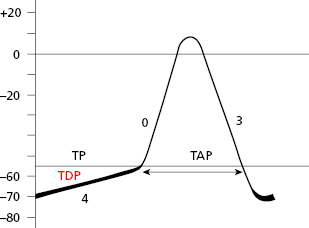
SCS cells after cellular depolarization (TAP) that present slow ascent (phase 0) (contractile cells) experience shorter repolarization phases (2 and 3).
1.5.2. Electroionic Correlation in TAP Formation (Figs 1.8 and 1.9)
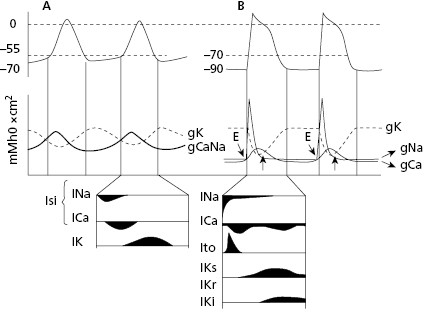
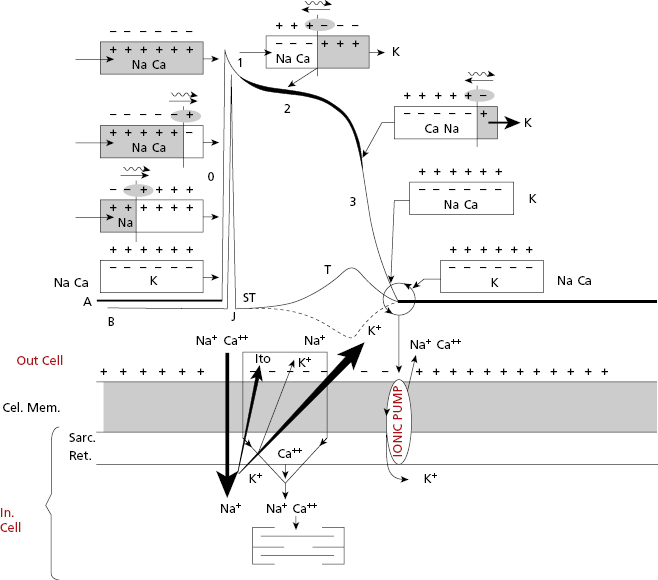
In both contractile (Fig. 1.6) and automatic cells (Fig. 1.7) TAP curves originate because first a rapid entry of sodium occurs, followed by sodium and calcium, into the cell during phase 0, or cellular depolarization. Later this is followed by a slow exit of potassium, resulting in the repolarization process (phases 2 and 3). Figure 1.8 shows this process in a contractile cell through the formation of the depolarization and repolarization dipoles, which will be explained in the next chapter (Bayés de Luna, 2012a). Figure 1.9 shows the most relevant ionic current in automatic (A), and contractile cells (B) during systole. [G]
1.5.3. Stimuli Transmission from the Sinus Node to the Contractile Myocardium
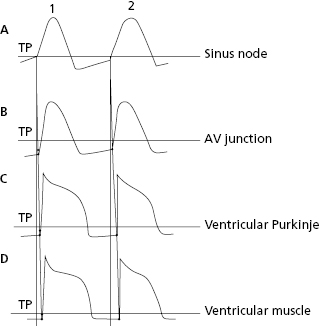
Figure 1.10 shows how stimuli are transmitted from the SN (the most automatic cells) to the AV node, branches and ventricular Purkinje fibers, which present progressively less automatism, and finally to the ventricular muscles (nonautomatic contractile cells). This process is explained in the next chapter in the section on heart activation and the domino theory.
Self-assessment
A. Which segment of the LV does the area previously known as the posterior wall correspond to?
Stay updated, free articles. Join our Telegram channel

Full access? Get Clinical Tree


