Recording Devices and Techniques
3.1. Recording Devices
Until recently, recording devices were analog, and recordings were generally made on thermosensitive paper.
Today we live in the digital age and devices are smaller, more versatile, and interactive, and may present simultaneous recordings on screen and paper (Fig. 3.1A, 1–3). There are even devices that can obtain an ECG recording by being held in the hands (Fig. 3.1A, 4). [A]
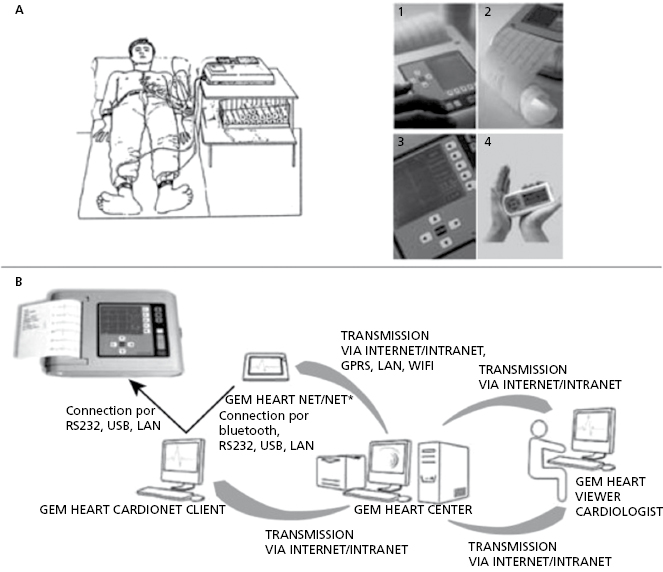
The tracing may be sent by internet or accessed from a stored file in the hospital’s computer system (Fig. 3.1B).
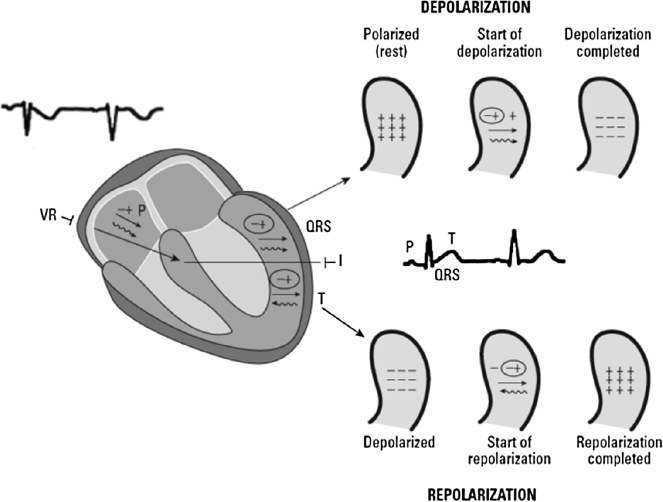
Figure 3.2 shows how the P wave, QRS complex, and T wave are recorded from an electrode located in a lead facing the LV, such as lead I, as well as a lead nearly opposite to it (lead VR).
3.2. The ECG Recording: a Step-By-Step Approach
The ECG recording must be carried out using the following steps: [B]
- The classic protocol involves connecting the device to an electrical source and connecting the electrodes to the device.
- The skin of the patient is cleaned and the electrodes are placed on the appropriate areas to obtain connections with corresponding leads. Four electrodes are placed on the limbs: the red electrode on the right wrist, the yellow electrode on the left wrist, the green electrode on the left leg, and the black, or indifferent electrode on the right leg. Today the upper arms are favored over the wrists, because they provide a better recording. These electrodes are used to record the leads of the FP. Additional electrodes are placed on several places on the trunk to record the precordial leads (V1–V6). It is very important to locate the precordial leads in the appropriate location (see Chapter 2 and later).
- The baseline should be adjusted so that the ECG recording is centered on the paper.
- The calibration of the device is tested. In all leads the height of the calibration deflection should be 1 cm (corresponding to 1 mV) (A). The distance between the two fine horizontal lines on the recording paper is 0.1 mV (1 mm) (see later). The morphology of the calibration deflection must also be tested. The slope of the plateau must go down gradually when the calibration button is pressed (A) (Fig. 3.3A).
- An adequate recording speed, normally 25 mm/s, must be used. In this case the distance between two vertical lines on the paper (1 mm) corresponds to 0.04 s (40 ms) and the distance between the two thick vertical lines (5 mm) corresponds to 0.2 s (200 ms) (Fig. 3.3B). A speed of 50 mm/s allows a longer distance between the intervals (QRS), but the quality of the recording, especially of the ST segment, is poorer.
- The line of the ECG recording must be kept centered on the paper or screen.
- It is important to avoid artifacts (Fig. 3.3C), such as those caused by an alternate current (2) and shaking (3), which contrast with a clean recording of a normal tracing (1).
- For each group of leads, a minimum 20 cm of tracing must be recorded. It is important to know when it is necessary to record a longer tracing (arrhythmias), or when to record during deep breathing (Q in lead III), and when to record with additional precordial leads (children, lateral or RV infarction, etc.).
- The accuracy of the tracing must be tested (II = I + III) and the different leads must be clearly identified.
- Today’s devices usually record leads at the same time, with a minimum of six, but more often 12. In order to correctly measure the PR and QT intervals it is necessary to use at least three leads (see Chapter 4).
- It is important to avoid artifacts (Fig. 3.3C), such as those caused by an alternate current (2) and shaking (3), which contrast with a clean recording of a normal tracing (1).

3.3. Recording Errors [C]
3.3.1. Electrodes Not Located at an Appropriate Place (see Section 4.10.4 in Chapter 4)
It is still very common to locate the electrodes inappropriately (see Figs 2.14, 2.16 and 2.18). The following are the most frequently committed errors (Garcia-Niebla et al., 2009):
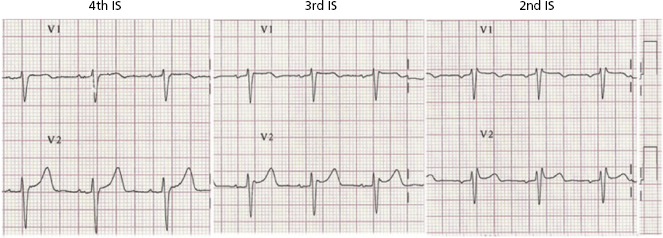
- A high placement (2EI) of V1–V2 electrodes can result in a morphology that includes a negative P wave and often a QRS complex with r’ (Fig. 3.4) that can be confused with a partial right bundle branch block or other pathologies or variants of normal ECG pattern (pectus excavatum, etc.). This disappears when the electrodes are placed on 4EI (see Chapters 2, 6 and 16).
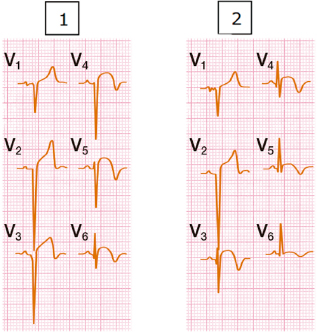
- The placement of leads V3–V4 too much to the right or left from the correct location (Fig. 2.18). In patients with anteroseptal infarction, this misplacement of V3-V4 may explain an appearance (1), or not (2), of an additional involvement of the lateral wall, due to the presence, or absence, of the pathologic QRS (qrS) in V5–V6 (Fig. 3.5).
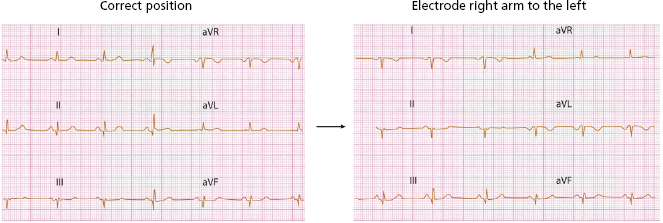
- Placing the electrodes on the left and right arms on the opposite side of eachother produces a morphology like dextrocardia. See in lead I, the negative P wave and the entire inverted ECG (Fig. 3.6).
- If V1 and V2 electrodes are placed high and separate from the sternum, the recording will resemble that of VR and VL. If the VL records a qR, pattern which occurs in the case of superoanterior hemiblock, the morphology in V2 may be very similar.
- Placing the electrodes on the left and right arms on the opposite side of eachother produces a morphology like dextrocardia. See in lead I, the negative P wave and the entire inverted ECG (Fig. 3.6).
3.3.2. The Correct Use of Filters
Thanks to digital technology, filter misuse occurs rarely. However, this is still a relevant problem with analog devices. Two situations in which filter misuse can modify the true image of the recording are:
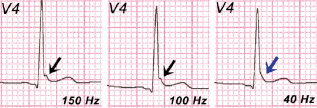
- Disappearance of an early repolarization pattern (Fig. 3.7).
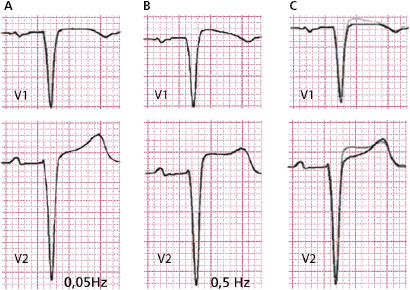
- Appearance of a false Brugada pattern (Fig. 3.8).
3.3.3. Artifacts
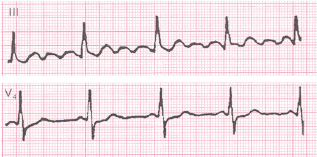
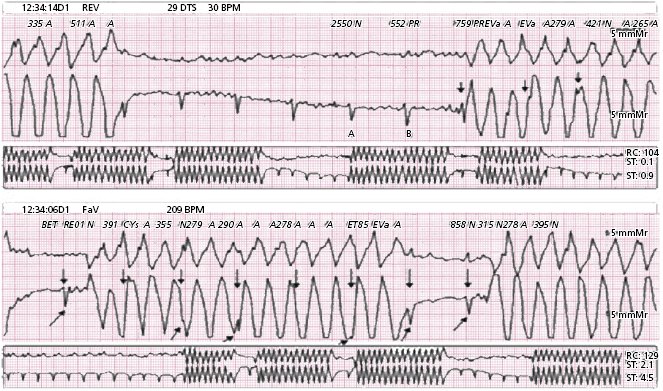
Artifacts may arise due to patient disorder, or to malfunctions of the recording device; we present below two examples. Shaking due to Parkinson’s disease is reflected in the FP leads by waves that mimick a pseudo flutter (Fig. 3.9). In a second example, a malfunction in the Holter recorder produces a false ventricular tachycardia (Fig. 3.10).
3.4. The Importance of a Barrier Factor [D]
The presence of any barrier factor that may affect, and generally reduce, the voltage of QRS may often be attributed to a cardiac pathology (pericardial effusion myocardial fibrosis, myocarditis, mixedema, heart failure, etc.) or an extracardiac pathology (pleural effusion, and pneumothorax). If it occurs in the left side, it may also produce a displacement of the heart.
QRS voltage is also heavily influenced by the build of the patient. Thin patients may show high voltages that simulate a left ventricular enlargement, while other patients, for example women with a large amount of breast fat, show low voltages, which can be even lower because of poor electrode placement (Bayés de Luna, 2012a).
Self-assessment
A. What are the advantages of digital ECG recording devices?
Stay updated, free articles. Join our Telegram channel

Full access? Get Clinical Tree


