ECG Recordings in Other Heart Diseases and Different Situations
In Chapter 9 we explained the most important aspects of ischemic heart disease, and in Chapter 15 we discussed the important role of the ECG in the diagnosis of precordial pain and other symptoms. In Chapter 16 we described the ECG patterns with a poor prognosis in asymptomatic patients. This includes ECG patterns of genetically induced heart disease and other ECG patterns with poor prognosis, some of which have been described in other parts of this book.
In this chapter we will look very closely at the ECG abnormalities most commonly found in other heart disease cases and different situations, including all types of myocardiopathy seen in patients with systemic or neurodegenerative disease (e.g. amyloidosis or neuromuscular disease).
17.1. Valvular Heart Diseases [A]
The most frequent ECG abnormalities are listed below.
17.1.1. Mitral Stenosis
- P wave of left atrial enlargement (LAE) (Fig. 5.2D).
- Atrial fibrillation (AF) is very common during the course of the disease.
- Right ventricular enlargement (RVE) in cases of overload of the right cavities (pulmonary hypertension) (Fig. 6.4A).
- If tricuspid involvement is present, biatrial enlargement and/or AF may occur (Fig. 5.4).
17.1.2. Mitral Regurgitation
- In advanced cases, signs of LAE and left ventricular enlargement (LVE) are present (Chapters 5 and 6).
- AF may also occur, but it is less frequent than in mitral stenosis.
- Apart from LVE, repolarization disturbances may take place, especially in inferolateral leads in patients with mitral valve prolapse.
17.1.3. Aortic Valve Disease
In the advanced phase of severe stenosis, regurgitation, or double aortic valve disease, we have already commented on the fact that (Figs 6.12A and 6.12B), the ECG generally presents a descending ST and negative asymmetric T wave morphology (strain pattern). This morphology may be modified when associated primary abnormalities exist (Fig. 6.12C).
In severe but not long-lasting cases, the ECG may be nearly normal even when echocardiography reveals LVE. A high voltage R wave with evident ‘q’ wave and horizontal ST followed by high, peaked, and symmetric T wave, sometimes followed by negative U wave, may be seen in V5–6. This pattern that is seen especially in severe aortic regurgitation that is not long-lasting, evolves with time to a typical pattern of LVE with strain (Fig. 6.12B). The voltage criteria of LVE are usually increased in advanced cases (see Chapter 6).
Isolated aortic valve disease is not usually accompanied by AF. If AF is present, associated mitral valve disease has to be ruled out. At the same time, in very advanced cases of calcified aortic stenosis advanced AV block may occur.
17.2. Myocarditis
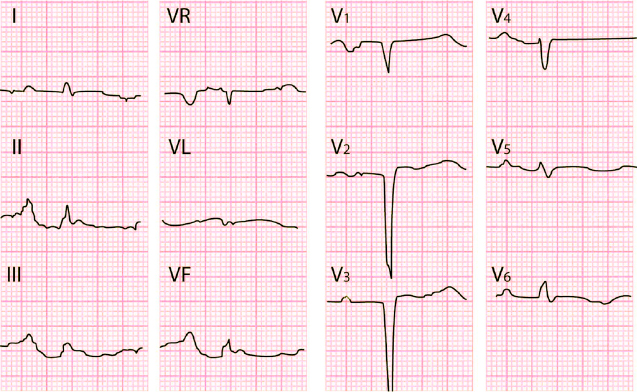
In the acute phase the following abnormalities may be observed (Fig. 17.1): [B]
- Sinus tachycardia.
- Low voltage QRS.
- Repolarization abnormalities: Flat or negative T wave or ST elevation (differential diagnosis with ACS).
- Intraventricular conduction disturbances (IVCD) and/or AV block.
- Pathologic Q, which is often reversible.
During the course of the process, these disturbances usually revert to a large degree, except in cases that evolve to cardiomyopathy. A flat T wave or some type of intraventricular conduction disturbance may remain as a residual pattern.
17.3. Cardiomyopathies
The ECG abnormalities found in different types of cardiomyopathy include the following:
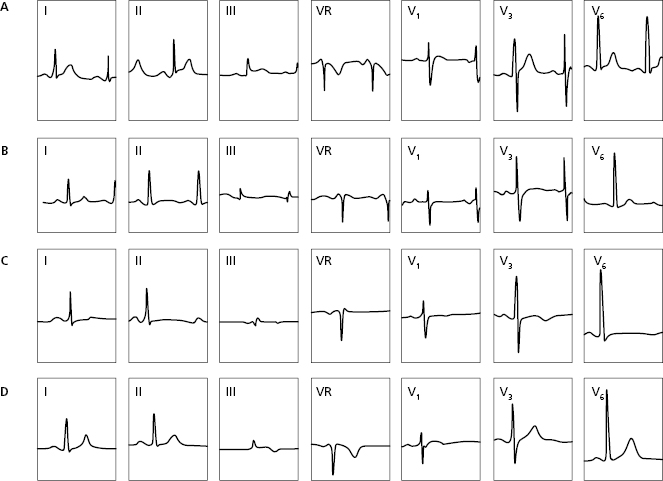
17.3.1. Genetically Induced Cardiomyopathies (see Chapter 16) [C]
17.3.2. Dilated Cardiomyopathy (DC)
The ECG is abnormal in more than 90% of patients if heart failure (HF) is present. It frequently involves:
- Sinus tachycardia or supraventricular tachyarrhythmia.
- Different types of intraventricular block. If heart failure is present, LBBB with QRS ≥140 ms requires resynchronization pacemaker implantation.
- RVE and/or LAE pattern.
- Ventricular arrhythmia.
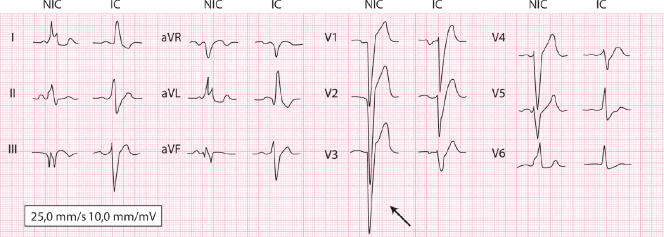
- In the DC of ischemic origin, S wave in V3, in the presence of LBBB, presents less voltage and more slurrings than in idiopathic DC (Fig. 17.2).
- In the case of LBBB, the presence of terminal R in VR suggests dilation of the RV (Van Bommel et al., 2011) (see Chapter 7) (Fig. 17.3).
17.3.3. Restrictive Cardiomyopathy
There are two types: infiltrative (e.g. amyloidosis or sarcoidosis, etc) (Fig. 17.4) or non-infiltrative (e.g. idiopathic or storage disease).
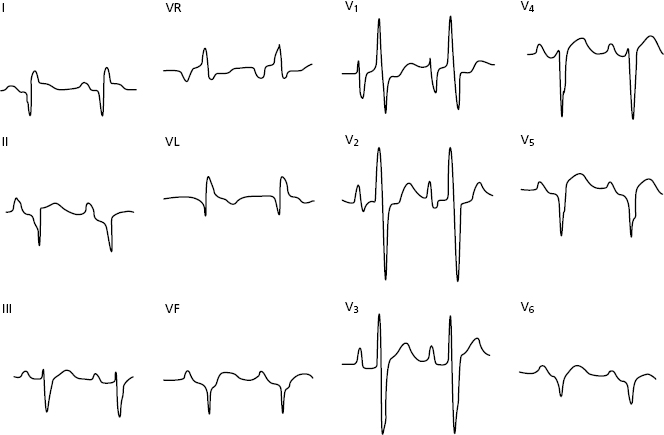
The ECG abnormalities most commonly observed are: (1) pseudonecrosis Q wave; (2) very abnormal P wave; (3) different types of ventricular block; (4) repolarization disturbances; and (5) often atrial fibrillation.
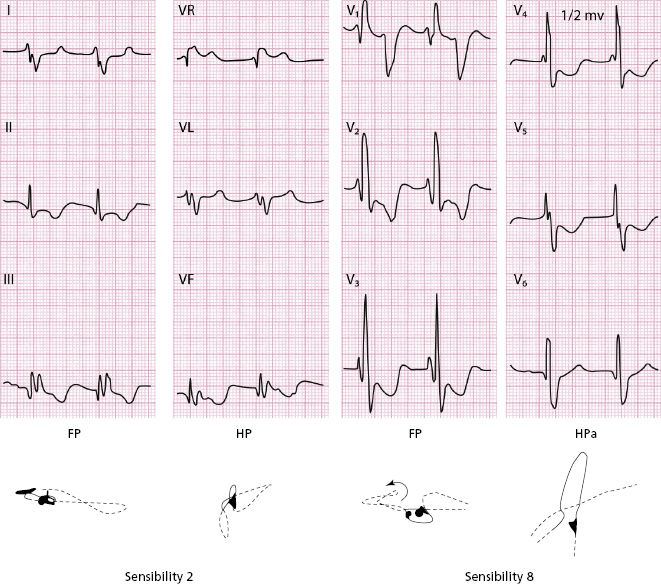
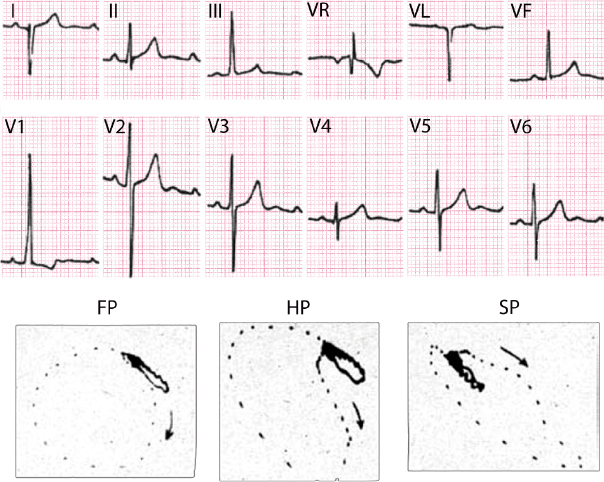
17.3.4. Cardiomyopathy in Neuromuscular Disease
Examples are Steinert disease, Friedreich disease, Duchene disease, etc. The ECG shows: (1) enlargement; (2) ventricular blocks; (3) Q of pseudonecrosis (Fig. 17.5); (4) R in V1 due to probable right ventricle or septal hypertrophy; and (5) repolarization disturbances.
17.4. Diseases of the Pericardium
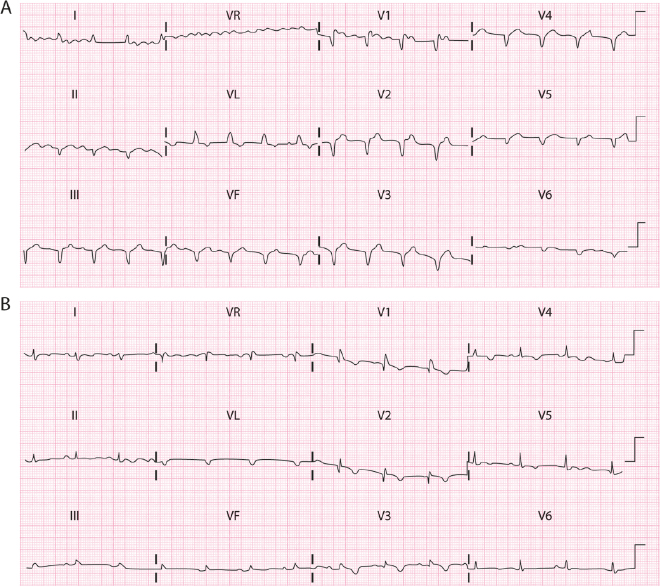
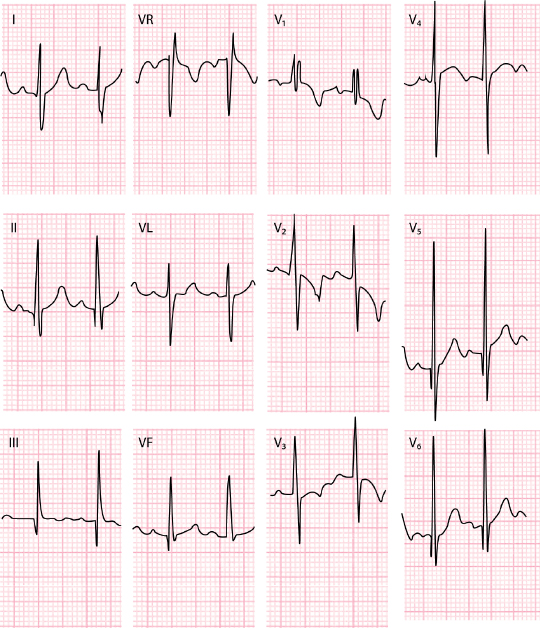
17.4.1. Acute Idiopathic Pericarditis [D]
Four ECG changes have been described that take place over time (Spodick, 1982) (Fig. 17.6):
- Phase 1. ST elevation that generally appears as a pattern of early repolarization and evolves to phase 2.
- Phase 2. The ST returns to isoelectric line.
- Phase 3. The T wave becomes negative.
- Phase 4. Return to normal pattern.
However, all of these changes are currently often not observed due to rapid treatment with anti-inflammatory medication.
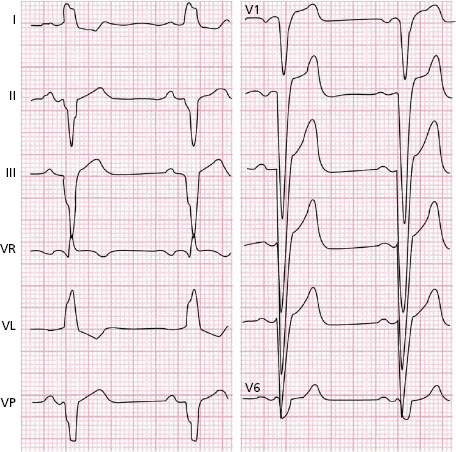
17.4.2. Pericarditis with Important Effusion
Sinus tachycardia and very low QRS voltage are very common, sometimes with slow increase of R voltage in precordial leads. In addition, alternans in the QRS complex may be observed in the presence of pericardial tamponade (Fig. 14.2A). [E]
17.5. Cor Pulmonale
The ECG changes indicating RVE that may be seen in chronic cor pulmonale (see Fig. 6.4C) and acute cor pulmonale, including pulmonary embolism (Figs. 15.3 and 15.4), have been described in Chapter 6. [F]
17.6. Congenital Heart Disease
The most characteristic abnormalities detected in the most common congenital heart diseases are listed below. [G]
- Atrial septal defect (ASD) (Fig. 6.6):
- V1 presents in many cases with rSR’, ECG pattern similar to partial RBBB that corresponds to RVE with dilation.
- In small ASD the rSR’ pattern may be missing.
- Atrial fibrillation (AF) in adults.
- Left ÂQRS in ostium primum ASD.
- V1 presents in many cases with rSR’, ECG pattern similar to partial RBBB that corresponds to RVE with dilation.
- Ventricular septal defect (VSD) (Fig. 17.7):
- In small VSD the ECG is usually normal.
- In large VSD signs of biventricular enlargement are seen, sometimes with high RS voltages in mid precordial leads and rSr’ in V1.
- In severe pulmonary hypertension (Eisenmenger syndrome), R wave may be high in V1.
- In small VSD the ECG is usually normal.
- Tricuspid atresia (Fig. 17.8):
- Left ÂQRS.
- P wave of right atrial enlargement.
- Left ÂQRS.
- Ebstein disease (Fig. 17.9):
- Atypical RBBB.
- High-voltage P wave.
- Sometimes delta wave (pre-excitation).
- Atypical RBBB.
- Pulmonary stenosis with intact septum (Fig. 6.5):
Depending on severity, various degrees of right ventricular enlargement (RVE), sometimes with R in V1-V2, are observed (Fig. 5.4C).
- Tetralogy of Fallot (Fig. 17.10):
RVE with R in V1, but with RS in V2, is common and differentiates from severe pulmonary stenosis with intact septum. In less severe cases RS with positive T in V1 may be recorded.
- Stenosis/coarctation of the aorta:
Signs of left ventricular enlargement (LVE) that are more or less relevant according to severity and time of evolution (Fig. 6.12A).
- Mirror-image dextrocardia:
Negative P is seen in V1. This may be also seen in the presence of ectopic rhythm, or inversion of right-left arms electrodes (Fig. 3.6). - Mirror-image dextrocardia:
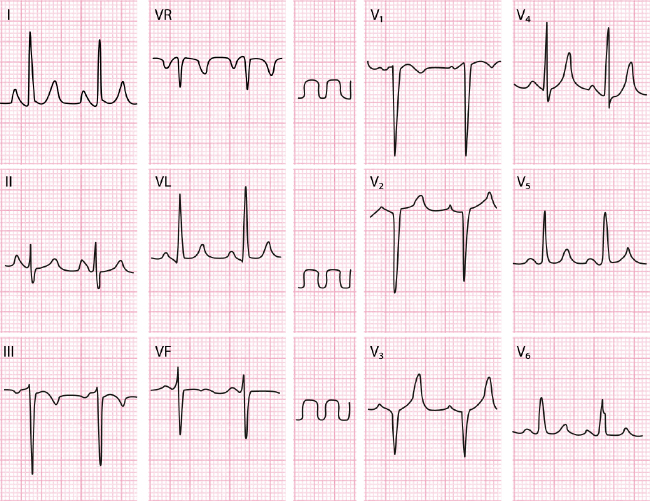
17.7. Arterial Hypertension (AH)
Generally, there is a strong relationship between the severity and time of development of AH and the ECG abnormalities. As previously discussed (Fig. 6.12C), the pattern of left ventricular enlargement (LVE) with strain is seen in advanced cases, and later than LVE is detected by echocardiography. However, the presence of clear signs of LVE indicates a poorer prognosis than the simple presence of LVH in the echocardiogram. Furthermore, the LVE pattern with strain may be reversible with treatment. [H]
The LVE ECG criteria are similar to those described in Chapter 6. The criteria with a higher SE (≥80%) are:
- RV6 | RV5 > 0.65.
- The global sum of the QRS voltage in the 12 leads >120 mm.
However, the other criteria described in Chapter 6 (Section 6.3.3) are more specific.
As previously stated, the signs of LVE, especially those related to repolarization, may improve with treatment of AH.
Frequently, in cases of mid/moderate AH when the LVE is even absent or not important, the ST/T wave shows mild changes that may also be seen in normal people especially the elderly (rectified ST and symmetric T wave in some leads) (see Fig. 6.11 and Section 4.7.1 in Chapter 4).
17.8. Athletes
It should be remembered that the ECG changes listed below may be related to physical training and therefore may disappear or diminish when physical activity is reduced. Thus, they do not indicate disease. [I]
- Sinus bradycardia that is sometimes considerable.
- First-degree AV block or even Wenckebach-type second-degree AV block when at rest or during sleep.
- rSr’ pattern in V1. The differential diagnosis with other processes with r’ inV1, including type 2-Brugada pattern, has to be performed (Fig. 16.5).
- High R voltage in left precordial leads.
- Early repolarization pattern (see Chapter 4).
- Isolated extrasystoles.
- Early repolarization pattern (see Chapter 4).
On the contrary, the following ECG abnormalities include:
- Negative T wave in ≥ two contiguous leads (Fig. 17.11).
- ST depression.
- Pathologic Q wave.
- Very abnormal P wave.
- Right of left advanced BBB.
- Ruling out Brugada pattern.
- Ruling out short and long QT.
- Clear signs of ventricular enlargement (strain).
- Significant arrhythmia (f.i. >I PVC in 12 lead ECG recording.
These are non-training related ECG findings and need further evaluation.
17.9. Drugs
Many medications can alter the ECG, especially in terms of repolarization (amiodarone, digitalis). Rarely, these medications can abnormally, and not homogeneously, prolong repolarization and the QT interval, producing a dangerous proarrhythmic effect, including SD (Chapter 16 and Bayés de Luna, 2012a). [J]
17.10. Other Repolarization Disturbances
As previously explained, repolarization may be altered by alcohol or glucose consumption and hyperventilation (Fig. 4.25).
Self-assessment
A. List the most characteristic ECG abnormalities observed in valvular heart diseases.
Stay updated, free articles. Join our Telegram channel

Full access? Get Clinical Tree


