ECG Patterns of Supraventricular Arrhythmias
In this chapter we describe the ECG characteristics of supraventricular arrhythmias. Their mechanisms have been explained in Chapter 10.
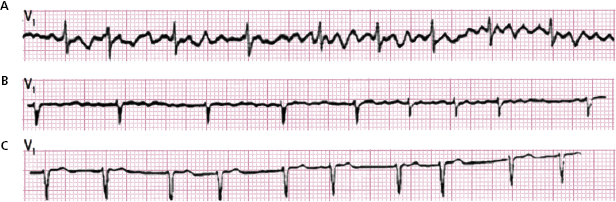
11.1. Premature Complexes (Fig. 11.1) [A]
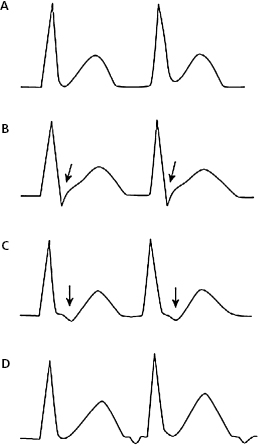
These are early complexes, usually extrasystoles (atrial paraxystole are very rare – see Bayés de Luna, 2011) due to atrial microreentry (Fig. 10.5). They may be conducted to the ventricles normally or with aberrancy, or be concealed in the AV junction. They may present normal or aberrant morphology (Fig. 11.1 A-C).
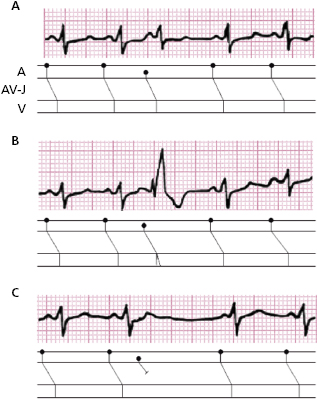
It is important to make a differential diagnosis between aberrancy and ectopy in cases of wide premature QRS. Table 11.1 lists the ECG criteria for each condition (see Chapter 10). [B]
Table 11.1 ECG evidence indicative of the presence of ectopy or aberrancy when early wide isolated QRS complexes are observed in the presence of sinus rhythm
|


 : and QRS morphology in V6:
 , particularly if QRS morphology in V6 is
Specificity ≥90%.
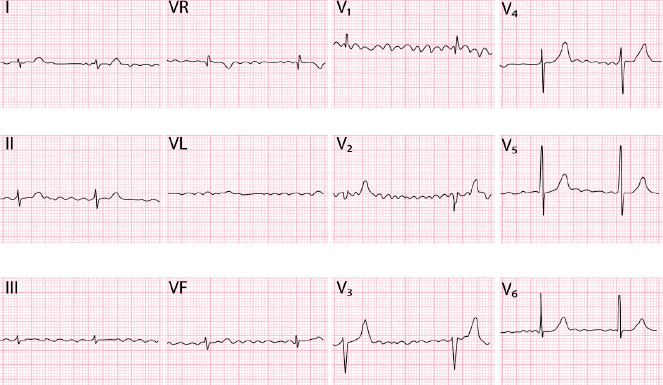
11.2. Sinus Tachycardia (Figs 11.2 and 11.3)
Sinus tachycardia (ST) occurs when the sinus rate automaticity exceeds 90 to 100 x′. Very rarely the mechanism is sinoatrial reentry. ST may be seen in patients with spontaneous or induced sympathetic overdrive and associated with many processes (e.g. fever, hyperthyroidism, heart failure) (Figs 11.2 and 11.3). It is often related to exercise and emotions, in which cases the sinus acceleration is quick and progressive and with more or less deceleration depending on the degree of exercise or emotion. Figure 11.2 shows an example of acceleration and deceleration during an intense emotional experience (a parachute jump). On rare occasions, they appear without evident cause (inappropriate sinus tachycardia).
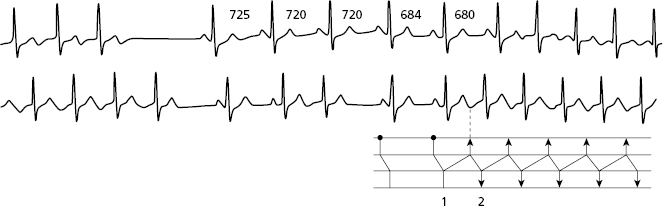
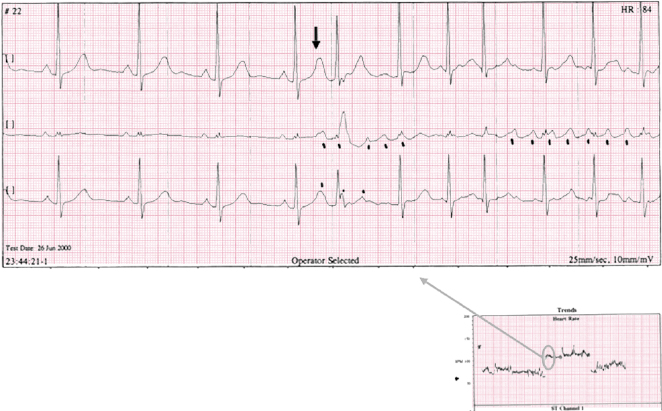
11.3. Monomorphic Atrial Tachycardia (E-AT) (Fig. 10.4)
In this case the P wave is not sinus but ectopic (often peaked and narrow) and is due usually to an increase in automatism of an ectopic focus or to atrial micro or macro reentry. Its rate tends to accelerate and decelerate at the start and end of the episode (Fig. 11.4). The site of origin of the tachycardia can be located using the morphology of the ectopic P wave; if the P′ wave is − or ± in V1, the origin is in the right atrium, and if P′ is + or −+ in V1, it is located in the left atrium. If P′ is negative in II, III, and VF, the origin is in the lower part of the atria in the AV junction or surrounding area. In general, the P′ wave is located before QRS with the following relationship: P′-QRS < QRS-P′ (Fig. 11.4). Often, the P′ wave presents a certain degree of AV block (Fig. 11.5). [C]

11.4. Reentrant Tachycardia of the AV Junction (See Fig. 11.6)
The mechanism is explained in Chapter 10 (Fig. 10.9).
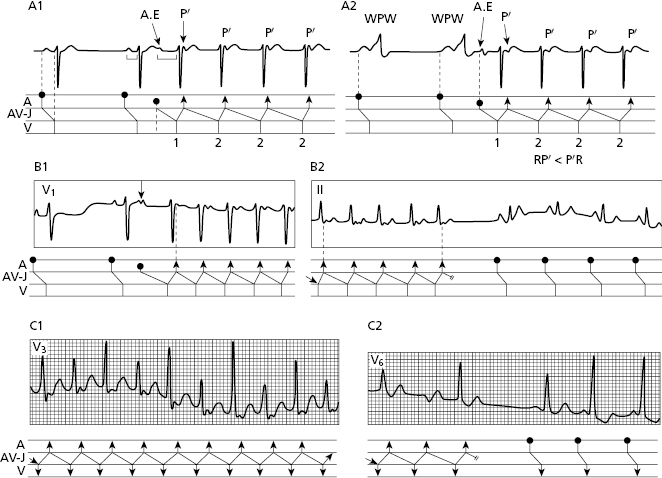
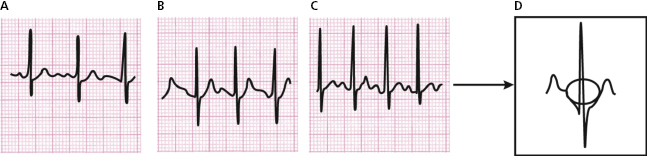
11.4.1. Junctional Reentrant Paroxysmal Tachycardia with Circuit Exclusively in the AV Junction (JRT-E) (Fig. 11.6 A-1 and B) [D]
In Chapter 10 (Fig. 10.9A) we have discussed the mechanism for this type of slow–fast tachycardia and the start and end of a crisis.
In this case, as the atrial activity is usually not seen separated from QRS, the P′-R relationship cannot be studied (Fig. 11.7).
11.4.2. Junctional Reentrant Paroxysmal Tachycardia with a Circuit Involving an Accessory Pathway (JRT-AP) (Figs 11.6 A.2 and C) [E]
The mechanism has been already discussed in Fig. 10.9B and there is a RP′ < P′R relationship.
Figure 11.6 C-1 shows QRS alternans during tachycardia that indicates the involvement of an accessory pathway (20% incidence). We also see how after the QRS complex, retrograde P′ is closely seen, with P′QRS > QRS-P′.
At the end of the tachycardia (Fig. 11.6 C-2) in the second complex, there is a clear delta wave (pre-excitation).
11.4.3. Significance of P′ Location in the Diagnosis of Supraventricular Paroxysmal Tachycardia (Fig. 11.7) [F]
To make the differential diagnosis between different types of paroxysmal tachycardia with regular RR, the location of the P′ wave is very important. Figure 11.8 contains a summary of all these possibilities (see figure legend).
11.4.4. Antidromic Tachycardia. Antegrade Conduction through Accessory Pathway
This type of tachycardia has to be differentiated from VT (see Section 8.2.4 in Chapter 8 and Section 12.2.3.2 in Chapter 12).
11.4.5. Repetitive Reentrant Tachycardia of the AV Junction (Fig. 11.8)
This type of tachycardia, described by Coumel in 1974, is very rare and is more common in children. It begins with a critical shortening of the sinus RR. It is a fast–slow-type tachycardia with the anterograde arm in the SCS and the retrograde arm in a slow accessory pathway (Farré et al., 1979).
11.5. Ectopic Tachycardia of the AV Junction (JT-EF)
This tachycardia may be paroxysmal (Figs 11.9 and 11.10) or non-paroxysmal (progressive start and end). This tachycardia is often seen in the past due to digitalis intoxication. Today, it is very rare. [G]
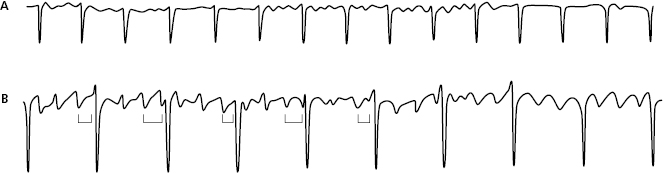
AV dissociation is often present. The basal atrial rhythm may be sinus (A) (Fig. 11.9), atrial flutter (A) or atrial fibrillation (B) (Fig. 11.10). When the ectopic tachycardia in the AV junction is dissociated from atrial flutter, it presents regular RR and irregular FR intervals (Fig. 11.19B). In cases of atrial fibrillation, the presence of regular RR with a fast rate may be explained by dissociated ectopic tachycardia in the AV junction (Fig. 11.10A).
11.6. The Differential Diagnosis of Supraventricular Paroxysmal Tachyarrhythmias with Narrow QRS and Regular RR Intervals (Fig. 11.11 and Table 11.2) [H]
The algorithm in Figure 11.11 shows the differential diagnosis of all these types of tachyarrhythmias with regular RR interval and narrow QRS based on whether or not an atrial wave is seen and where it is located and the Table 11.2 shows the different ECG characteristics of different regular supraventricular tachycardias with narrow QRS.
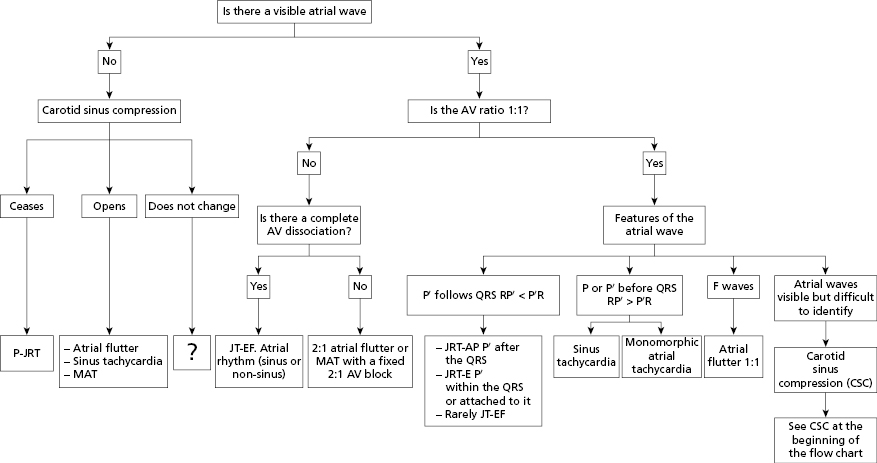
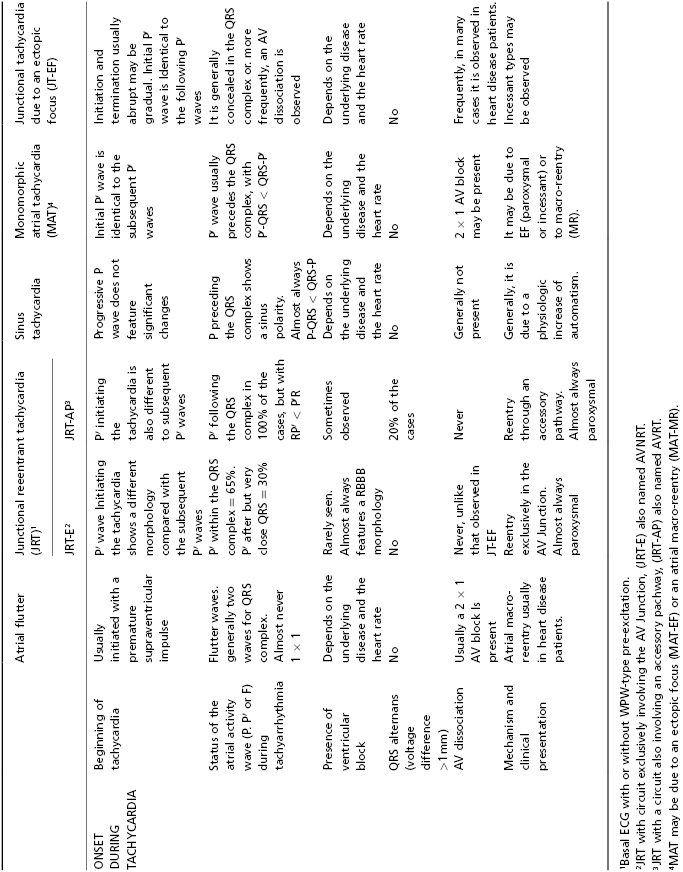
Table 11.2 Electrocardiographic characteristics of the different types of paroxysmal supraventricular tachyarrhythmias with regular RR and narrow QRS complexes1
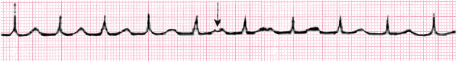
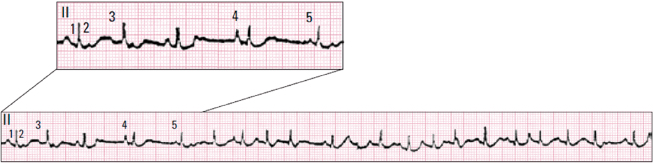
11.7. Chaotic Atrial Tachycardia (Fig. 11.12)
The diagnostic criteria of this infrequent tachycardia seen particularly in patients with decompensated cor pulmonale (hypoxia) are as follows (Fig. 11.12): [I]
- Variable PP and PR intervals that produce irregular rhythm. The differential diagnosis of atrial fibrillation through palpation is very difficult to perform;
- The presence of three or more P wave morphologies;
- An iso-electric line between P waves;
- The absence of a dominant rhythm.
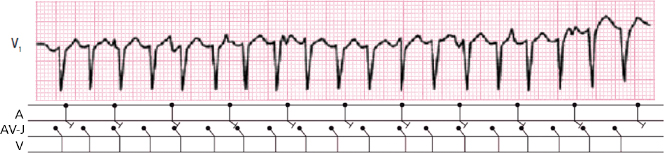
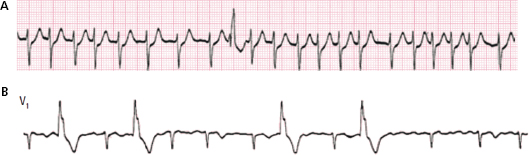
11.8. Atrial Fibrillation
This mechanism has been explained in the previous chapter (Fig. 10.12).
The ECG characteristics of this common atrial tachycardia are as follows:
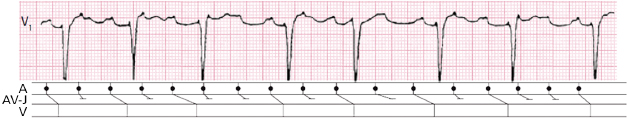
- The presence of fibrillation waves (f wave) that have low voltage and a rate of between 350 and 700 bpm (Fig. 11.13). [J]
- An irregular ventricular rhythm due to the variable penetration of the f waves in the AV junction. The ventricular rate also depends on the degree of AV block that exists (Fig. 11.13).
- The QRS can be narrow or wide (aberrancy or fixed bundle branch block).
- It cannot coexist with atrial extrasystoles but often there are early wide QRS complexes (ventricular extrasystoles or aberrancy) (Fig. 11.16) or late wide QRS complexes (ventricular escapes).
- Occasionally, the f waves are so small that they are not clearly visible. They are better seen in V1 (Figs 11.13 and 11.14).
- At the end of an episode of AF there is sometimes a long pause that may or may not be followed by a sinus P (sick sinus syndrome).
- The bradytachycardia syndrome (Fig. 17.9) presents long pauses in sinus rhythm with episodes of atrial flutter or fibrillation. [K]
- The AF may be paroxysmal or permanent (Fig. 11.15).
- Episodes of paroxysmal AF usually start with a very early atrial extrasystole (Fig. 11.15). At present, if this condition is not resolved by change of habits (no alcohol intake) and/or adequate medication, ablation of the pulmonary veins may be carried out. [L]
11.9. Atrial Flutter
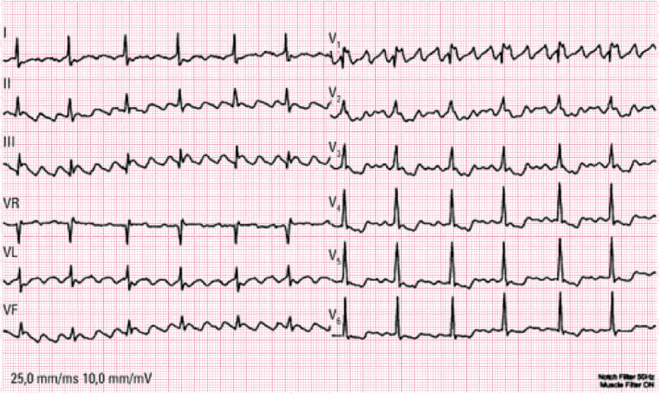
This mechanism has been explained in the previous chapter (Fig. 10.8). The ECG characteristics of this common arrhythmia, which is often transitory, include: [M]
- This is a well-organized and regular fast arrhythmia (250–300 bpm) that presents identical atrial waves (flutter waves) with no isoelectric lines between them.
- The flutter waves are slowed (≈200 bpm) by certain drugs.
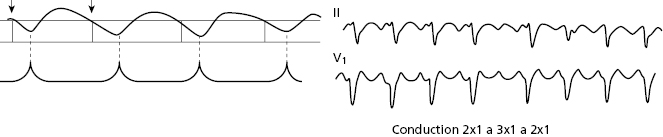
- The AV conduction is usually 2 × 1 and fixed, but the conduction may also be 1 × 1, 3 × 1, or greater, and often the conduction is variable from one moment to the next (Figs 11.17 and 11.20).
- In common flutter, the F waves originate from an anticlockwise reentry in the right atrium and in no common flutter (reverse flutter) are originated from a clockwise reentry in this atrium (Fig. 11.8 A and B).
- The F waves are seen in the ECG as follows: [N]
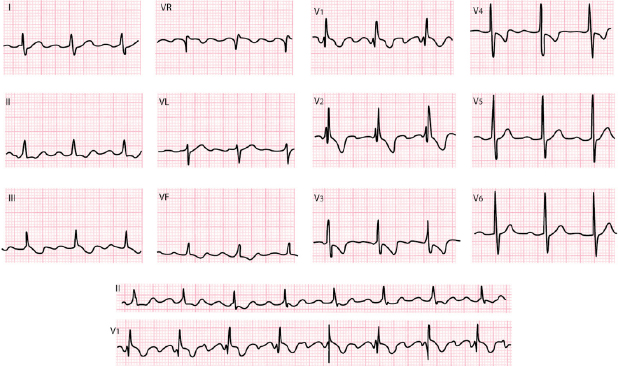
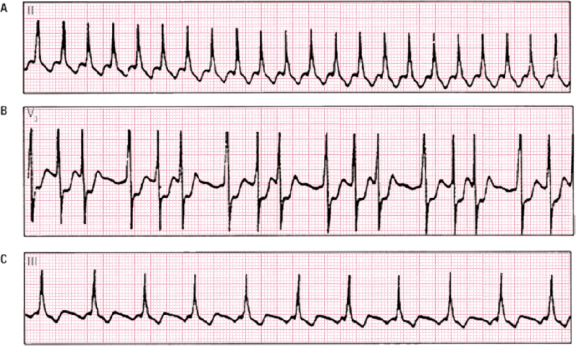
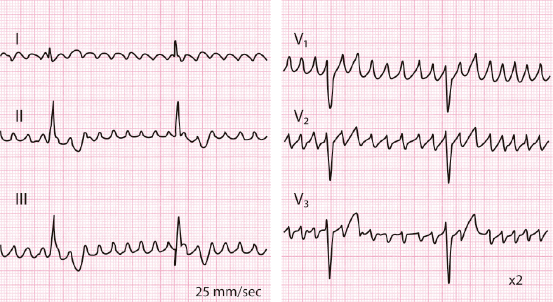
- Common flutter: (a) II, III, and VF. Flutter (Fl) waves without an isoelectric line, presents a sawtooth morphology with clear negativity; (b) V1 Fl waves are positive (Fig. 11.18).
- No common flutter (reverse): (a) II, III, and VF. Fl waves are generally wide and positive without isoelectric line; (b) V1. Fl waves are predominantly negative F waves (Fig. 11.19). [O]
- There other types of flutter with different morphologies included in the group of atypical flutter (see before). The characteristics of left arium atypical flutter have been explained in Chapter 10. The ECG presents positive T waves in V1 and II, III, VF and negative in lead I at >200–220 bpm. At least in some leads there is an isoelectric line (Figs 10.8C and 11.21). In fact, macroreentrant tachycardias originated in the left atrial may present similar morphology, but with a slow atrial rate (<200 bpm) (see above). [P]
- Common flutter: (a) II, III, and VF. Flutter (Fl) waves without an isoelectric line, presents a sawtooth morphology with clear negativity; (b) V1 Fl waves are positive (Fig. 11.18).
Self-assessment
A. Describe the concept of the premature supraventricular complex (PSVC).
Stay updated, free articles. Join our Telegram channel

Full access? Get Clinical Tree


