CHAPTER 50 Ventricular Mechanics
In Chapter 49, the myocardium at the cellular and subcellular level was considered. In this chapter, we will look at the mechanics of the heart at the tissue and organ level. We will focus primarily on the left ventricle, but short discussions of left atrial function as it relates to left ventricular (LV) filling and ventricular interaction will be included. First, we will review several important myocardial structural elements, an understanding of which is necessary to appreciate function during active contraction (systole), relaxation, and filling (diastole). Next, we will review the cardiac mechanical and flow events that comprise the cardiac cycle. We will then cover diastolic and systolic function, with an emphasis on pressure–volume analysis. A discussion of pump function, myocardial energy expenditure, and myocardial efficiency will follow. The finite-element method will be briefly discussed as a means to calculate regional contractility and stress. Furthermore, in each section, we will consider the effect that common clinical conditions such as ventricular hypertrophy and myocardial ischemia have on ventricular function. Where appropriate, we will briefly describe state-of-the-art methods used to measure regional and global LV function.
STRUCTURE OF VENTRICULAR TISSUE
Myocyte Orientation
The orientation of myofibers is complex, with variation across both the LV wall and in different LV regions. The orientation of myofibers was first quantified by Streeter and colleagues,1–4 who measured myocyte orientation in tangential sections obtained across the LV wall of the dog heart and found a smooth transition in the helix angle (in the tangential plane relative to the horizontal) from the epicardium (−60 degrees) to the endocardium (+60 degrees). Myofiber orientation data collected by Streeter are displayed in Figure 50-1.1 Other studies using this histologic sampling confirmed his results in different species.2–6
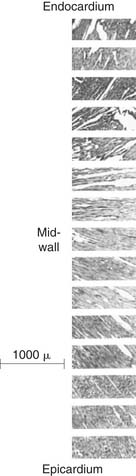
Figure 50–1 Photomicrographs of myocardial fiber orientation.
(From Streeter DD Jr, Hanna WT. Circ Res 1973;33[6]:656–64.)
Recent advances in magnetic resonance imaging (MRI) now allow rapid and nondestructive assessment of muscle fibers throughout the entire heart. Magnetic resonance diffusion tensor imaging exploits the anisotropic diffusion of water through ordered tissues. This method has been correlated with histologically measured fiber angles2–4 and has been used to thoroughly map the fiber orientation in the entire left ventricle of a normal rabbit, goat, sheep, and human.2,3
Laminar Organization of Myocardium
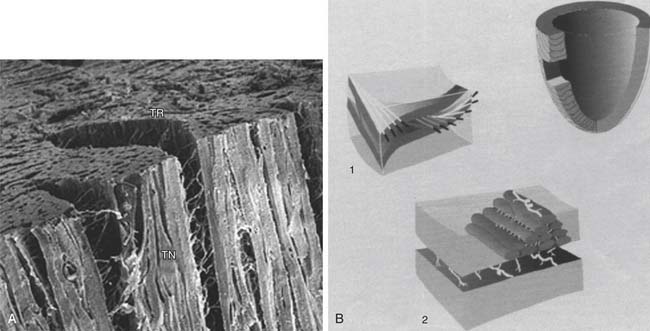
The laminar nature of the myocardium has been appreciated since the 1800s.2 Adjacent myocytes are organized into sheets, or lamina, that are three to four cells thick.3,4 Furthermore, there are extensive cleavage planes between sheets3,4 that are most apparent in the midwall of the left ventricle where the planes are radially oriented. The laminar organization of the left ventricle has been recently championed by Torrent-Guasp’s group,3 who suggested that the left ventricle consisted of a single folded myocardial band. Alternatively, Lagrice and colleagues proposed a finite-element–based mathematical model that represents sheet geometry.4 A diagram of the laminar architecture of the myocardium is shown in Figure 50-2.4
Extracellular Matrix
The ECM is an important determinant of LV diastolic compliance. Scanning electron microscopy of the ECM demonstrates an extensive network of collagen fibers that are organized into three primary components.5 Briefly, the endomysium surrounds individual cells and groups of cells, and the epimysium surrounds entire muscle groups.6 Perimysial fibers that connect groups of cells can be seen in Figure 50-2A. Perimysial fibers associated with papillary muscle myocardium have a coiled shape that may play an important role in papillary muscle strength and stiffness.7
THE CARDIAC CYCLE
Cardiac Cycle per se
Plots of the electrocardiogram (ECG) and of the left atrial, LV, and aortic pressures during the cardiac cycle are schematically illustrated in Figure 50-3. Depolarization and contraction of the left ventricle raises intracavitary LV pressure. First, this causes the mitral valve to close. When LV pressure exceeds the pressure in the aorta, the aortic valve opens and pressurized blood is ejected into the aorta.
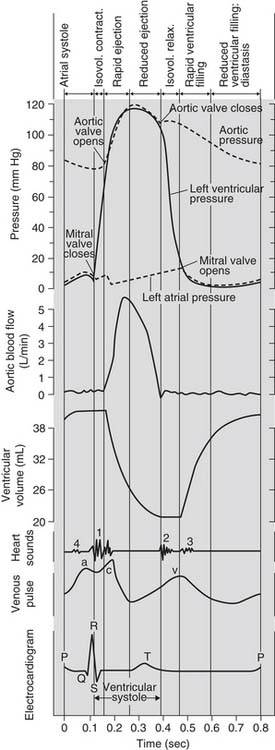
Figure 50–3 The cardiac cycle.
(Adapted from Hurst JW, Logue RB: The heart. 2nd ed. New York: McGraw-Hill; 1970, p. 76, and from Notomi Y, Martin-Miklovic MG, Oryszak SJ, et al. Circulation 2006;113[21]:2524–33.)
The Pressure–Volume Loop
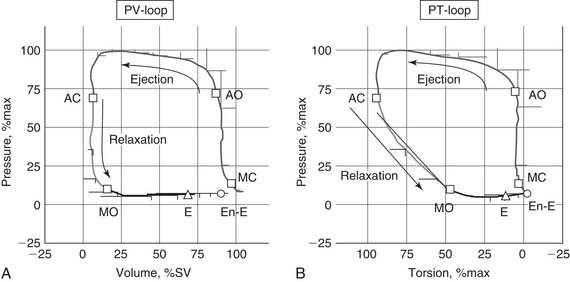
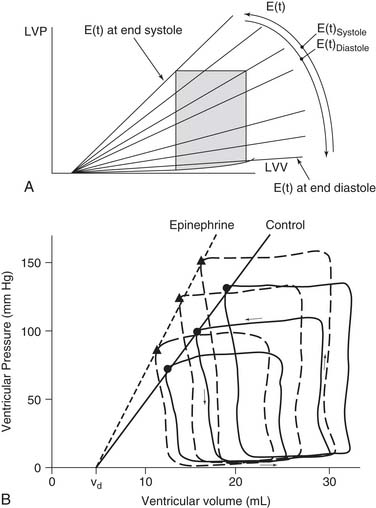
Pressure and volume of the left ventricle are plotted as shown in Figure 50-4A. Active contraction (systole) begins at the bottom right corner of the loop. Contraction is isovolumic until the aortic valve opens at the top right corner and the ventricle ejects. The end of systole occurs at the upper left hand corner of the loop.
DETERMINANTS OF LEFT VENTRICULAR FILLING
Pressure–Volume Analysis
Pressure–volume analysis of the cardiac cycle is a cornerstone of LV mechanics. Pressure–volume analysis was initially described in 1895 by Otto Frank,8 but the analysis was limited by the lack of suitable methods to measure LV pressure and volume. In the 1960s, interest in pressure–volume analysis was renewed with the development of methods such as cineangiography9 and echocardiography10 that could measure ventricular volume in vivo.11
Cardiac imaging methods have advanced substantially. The imaging method most widely used for studying the heart is still echocardiography, which can also be used to measure flow velocities (or at least the component of velocity along the line of the ultrasound beam), through the Doppler effect.12
MRI provides high-quality, spatially registered images that can be used to calculate volumes. MRI is the gold standard for cardiac global function volume measurements.13 Although recent advances have been made in imaging quality and speed with computed tomography (CT), MRI provides better temporal resolution, and it does not risk radiation exposure and potentially harmful contrast agents.13 Because CT, MRI, and three-dimensional (3D) echocardiography build collated data sets from multiple cardiac cycles, they can be used only when the rhythm is regular and the hemodynamic properties are in steady state.
The conductance catheter is best for real-time volume measurement during changes in LV preload or afterload.14 However, its inability to measure absolute ventricular volume because of parallel conductance is a limitation of the method.14
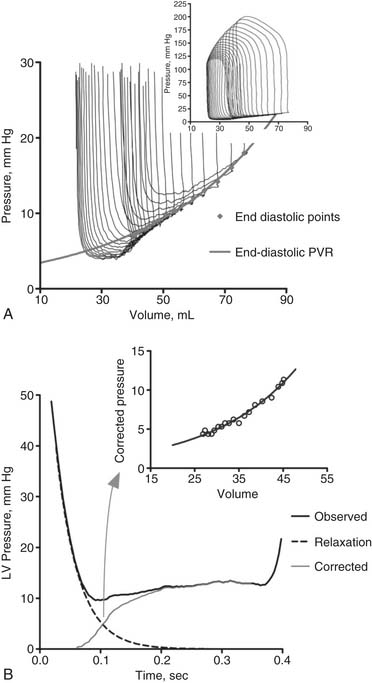
Pressure–volume loops remain similar unless loading or the strength of contraction (contractility) is changed. If preload or afterload is changed—for example, by clamping the vena cava or aorta while contractility remains the same—a family of curves is generated. The end-diastolic and end-systolic points subtend two lines. The end-diastolic line, referred to as the end-diastolic pressure–volume relationship (EDPVR) or ventricular compliance curve, is typically curvilinear. A typical EDPVR relationship is displayed in Figure 50-5A. The end-systolic line, referred to as the end-systolic pressure–volume relationship (ESPVR) or end-systolic elastance, is nearly straight. The ESPVR relationship will be discussed further.
End-Diastolic Pressure–Volume Relationship
The EDPVR (or left ventricular compliance) is typically described by an exponential relationship,11
Statistical comparison of EDPVR between subjects before and after interventions is an issue. A t-test is not appropriate because it fails to take colinearity into account.15,16 As seen in Equation 2, a logarithmic transformation allows the use of multiple linear regression, but the offset term (A) must be removed15,16:
Box 50-1 has a short list of mechanical factors that combine to determine the EDPVR.
Myocardial Stiffness
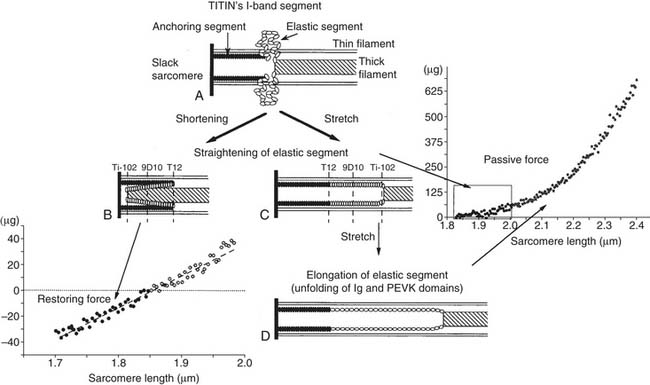
Myocyte and ECM stiffness (discussed earlier) are determinants of global LV diastolic function. The passive stiffness of the myocyte is dependent on the giant intracellular protein titin. As discussed in Chapter 49 (see Fig. 49-3), the Z-line (or Z-disc) is the center point of the I band and the attachment point of actin (thin filament). The M-line is the center point of the A band (myosin; thick filaments). Titin molecules extend from the Z-line to the M-line.17 Successive titin molecules are in head-to-head and tail-to-tail arrangements, creating a continuous protein structure that extends the entire length of the myocyte. The majority of titin’s I band region is extensible and functions as a molecular spring that develops a restoring force when the cell is stretched17 or compressed.18 A diagram showing the structure of titin is seen in Figure 50-6.18
Myocyte Relaxation
LV relaxation, a component of early diastolic filling, is an energy-dependent process involving the removal of Ca2+ from troponin-C, followed by the dissociation of actin and myosin cross-bridges, thus allowing the myofibrils to relax and to return to their original end-diastolic length.19 A typical LV relaxation curve is seen in Figure 50-5.B20

where P is left ventricular pressure, P0 is the pressure at the time of dP/dtmin, t is time after dP/dtmin, and T is the time constant of isovolumic pressure fall.21 Figure 50-5B demonstrates how relaxation pressure (see Equation 3) can be subtracted from actual diastolic pressure data to obtain a corrected pressure.20
Left Ventricular Torsion and Recoil
The myofiber architecture described previously (see Structure of Ventricular Tissue) causes the left ventricle to undergo torsion during systole. The magnitude of torsion is a function of myocyte contractility.22 As myocyte contraction and torsion occur, extracellular collagen matrix23 and intracellular titin are compressed.17 Untwisting occurs in early diastole, with 40% of the left ventricle untwisting during isovolumic relaxation (see Fig. 50-4B).24
LV untwisting continues during ventricular filling. Mitral valve opening is immediately followed by the development of a pressure gradient between the LV apex and base,25 which determines early LV filling.26 The rate of untwisting is a predictor of the pressure gradient between the LV apex and base, as well as of the time constant of diastolic relaxation.27 Finally, the rate of recoil is a preload-independent assessment of LV relaxation.28
Ventricular Suction
The presence of negative intracavitary LV pressure in early diastole was shown in a series of elegant experiments by Meisner and colleagues29 and Yellin and coworkers,30 in which a Starr Edwards mitral prosthesis was modified to close during diastolic filling. Data from one of Yellin’s experiments, in which mitral valve occlusion caused a negative LV pressure (to the right of the gray bar), is shown in Figure 50-7.30
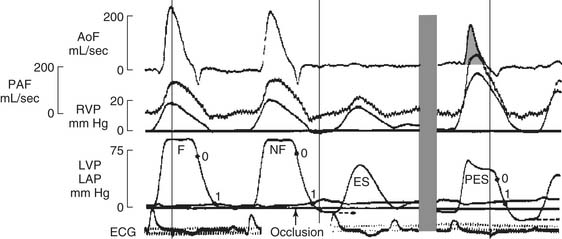
It is now thought that ventricular suction is caused by LV untwisting and the elastic recoil of the compressed myocytes in early diastole. The concept is that end-systolic volume is smaller than the diastolic equilibrium volume.31 As a consequence, depending on the time course of myocyte relaxation, the left ventricle generates the negative intracavitary pressure described earlier. In short, ventricular suction helps to draw blood into the chamber across the mitral valve.
Echocardiographic Measures of Diastolic Function
Most clinical measurements of diastolic function focus on echocardiographic Doppler transmitral blood-flow patterns. Normally, early flow (E wave) is higher than that associated with atrial contraction (A wave). Mitral flow patterns are displayed in Figure 50-8.32 Diastolic dysfunction is typically associated with a reversal of the E-to-A ratio.33 However, the E-to-A ratio in dilated cardiomyopathy may range between complete A-wave dominance, which suggests decreased ventricular compliance, and a “pseudonormalized” pattern (E-wave dominance).34 Mitral flow patterns are difficult to interpret, however, because of confounding factors, including atrial pressure, ventricular relaxation time, and mitral regurgitation.35 In addition, aging is associated with a decrease in the E-to-A ratio, possibly related to increasing myocardial fibrosis with age.36 Abnormal mitral flow patterns are also seen in Figure 50-8.32
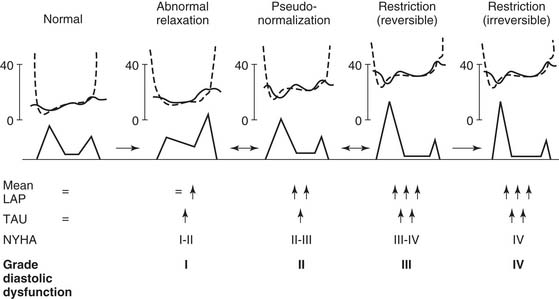
Figure 50–8 Diagram of a proposed grading system for diastolic dysfunction based on the progression of disease patterns in patients with cardiac disease. LAP, left atrial pressure; Tau, time constant of left ventricular relaxation (see Equation 3); NYHA, New York Heart Association class.
(From Nishimura RA, Tajik AJ. J Am Coll Cardiol 1997;30[1]:8-18.)
Atrial Contraction
The atrial contraction near the end of ventricular diastole augments the final filling of the ventricle before the next ventricular contraction.37
Diastolic Dysfunction from Myocardial Ischemia
Acute coronary occlusion causes the EDPVR to shift up and to the left.38 It was initially thought that the change in EDPVR was caused by an increase in myocardial passive stiffness. However, it is now thought that the change in EDPVR is secondary to increased right ventricular pressure mediated by an intact pericardium (see Ventricular Interaction and Pericardium, later).39 Anterior myocardial ischemia is also associated with a decrease in the pressure gradient between the LV apex and base that normally occurs during the rapid filling phase of diastole. The mechanism is thought to be loss of LV torsion resulting from reduced myocardial contractility, and the subsequent inability to store energy that would be released during elastic recoil.25 Patients with dilated cardiomyopathy show abnormally low diastolic suction.40 The mechanism may be similar.
Diastolic Dysfunction from Hypertrophy
Concentric hypertrophy is hypertrophy of the left ventricle in which the ratio of wall thickness to ventricular radius is increased.41 It is commonly caused by hypertension and aortic stenosis. The cause of diastolic dysfunction in concentric hypertrophy is thought to be an increase in myocardial stiffness rather than a change in myocardial relaxation or recoil.42 In patients with aortic stenosis, diastolic dysfunction is found in approximately 50% of the patients with normal systolic ejection performance and in 100% of the patients with depressed function.43
SYSTOLIC FUNCTION AND END-SYSTOLIC ELASTANCE
Cardiac Output and Cardiac Index
and the cardiac output is the stroke volume multiplied by the heart rate (HR):


The Swan-Ganz Catheter
The indicator dilution technique is widely used to estimate CO and thermodilution, and the Swan-Ganz catheter is the most common method of indicator dilution.44 Briefly, a room-temperature bolus of saline is injected into the right atrium through the proximal port of the Swan-Ganz catheter. A thermistor in the tip of the catheter measures the change in temperature as the bolus of saline is carried through the pulmonary artery.44 Thermodilution cardiac output compares favorably with measurement of cardiac output using the Fick principle.45
The Swan-Ganz catheter is used in many cardiac surgery units. However, there has been recent controversy over the risk benefit of the device.46 Complications, including right ventricular perforation and pulmonary artery rupture, occur in 0.1% of patients.47 A recent meta-analysis found the odds ratio to be 1.0.48
Ejection Fraction
The ratio of the SV to the ED volume is the ejection fraction (EF):

Both cardiac output and ejection fraction are sensitive to afterload. Specifically, the greater the afterload (resistance to flow), the lower the CO and EF will be. Also, procedures and operations that alter ventricular size and material properties can cause an increase in ejection fraction that does not represent a true increase in ventricular pump function. This point has been made by Dickstein and colleagues49 in regard to Batista’s operation and by Wall and colleagues50 in regard to cell transplantation. It is therefore incorrect to conclude that when a surgical procedure increases ejection fraction, pump function has improved.
The End-Systolic Pressure–Volume Relationship
Suga, Sagawa, and coworkers, and others, developed the ESPVR concept and suggested that it could be used as an index of global ventricular contractility.51–56 In principle, the measurement of ESPVR is straightforward. It requires only the acquisition of ventricular pressure–volume (PV) loops at two or more preload or afterload conditions. The end-systolic points on these PV loops are identified, and a line is drawn through them; the slope of this line is the end-systolic (peak) elastance, or EES.51–56 The ESPVR is of great value because it is inherently load independent. However, it must be recognized that the ESPVR is not pump function per se, as it does not take diastolic function into consideration. As with EF, this point has been made by Dickstein and colleagues with regard to Batista’s operation.49
EES is typically described by the following equation:
where ES is end-systole, and EES and V0 are the slope and volume intercept of the ESPVR curve, respectively.54 Note that a shift of the ESPVR curve up and to the left represents an improvement in systolic chamber stiffness. As an example, the effect of epinephrine on the ESPVR is seen in Figure 50-9 (dashed line). A shift of the curve down or to the right means that systolic function is worse. Note that both the slope and the intercept can change.11
PUMP FUNCTION
The Frank-Starling Relationship
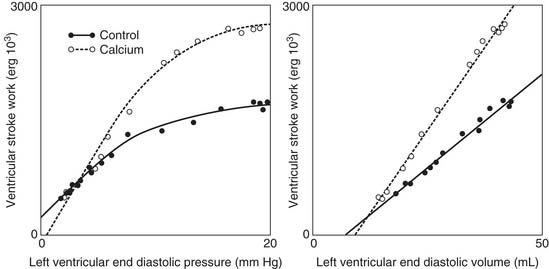
Cardiac output is regulated by intrinsic cardiac and extrinsic regulatory mechanisms. The Frank-Starling relationship is the principal intrinsic cardiac regulatory mechanism. In 1914, Patterson and Starling described the relationships between stroke volume and end-diastolic volume, and between stroke volume and end-diastolic pressure.58,59 Starling’s work was remarkable in that he did not possess cardiac imaging and relied on the displacement of water in a cylindrical container surrounding the heart as a measure of LV volume. The relationship between stroke volume and end-diastolic pressure is typically referred to as the Frank-Starling relationship or Starling’s law.
The molecular determinants of the Frank-Starling relationship are discussed in Chapter 49. Briefly, the magnitude of the force generated by the myocytes is dependent on their initial length at the time of initiation of the contraction, as described by the Frank-Starling law. The general shape of the Frank-Starling relationship is shown in Figure 50-10.60 No specific mathematical relationship exists, although a quadratic polynomial function has been used to approximate the relationship.61 A shift of the Frank-Starling curve up and to the left reflects an improvement in pump function. A shift of the curve down and to the right implies that pump function is worse.
< div class='tao-gold-member'>
Stay updated, free articles. Join our Telegram channel

Full access? Get Clinical Tree


