Chapter 16
Vascular Laboratory
Arterial Duplex Scanning
Patrick A. Stone, Stephen M. Hass
Based on a chapter in the seventh edition by Paul A. Armstrong and Dennis F. Bandyk
Duplex ultrasound (DUS) is an integral component of diagnostic testing for the evaluation and management of arterial disease. This technology, which combines the acquisition of blood flow (pulsed Doppler spectral analysis) and anatomic (B-mode and color Doppler imaging) information, was developed under the guidance of D. Eugene Strandness, Jr., at the University of Washington in the 1970s.1 The initial clinical application of arterial duplex scanning assessed the extracranial carotid artery bifurcation for the presence and extent of atherosclerotic plaque and developed velocity criteria to estimate internal carotid artery (ICA) stenosis on the basis of correlations with angiographic measurements.2 Commercial duplex scanners became available by the 1980s, and the clinical use of DUS rapidly expanded into peripheral arterial, visceral arterial, and peripheral venous applications. The development of real-time, color-encoded Doppler imaging was an important technologic advance that simplified patient testing, enhanced diagnostic accuracy, and led to additional clinical applications in the areas of screening for arterial disease, intraoperative assessment, and surveillance after arterial intervention.
Modern DUS systems provide high-resolution B-mode ultrasound imaging of tissue and vessel anatomy, including three-dimensional vessel reconstruction and evaluation of atherosclerotic plaque morphology. Detailed assessment of blood flow characteristics can be made in real time by one of several techniques—color Doppler imaging, power Doppler imaging, B-flow imaging, or pulsed Doppler spectral analysis.
Test interpretation is based on both imaging and Doppler findings, with classification ranging from normal to clinically relevant disease categories. Duplex testing is noninvasive and cost-effective and thus suitable for serial examination because it not only permits the identification of disease but also reveals its natural history, including progression, regression, and response to intervention. In many patients, duplex testing can establish a definitive diagnosis and can allow interventions, such as carotid endarterectomy or peripheral artery angioplasty, to be based solely on the B-mode imaging and velocity spectral changes recorded from diseased arterial segments. In the upper and lower limbs, duplex testing should be performed in conjunction with indirect physiologic testing (measurement of systolic blood pressure, pulse volume plethysmography) to assess arterial hemodynamics. When peripheral arterial disease is identified, DUS can be used to map the site or sites of occlusive or aneurysmal lesions, analogous to contrast-enhanced arteriography. Arterial duplex test interpretation combined with the patient’s clinical history and physical examination is often sufficient to counsel the patient on the advisability of intervention and whether it can be performed by an endovascular or “open” surgical procedure.
The reliability of arterial duplex testing depends on several factors, including the expertise of the examiner (vascular technologist, physician) and the knowledge and experience of the interpreting physician. Testing performed and interpreted in an accredited vascular laboratory has sufficient diagnostic accuracy for clinicians to rely on the final interpretation provided and often avoid performing more invasive, expensive diagnostic testing, such as computed tomography, magnetic resonance imaging, or catheter-based contrast-enhanced angiography, to confirm disease severity.
Instrumentation and Basic Concepts
DUS systems use transducers fabricated from piezoelectric crystals to convert electrical activity to mechanical energy (ultrasound) and vice versa, thereby allowing the same device to transmit and receive ultrasound signals to and from the patient to produce images of tissue anatomy as well as to characterize blood flow. Transducers consist of multiple elements that enable focusing of the ultrasound beam, steering of the beam, and resolution sufficient for detailed tissue imaging at depths of less than 1 cm to more than 20 cm. To perform detailed arterial mapping, DUS instrumentation for carotid and peripheral testing should be equipped with linear array transducers with frequencies ranging from 5 to 12 MHz. For visceral artery or abdominal imaging and transcranial Doppler (TCD) examination, lower frequency transducers are needed because of the higher tissue attenuation; typically, 2.5- or 3.5-MHz curved linear or phased array transducers are appropriate. Newer generation transducers have an ultrawide bandwidth that makes possible harmonic imaging, with its increased resolution and freedom from artifacts, and dynamic frequency tuning for improving image quality at greater tissue depths. Moreover, the development of two-dimensional transducer arrays enables the beam to be focused at a specific depth and steered, which facilitates the use of three-dimensional imaging.
A duplex B-mode, or brightness mode, ultrasound image is displayed as gray-scale pixels reflecting the amplitude and position of returning ultrasound echoes. By processing up to 200 or more separate ultrasound beam signals retrieved from the transducer array, a scan converter organizes both horizontal and vertical pixels to yield a two-dimensional view of the tissue being scanned. Optimal arterial anatomic imaging is achieved when the transducer scan lines (beam) are directed perpendicular to the vessel wall (Fig. 16-1). A 90-degree imaging angle is best used for measuring vessel diameter, identifying intima-media thickening, and assessing atherosclerotic plaque composition. Transmit power and receiver gain should be adjusted to produce a gray-scale image with the best tissue signal-to-noise ratio so that subtle differences can be perceived by the human eye. The examiner can modify image appearance by adjustment of the instrument’s time gain compensation, which is designed to correct for the effects of increasing attenuation with depth. When duplex arterial imaging is performed, the left side of the image should be oriented toward the patient’s head.
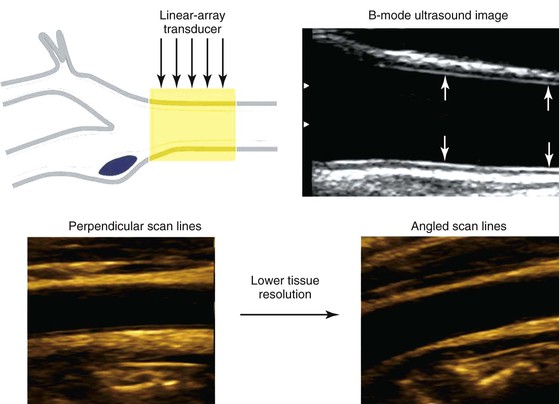
Figure 16-1 Common carotid artery B-mode ultrasound image obtained with transducer scan lines perpendicular to the vessel wall. A normal intima-media stripe is identified (arrows) in the anterior and posterior artery wall. Arterial wall resolution decreases when scan lines are angled relative to the vessel (lower right image).
There are two types of Doppler ultrasound displays. In one form, a color-flow Doppler image shows the flow velocity distribution over a wide area displayed as a color-encoded map superimposed on the gray-scale B-mode tissue image. The second type, often referred to as spectral Doppler, shows the time-varying flow velocity distribution at a selected sample volume. Spectral Doppler provides quantitative information on the peak velocity within the sample volume, whereas color-flow Doppler provides semiquantitative information on the distribution of velocities over an entire region.
To obtain reliable information from spectral Doppler, it is best to use scan line angles (i.e., Doppler angles) of 60 degrees or less relative to the transducer insonation beam and arterial wall (Fig. 16-2). Assignment of the Doppler angle is controlled by the examiner. Because calculation of blood flow velocity is determined by the Doppler equation, which is proportional to the cosine of the Doppler angle, recording velocity spectra at large Doppler angles results in reduced Doppler frequency shift and thereby increases flow velocity error as a result of uncertainty in knowing the true Doppler angle. For example, an error in Doppler angle assignment such as 5 degrees higher than the recommended 60 degrees (i.e., at 65 degrees) will result in a 15% measurement error in flow velocity, whereas an 8% error would result if a 55-degree angle were assigned. The velocity measurement error caused by incorrect or imprecise assignment of the Doppler angle by the examiner is a common duplex testing inaccuracy that can result in overestimation or underestimation of the severity of the stenosis when disease classification is based on peak systolic velocity (PSV) or end-diastolic velocity (EDV) criteria. When pulsed Doppler flow signals are recorded, the instrument sample volume should be sized to encompass less than a third of the flow lumen and should be positioned in the center stream of flow.
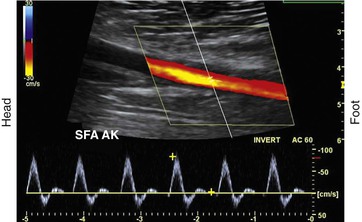
Figure 16-2 Color duplex image with velocity spectra of normal superficial femoral artery (SFA) flow recorded from the above-knee segment (AK) with a 60-degree Doppler beam angle. Note that the pulsed Doppler sample volume is positioned in the center stream of flow, where color-flow pixels indicate the highest flow velocity.
Blood Flow Imaging Techniques
Blood flow detection can be performed with one of three imaging techniques: color Doppler, power Doppler, and B-flow.
Color Doppler Imaging
Color Doppler imaging refers to pixel encoding of blood flow based on a color bar that depicts both flow direction (toward and away from the transducer) and mean velocity (MV) (Fig. 16-3). The examiner adjusts the velocity scale, color priority, and saturation of the color bar as well as instrument color gain to show the appearance of normal, laminar arterial flow as homogeneous regions varying in color-coded pixels during the pulse cycle. To set the color gain correctly, the examiner should increase the gain until a noise speckle appears within the flow region and then reduce it slightly. This technique will optimize the display of weak or lower velocity blood flow signals, such as those adjacent to the artery wall. Excessive color gain causes color-coded flow pixels to bleed into or beyond the artery wall and thus makes the flow lumen appear larger than reality. Interpretation of real-time color Doppler flow is based on the color bar settings (peak MV, baseline, wall filter, and color assignment of flow toward or away from the transducer). In tortuous vessels, blood flow is color-coded according to its direction relative to the transducer scan lines (Fig. 16-4). When blood flow velocity exceeds the mean peak velocity threshold of the color bar, color aliasing occurs because the sampling rate as defined by the pulse repetition frequency is no longer sufficient (the Nyquist limit). With aliasing, blood flow is erroneously encoded as the “wraparound” color shown in the color bar (Fig. 16-5), and the color image display will show flow in the opposite direction. Increasing the pulse repetition frequency and increasing the Doppler angle are two techniques that can be used to reduce the color-flow “aliasing” artifact.
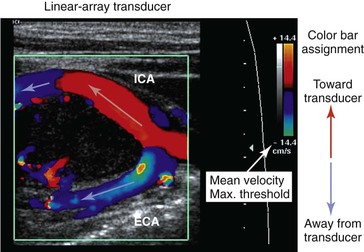
Figure 16-3 Color Doppler imaging of the carotid bifurcation with a tortuous internal carotid artery (ICA) caused by a carotid body tumor. Assignment of the color-encoded flow is based on color bar designation and flow direction relative to the transducer (red toward, blue away) scan lines. Note that in the ICA flow, color changes from red to blue, whereas in the external carotid artery (ECA) flow, color is blue. Aliasing occurs when maximum mean velocity exceeds 14 cm/s.
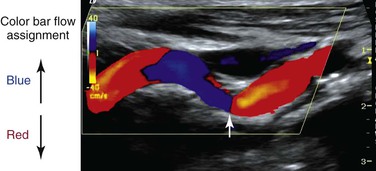
Figure 16-4 Color Doppler image of a tortuous internal carotid artery. The color bar indicates assignment of color-encoded flow based on direction toward or away from the transducer, which accounts for the change in color from red to blue to red in the image. Note that at 90 degrees (arrow), no flow is coded as a black line.
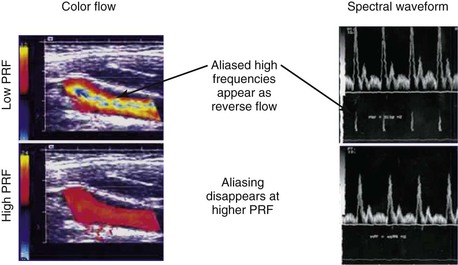
Figure 16-5 Color-flow images and spectral displays of common carotid artery flow at low and high pulse repetition frequency (PRF). Aliasing of color and the velocity spectra occurs with low PRF (upper images). The artifact is removed by increasing PRF (lower images).
Arterial stenosis is recognized by color Doppler imaging as a reduction in the color-encoded flow lumen, imaging of a high-velocity flow region with color bar aliasing, and development of a mosaic flow pattern in the lumen signifying turbulent flow. At the site of a high-grade (>75% diameter reduction) stenosis, real-time color Doppler flow will appear as a whitened, color-desaturated “flow jet” with mosaic color flow extending for several vessel diameters downstream corresponding to post-stenotic turbulence (Fig. 16-6). A tissue bruit may appear as low-velocity flow signals outside the artery lumen and is caused by vibration of the arterial wall. The presence of persistence of color, color bar aliasing, and changes in flow lumen diameter on color Doppler imaging is indicative of abnormal flow patterns produced by stenosis. The examiner should then carefully interrogate this diseased arterial segment with pulsed Doppler spectral analysis to measure changes in flow velocity, which are then used to estimate the severity of the stenosis.
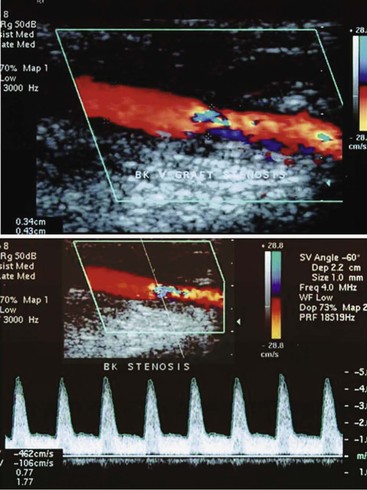
Figure 16-6 Color duplex image and velocity spectra of an arterial vein bypass graft stenosis. Top image, Color aliasing occurs at the stenosis when mean velocity is more than 28 cm/s and extends for several vessel diameters downstream. Bottom image, Velocity spectra recording at the stenosis “flow jet” indicates a peak velocity of 426 cm/s and spectral broadening of highly disturbed turbulent flow.
Power Doppler Imaging
Power Doppler imaging is a technique in which the display of blood flow is based on the amplitude of the backscattered Doppler signal; it increases the sensitivity of flow detection three to five times with respect to color Doppler imaging. This imaging mode is termed “color angio” and is used by the technologist for imaging of small-diameter vessels, detection of slow flow, assessment of residual lumen diameter at a stenosis, and detection of “trickle” flow associated with high-grade stenosis. Flow direction is not evident with the power Doppler imaging option, and the flow signal is less dependent on the Doppler angle.
B-Flow Imaging
B-flow imaging shows blood flow in gray scale; that is, flowing blood and the surrounding structures are depicted in shades of gray. The imaging technique is a visual depiction of flow hemodynamics and should not be confused with color Doppler imaging because no velocity information is provided. B-flow imaging relies on the amplification of weak echoes from moving red blood cells and is most useful during arterial imaging to show boundary layer flow adjacent to the vessel wall and traversing atherosclerotic plaque. B-flow imaging can demonstrate the complex flow patterns seen at bypass graft anastomoses and arteriovenous fistulae and within dialysis access conduits, where color Doppler artifacts can obscure flow patterns.
Pulsed Doppler Spectral Analysis
Pulsed Doppler velocity spectra recorded from a normal artery have a narrow range of velocities throughout the pulse cycle, which indicates that red blood cells are moving at a similar speed and direction in a nondisturbed, or laminar, flow pattern. If the “sample volume” of the pulsed Doppler is too large relative to the diameter of the artery or positioned adjacent to the arterial wall, low-velocity flow signals will be displayed as “broadening” or increased width of the velocity spectra (Fig. 16-7).
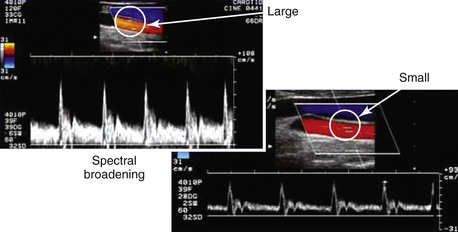
Figure 16-7 Color duplex images of common carotid artery flow. Spectral broadening occurs with a “large” versus a “small” sample volume size as a result of the inclusion of lower blood flow velocities near the arterial wall. This artifact can occur because of incorrect sample volume size or placement and does not indicate flow turbulence.
Spectral broadening in the pulsed Doppler signal can also indicate “disturbed” flow or flow turbulence when it is recorded center-stream at bifurcations, regions of abrupt diameter change, and sites of stenosis. The “normal” appearance of arterial duplex flow varies with the artery being studied (peripheral, carotid, renal, or mesenteric) but should demonstrate rapid flow acceleration in systole, narrow spectral width, and varied diastolic flow corresponding to the vascular resistance of the arterial bed.
The velocity spectrum of a normal peripheral (aorta, iliac, extremity, external carotid) artery is triphasic or multiphasic (see Fig. 16-2) and consists of high outflow resistance with a systolic flow component, early diastolic flow reversal, and late diastolic forward flow. Low-resistance arterial flow, such as in the internal carotid, vertebral, renal, celiac, splenic, and hepatic arteries, is characterized by continuous flow throughout the pulse cycle with only a single (systolic) phasic flow component producing a monophasic pulsed Doppler spectral waveform (Fig. 16-8). Changes in flow resistance of the microcirculation are primarily reflected as an increase or decrease in diastolic flow velocity.
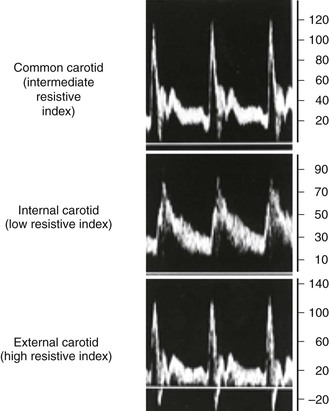
Figure 16-8 Velocity spectra of common carotid, internal carotid, and external carotid artery flow demonstrating differences in flow resistance (i.e., resistive index) between the internal (low resistive index), common (intermediate resistive index), and external (high resistive index) carotid arteries.
Measurements
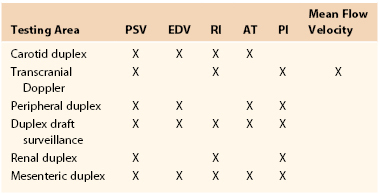
The pulsed Doppler spectral parameters of acceleration time, pulsatility index (PI), resistive index (RI), and maximum spectral velocity measured at peak systole (PSV) and end-diastole (EDV) constitute the primary criteria used for test interpretation (Fig. 16-9 and Table 16-1). The PSV measurement is reproducible and thus the most common velocity spectral parameter used for the interpretation of normal arterial flow and critical limb ischemia and for the grading of arterial stenosis. The EDV measurement is used in conjunction with PSV for evaluating high-grade stenosis (>70% diameter reduction; see Table 16-1).
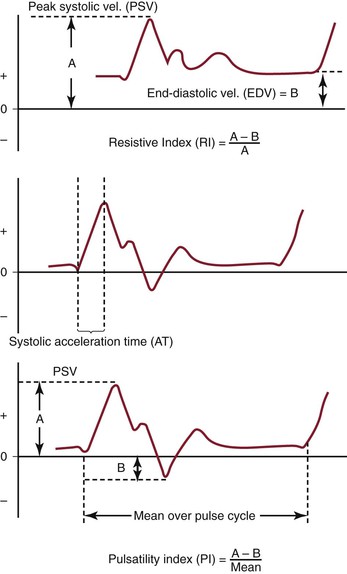
Figure 16-9 Measurement of velocity spectra waveform parameters, including peak systolic velocity (PSV), end-diastolic velocity (EDV), pulsatility index (PI), systolic acceleration time (AT), and resistive index (RI), used for the interpretation of arterial duplex testing.
RI is calculated by subtracting EDV from PSV and then dividing by PSV. It is used clinically to assess the renal and cerebral circulations for abnormal peripheral resistance. Normal values are less than 0.7, and levels higher than 0.85 are associated with increased vascular bed resistance and decreased end-organ perfusion.
PI is calculated by dividing the peak-to-peak velocity spectral shift by the average (mean) velocity. The PI of normal peripheral arteries is greater than 4.0 (femoral artery, >6; popliteal artery, >8). PI values lower than 4 may reflect proximal inflow or occlusive disease, and change in PI or spectral waveform damping is diagnostic of multilevel occlusive disease. Division of distal artery PI by proximal artery PI calculates the “damping factor”; a normal value is 0.9 or higher, and a value of less than 0.9 is diagnostic of occlusive disease.
The systolic acceleration time during systole can also be used to diagnose occlusive disease proximal to the pulsed Doppler recording site. A normal value is less than 133 milliseconds. As systolic acceleration time increases to longer than 200 milliseconds, the spectral waveform develops a rounded upslope configuration, termed tardus-parvus, because of the prolonged time to PSV. Diagnostic accuracy of the systolic acceleration time is influenced by cardiac conditions (cardiomyopathy, aortic valve disease), but downstream occlusive disease has minimal influence on diagnostic sensitivity.
Ultrasound Equation
This is described in Chapter 15. Volume flow (Q; mL/min) can also be measured by electronically extracting the spatial average velocity (Vsa; cm/s) as a function of time, measuring vessel diameter (d; cm), and expanding the sample volume size to encompass the entire flow lumen by the equation
Measurement of arterial volume flow has limited diagnostic accuracy in the classification of occlusive disease because of normal variation in peripheral resistance and the development of collateral flow, but it is clinically useful in the assessment of dialysis access function.
Artifacts and Errors
Artifacts and errors in ultrasound measurement can limit the effectiveness of the evaluation and create inaccurate results. Various artifacts include mirror image artifacts, shadowing from overlying vessel calcification, inaccuracy due to refraction, and aliasing. Most errors can be attributed to the technologist because studies using flow models have found that adjustment of Doppler angle, sample volume placement, and Doppler gain were the most significant sources of error in PSV measurement.
Spectral Doppler aliasing is the most common artifact and, similar to color Doppler aliasing, is recognized by a “characteristic” signal wraparound in the spectral display (see Fig. 16-5). Adjustment of the velocity scale (i.e., pulse repetition frequency) to above the Nyquist limit or a reduction in the baseline level can shift the spectrum downward and eliminate the artifact. Shadowing from overlying calcification impedes adequate visualization of underlying vessel anatomy with B-mode imaging and interferes with accurate velocity measurement. Mirror image artifacts, created when a tissue structure is reproduced at an incorrect location, occur when a strongly reflecting surface is further reflected by other strongly reflecting surfaces.3 Refraction can cause misregistration of the image and the Doppler sample volume and occurs when an ultrasound beam passes through mediums with different propagation speeds. Crosstalk, found only in Doppler evaluation, creates a mirror image where identical spectra appear above and below the baseline. It is usually caused by an excessive receiver gain setting or an incident angle near 90 degrees. Ghosting occurs when low-velocity motion from pulsating vessel walls produces small Doppler shifts that can cause color flashing into the surrounding anatomy; it can be fixed with wall filters.
Variability of diagnostic criteria between laboratories stems from methods for defining the percentage of stenosis, different machines, and differences in technique.3 Factors such as gender and physiologic condition of the patient can also affect the outcomes of DUS evaluations. Studies have found that carotid PSV measurements in women average 10% higher than in men.4 Congestive heart failure, dysrhythmias, and artificial support measures (ventilators, intra-aortic balloon pumps, or pacemakers) can alter cardiac output, which in turn can affect PSV measurements. With regard to technologist error, the largest source is error in accurately aligning the cursor of the sample volume. Even small errors in angle measurement can result in significant errors in velocity measurement and severity of the stenosis.3 Sample volume assumes that flow is parallel to the walls; however, flow is not usually parallel in tortuous vessels or beyond an asymmetrical stenosis, and these situations can make correct sample volume positioning and true velocity readings difficult. Finally, the most accurate measurement of PSV at a stenosis is within the narrowest portion of the stenosis, and reproducible measurements can be best obtained only if the sample volume is placed at or very near this area.
Duplex Velocity Spectral Classification of Arterial Stenosis
A significant or “critical” arterial stenosis is a lesion that is associated with a resting systolic pressure gradient of more than 15 mm Hg and reduces volume flow. In the peripheral arterial circulation, this correlates with a 50% or larger diameter reduction stenosis or greater than 75% reduction in cross-sectional area. Stenosis produces losses in blood energy primarily as a result of losses in inertial energy caused by the development of turbulent flow; such losses are much greater than the friction energy losses predicted by Poiseuille’s law.
By measuring changes in velocity proximal to and across an arterial stenosis, duplex testing can noninvasively estimate its hemodynamic significance and predict reductions in diameter within specified ranges (e.g., 0% to 49% diameter reduction, ≥50%, 50% to 79%, ≥80%). The relationship between the increase in flow velocity and the reduction in diameter by stenosis is nonlinear, especially with stenoses greater than 50% diameter reduction (Fig. 16-10). The DUS characteristics of greater than 50% diameter reduction arterial stenosis include PSV elevated to higher than 125 cm/s, a color Doppler mosaic flow pattern, and pulsed Doppler spectral broadening of highly disturbed flow (i.e., post-stenotic turbulence with simultaneous forward and retrograde velocity spectra during systole).
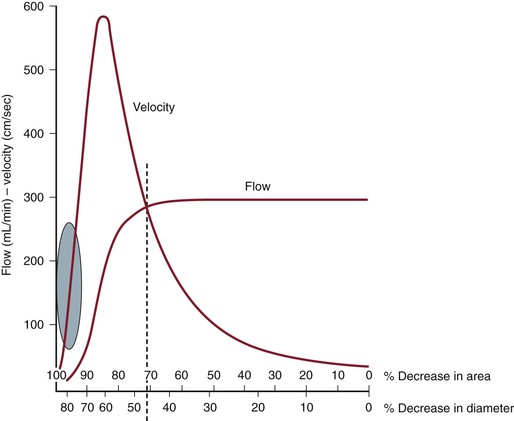
Figure 16-10 Correlation of percentage diameter reduction with increases in blood flow velocity and reduction in volume flow in arteries. Note that a high-grade (>95%) diameter-reducing stenosis causes volume flow to decrease toward zero, whereas the velocity within the stenosis may be minimally elevated.
The ratio of PSV (Vr) across a stenosis is a useful parameter for grading the severity of a stenosis; a Vr value higher than 2 indicates a greater than 50% diameter reduction, and a value higher than 4 correlates with greater than 70% diameter reduction. Typically, a pressure-reducing (peak systolic pressure >20 to 30 mm Hg) and flow-reducing arterial stenosis is associated with a Vr above 3.5, a PSV higher than 250 to 300 cm/s, and an elevation in EDV of 40 cm/s or more. Downstream of a “significant” pressure-reducing arterial stenosis, the spectral waveform should appear damped and monophasic with prolongation of the acceleration time and a decrease in PSV to below normal levels. As stenosis severity increases beyond greater than 90% diameter reduction, volume flow through the stenosis tends toward zero, which can produce PSV at the stenosis in a minimally elevated range (100 to 200 cm/s) and low-velocity (<10 cm/s) trickle flow downstream. The atherosclerotic plaque associated with greater than 50% stenosis is typically irregular and may be calcified, which produces an acoustic shadow on the image and makes measurements of residual artery diameter or reduction in cross-sectional area too inaccurate on transverse imaging to classify the severity of an arterial stenosis. Correlation studies between duplex testing and angiographic measurements have found that PSV and Vr are the best predictors of the severity of stenosis when it is expressed as percentage diameter reduction.
Validation studies comparing duplex interpretation of stenosis severity with angiographic measurements have reported different threshold PSVs for lesions with greater than 50% diameter reduction.5–10 PSV measurement variation is in the ±15% range, similar to other biologic measurements. This variation is related to the type of ultrasound system used and differences in Doppler angle assessment and sample volume positioning by the examiner. This limitation of duplex scanning can be minimized by reporting stenosis (i.e., diameter reduction) within a specified range (e.g., 0% to 49%, 50% to 75%, and 76% to 99%). In each clinical application, it is recommended that the vascular laboratory conduct ongoing quality assurance studies to confirm that the diagnostic accuracy of stenosis interpretation is greater than 80% relative to independent angiographic reports. It is not necessary to evaluate the diagnostic accuracy of individual DUS systems.
Patient Testing
Arterial duplex scanning can be performed as a portable bedside or vascular laboratory examination. Scanning should be conducted on a height-adjustable table or stretcher with the patient in a supine position. The bed and room environment should provide a comfortable, quiet atmosphere for patient examination, a warm room temperature (75° F to 77° F) to avoid vasoconstriction of the extremities, and sufficient space to permit bilateral body access for ultrasound scanning. The typical examination time ranges from 30 to 60 minutes. Patients should refrain from tobacco use for at least 1 hour before the examination, and if abdominal scanning or visceral artery testing is planned, the patient should have fasted for 4 hours and the examination should be performed in the morning to minimize accumulation of intestinal gas. Assessment of visceral artery flow before and after a test meal may be required for the evaluation of patients with symptoms of mesenteric ischemia.
Equipment Safety
DUS scanning is considered to be a safe and noninvasive diagnostic modality, but the potential for adverse bioeffects exists. The acoustic power output of the duplex scanner has the potential to produce tissue injury from both thermal (heating) and mechanical (cavitation) effects. Duplex testing should be conducted with the acoustic output or power setting as low as reasonably achievable (ALARA principle). Tissue temperature increases with exposure to diagnostic ultrasound and bioeffects are related to exposure time, pulse repetition frequency, power output, and sample volume size. The instrument displays a thermal index as a reference to the sonographer to monitor for potential adverse bioeffects. In theory, if the thermal index is 3 or less, the maximum increase in temperature with diagnostic ultrasound should be 3° C. Consensus guidelines on ultrasound exposure indicate that no significant bioeffects occur with increases in temperature of less than 2° C for less than 50 hours’ exposure, and thermal index–related bioeffects are a rare occurrence in clinical practice. Mechanical effects causing acoustic cavitation can be calculated by the mechanical index, which is normally displayed together with the soft tissue index by the instrument. Values for the mechanical index in diagnostic imaging typically range from a maximum of 1.9 to 0.5. Echo cavitations cause soft tissue bubbles or air pockets to expand and contract rhythmically, thereby resulting in resonation, which can theoretically lead to tissue damage. The use of microbubble contrast agents to enhance Doppler signal strength increases tissue bioeffects.
Clinical Applications and Test Interpretation
Carotid Artery
Carotid DUS testing provides a noninvasive method of evaluation of the extracranial carotid and vertebral arteries in patients with suspected cerebrovascular disease.2,5–13 Because the carotid artery is superficially located and can reliably be assessed by duplex scanning, this has become the mainstay of imaging for many vascular surgeons before carotid surgery. Similarly, the vertebral and subclavian arteries are readily accessible to ultrasound imaging, so a wide spectrum of extracranial arterial disorders can be accurately diagnosed, such as the detection of aneurysmal changes and even indications of intracranial and intrathoracic disease (based on waveform analysis). The most common clinical application is for the detection of proximal ICA atherosclerotic plaque and estimation of stenosis severity. The extent of ICA bifurcation diameter reduction predicts the risk for stroke and thus assists clinicians in identifying patients who may benefit from carotid intervention on the basis of landmark clinical trials.5,6,11 Because of a wide variation in reporting by vascular laboratories across the country, consensus criteria were developed to standardize reporting.13 Carotid DUS is also widely used to assess the results of carotid interventions by continued surveillance for recurrent stenosis. TCD serves as a tool for evaluation of the intracranial circulation and collateral circulation during carotid interventions and assessment of spasm after intracranial hemorrhage.
The association of coronary artery disease with increased intima-media thickness of the carotid artery has led some to suggest imaging of the carotid artery in asymptomatic patients as a screen for coronary or generalized atherosclerosis. However, a meta-analysis of 41 randomized controlled trials was unable to show a correlation in reduction of carotid intima-media thickness to a decrease in cardiovascular events. Although such screening is more often performed in Europe, restrictive insurance coverage has limited the utility of this assessment in the United States to clinical trials.14 Further, the use of duplex imaging for carotid disease surveillance was recently reviewed and found not to be cost-effective because only 7% of asymptomatic patients subsequently required carotid surgery.15
In the past decade, a better understanding of plaque morphology has provided further information on plaque echocardiographic morphology. Plaque morphology has been correlated with presenting symptoms16 (i.e., hemispheric, amaurosis fugax, asymptomatic). Furthermore, plaque morphology has been shown to change after neurologic events, with the single longitudinal view–gray scale median (GSM) lowest within 30 days of a neurologic event and increasing to values similar to those of asymptomatic patients within 3 to 6 months.17 The ICAROS (Imaging in Carotid Angioplasty and Risk of Stroke) study demonstrated by multivariable analysis that the GSM was an independent predictor of stroke after carotid stenting, with 7.1% of patients with GSM of less than 25 and 1.5% of patients with GSM of more than 25 suffering a neurologic event in the perioperative period.18
Indications.
Results from two separate guidelines endorsed by the Society for Vascular Surgery support the use of DUS as the initial imaging modality for both asymptomatic and symptomatic patients.1,19 Initial carotid evaluation with DUS is acceptable for patients with a carotid bruit and to observe known asymptomatic stenosis. DUS is also frequently used for screening carotid evaluation in patients with known peripheral arterial disease, coronary artery disease, or abdominal aortic aneurysms. For symptomatic patients, initial carotid evaluation with DUS is appropriate for patients presenting with amaurosis fugax or hemispheric symptoms attributable to carotid territories. Secondary imaging, such as computed tomographic arteriography (CTA) or magnetic resonance arteriography (MRA), is necessary when sonography cannot be obtained, DUS results are equivocal in symptomatic patients, or confirmation of DUS findings is necessary for quality assurance.
Technique.
A linear array transducer (5 to 10 MHz) is sufficient to image the arterial anatomy. Carotid artery imaging in gray scale is performed in transverse and sagittal planes to assess the intima-media thickness (normal, <0.8 mm), to assess for presence of atherosclerotic plaque (intima-media thickness >1.5 mm), and to investigate the site or sites of more advanced plaque stenosis. The examination should include complete DUS imaging of the extracranial common carotid artery (CCA), ICA, and external carotid artery (ECA) as well as assessment of flow in the vertebral and subclavian arteries including bilateral brachial artery systolic pressure measurement. Accurate differentiation of the ICA from the ECA is paramount. The two can be differentiated on the basis of location (the ICA is posterior and lateral to the ECA), Doppler flow resistance (the ICA has low-resistance monophasic spectra, whereas the ECA has higher resistance multiphasic spectra), and the presence of branches (the ECA has branches) (see Fig. 16-8).
Atherosclerotic plaque features, such as homogeneity or heterogeneity, are evaluated in gray scale by B-mode ultrasound imaging. GSM assessment of each plaque can provide additional information. Multiple images can be obtained in transverse views and a single longitudinal view. Two points of reference are used, with 0 designated for black and 255 for white. Excessive calcification can limit GSM assessment by blocking the ultrasound. Multiple points of assessment allow a maximum and minimum GSM, with the difference in measurements determining the heterogeneity of the plaque.
Notation of the carotid bifurcation relative to the angle of the mandible provides clinically important information in determining difficulty of surgical exposure for lesions at or above the angle of the mandible. Color Doppler imaging is useful to interrogate tortuous CCA or ICA segments and to assist in correct assignment of the Doppler angle for measurements of velocity spectra. The CCA is examined as far proximally as possible to detect flow turbulence caused by CCA origin stenosis. Velocity spectra are recorded (≤60-degree Doppler angle) at multiple sites in the CCA, ICA (proximal, mid, distal), and ECA. Color or power Doppler imaging is used to identify regions of maximal stenosis for pulsed Doppler interrogation.
Interpretation
Carotid Plaque Echomorphology.
The location and extent of atherosclerotic plaque, including features such as calcification, lumen irregularity, ulceration (>2-mm surface defect), and pattern of echogenicity (homogeneous versus heterogeneous), are determined by B-mode imaging. The extent of acoustic shadowing secondary to the extent of plaque calcification should be described. Lumen-reducing plaque with large echolucent regions may indicate plaque instability caused by intraplaque hemorrhage or degeneration. The more echogenic the plaque, the higher the GSM score. The GSM can determine B-mode plaque morphology more accurately than a single longitudinal assessment and provide scoring that can be standardized. Gross assessment of the carotid plaque should be categorized as less than 50% or more than 50% on the basis of plaque severity on transverse imaging.
Severity of ICA Stenosis and Velocity Criteria (PSV/EDV Ratio).
A multispecialty panel developed a consensus for estimating the severity of ICA stenosis. Parameters used to determine the degree of stenosis include PSV and EDV measurements, with these values recorded from within the most stenotic ICA segment (Table 16-2).13 Testing data allow designation of ICA disease into categories of normal (no plaque or stenosis), less than 50% stenosis (plaque visualized, mild disease), 50% to 69% stenosis, greater than 70% diameter reduction (high-grade stenosis), and occlusion (no flow detected). The ICA/CCA ratio also assists in determining the severity of a stenosis.
Table 16-2
Consensus Criteria for Interpretation of Carotid Duplex Imaging of Internal Carotid Artery Atherosclerotic Disease11
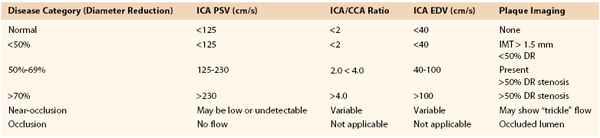
CCA, Common carotid artery; DR, diameter reduction; EDV, end-diastolic velocity; ICA, internal carotid artery; IMT, intima-media thickness; PSV, peak systolic velocity.
A PSV of 125 cm/s, recorded from a proximal diseased ICA segment, is the threshold for greater than or less than 50% stenosis. Extensive, bulky plaque may be imaged at the carotid bifurcation, but if PSV is in the range of 125 to 150 cm/s and the ICA/CCA ratio is less than 2, the appropriate estimation of ICA stenosis should be based primarily on the PSV value (i.e., hemodynamic classification of disease) (Fig. 16-11). Grading of ICA stenosis of more than 50% is determined by the PSV and EDV values. PSV values ranging from 230 to 280 cm/s are predictive of a greater than 70% stenosis by NASCET (North American Symptomatic Carotid Endarterectomy Trial) measurement criteria.6–8 However, interpretation of greater than 70% stenosis should not be based on the PSV value alone. As stenosis increases beyond 70%, EDV and the ICA/CCA ratio become additional criteria for defining the degree of stenosis, with an EDV higher than 100 cm/s and ICA/CCA ratio above 4 defining a diameter reduction of greater than 70%. An EDV higher than 140 cm/s and an ICA/CCA above 8 are highly predictive (positive predictive value of 90%) of greater than 80% diameter reduction stenosis (Fig. 16-12).20,21
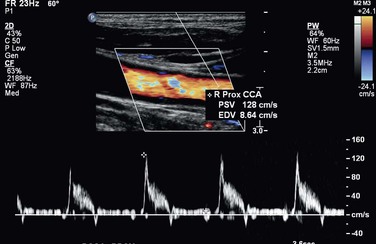
Figure 16-11 High-resistance common carotid waveform proximal to a right internal carotid artery occlusion.
Accuracy.
In a validation study of the consensus criteria by AbuRahma et al,22 a PSV of 125 to 230 cm/s for detection of angiographic stenosis of 50% to 69% had a sensitivity of 93%, specificity of 68%, and overall accuracy of 85%. The consensus criteria for diagnosis of 50% to 69% stenosis can be significantly improved by use of an ICA PSV of 140 to 230 cm/s, with a sensitivity of 94%, specificity of 92%, and overall accuracy of 92%. A PSV of 230 cm/s or more for a stenosis of 70% or greater had a sensitivity of 99%, specificity of 86%, and overall accuracy of 95%. PSV was more accurate than EDV or ratio.22 These results are comparable to those of a meta-analysis of the literature, in which a PSV of 130 cm/s had a sensitivity and a specificity of 98% and 88% in detecting 50% stenosis. A PSV of 200 cm/s or more for detection of a greater than 70% stenosis was 90% sensitive and 94% specific.20
When ultrasound is compared with computed tomography by the NASCET method of measurement for carotid stenosis, B-mode imaging with high resolution can provide impressive similarities to measurements with computed tomography imaging at some centers. A PSV of 370 cm/s to determine a greater than 70% stenosis was found to have a sensitivity, specificity, positive predictive value (PPV), negative predictive value (NPV), and accuracy of 87%, 90%, 82%, 93%, and 93% compared with CTA.23 An EDV of 140 cm/s had an overall accuracy of 90% in detecting a greater than 80% stenosis, and the same accuracy was detected with an ICA/CCA ratio of 6.
Limitations.
Significant tortuosity can result in higher incidence of sampling errors, and recent surgery can limit imaging. A contralateral severe stenosis or occlusion can falsely elevate ipsilateral velocities. Proximal or distal (tandem) lesions can prohibit accurate assessment of extracranial artery stenosis. Overestimation of the degree of stenosis with DUS may be explained by erroneously used angle corrections (i.e., angles >60 degrees). Nearly total occlusions substantially decrease velocities by diminished flow. Severe calcification may prevent accurate interrogation of the entire lesion, potentially missing the greatest point of stenosis.
Severe Stenosis of the Contralateral Carotid Artery
In approximately 25% of patients, the presence of an occluded ICA is associated with increased compensatory collateral flow in the nonobstructed ICA with a resulting increase in PSV and EDV. This can result in overestimation of stenosis when plaque is present.24,25 When bilateral high-grade ICA stenosis or contralateral ICA occlusion is present, multiple diagnostic criteria (PSV, EDV, ICA/CCA ratio) are recommended to interpret greater than 50% or less than 70% diameter reduction ICA stenosis. Abou-Zamzam and colleagues documented that 20% of patients with bilateral severe stenosis greater than 60% were reclassified to less than 60% stenosis in the contralateral, untreated artery after treatment of the ipsilateral carotid disease.24 Likewise, increased PSVs in the ICA have been documented in patients with bilateral vertebral artery occlusive disease or subclavian artery steal syndrome with retrograde vertebral flow.25 The potential change of PSV criteria to higher requirements has been suggested by Fujitani et al.26 Sensitivity and specificity can be enhanced by use of a PSV higher than 140 cm/s and an EDV lower than 155 cm/s for defining a 50% to 79% stenosis and a PSV higher than 140 cm/s and an EDV higher than 155 cm/s for a stenosis of 80% or greater compared with classical Strandness criteria. With use of the Strandness criteria, the accuracy was approximately 70% in detecting a 16% to 79% stenosis. When these criteria were adjusted, the accuracy improved to more than 94% in all degrees of stenosis.
Internal Carotid Artery Occlusion
The diagnosis of ICA occlusion requires several duplex findings to be present.27–29 Imaging should include B-mode plus color and pulsed Doppler as well as power Doppler to confirm absence of flow. Imaging should be adjusted for maximum flow sensitivity and minimum wall filter. The Doppler sample volume should be changed to sample the entire vessel.
Interpretation.
No flow should be detected by color or power Doppler at the diseased carotid bulb and beyond in the distal ICA. Resistance to flow in the ipsilateral CCA should be increased, with flow at or approaching zero in early diastole. Low-resistance flow may be seen in the ECA because of the development of collateral flow. A characteristic flow “thump” may be recorded in the proximal ICA as flow abuts the occlusion.
Intraoperative Carotid Duplex Testing
DUS is a useful modality to assess carotid repairs for technical problems, including arterial clamp injury, shunt trauma, suture line stenosis, and dissection of residual plaque in either the ICA or the CCA. The unpredictable occurrence of these residual lesions (documented in approximately 3% to 5% of procedures) can lead to repair site thrombosis or embolization of platelet thrombus and cause a stroke or transient ischemic attack after carotid surgery.30–32 Recurrent carotid stenosis has been postulated to have its origin in the “abnormal” repair site, with myointimal hyperplasia being more likely to develop in response to residual disturbed flow. Completion angiography, although an excellent method to verify a “technically adequate” repair (no lumen-filling defects, <20% residual stenosis), is currently used selectively because of the availability of DUS in the operating room and the skills and confidence of the vascular surgeon in performing postprocedural duplex testing and interpreting results.
Technique.
A 10- to 15-MHz specialized transducer provides high-resolution tissue imaging because the examination depth is less than 5 cm. The duplex probe is placed in a sterile plastic cover, and with saline used for acoustic coupling, the surgeon slowly scans the carotid repair in multiple sagittal and transverse planes and notes wall, lumen, and color Doppler flow features. The entire endarterectomy region is imaged, with special attention paid to repair site endpoints, transected plaque ends, and sites of vessel clamping. The ICA should be imaged as far distally as possible.
Interpretation.
The finding of wall irregularity or a small (<2 mm) flap in association with undisturbed flow (PSV < 125 cm/s) indicates a minor residual abnormality that is not found to be associated with postoperative stroke or thrombosis. When scanning identifies larger (≥3 mm) flaps, stenosis with a PSV higher than 150 cm/s and turbulent flow spectra, or lumen thrombus, immediate repair of the abnormality is recommended on the basis of clinical outcome data documenting a low (<1%) perioperative incidence of stroke and thrombosis and late (<3%) recurrent stenosis. If repair site imaging is normal and only elevated PSV is found, confirmation of an anatomic abnormality with arteriography is recommended before proceeding with operative revision. In most instances, lesions undergoing revision had both a B-mode and color Doppler abnormality and velocities higher than 200 cm/s.
Limitations.
Routine intraoperative imaging is not universally performed; in addition, no randomized studies evaluating observation of small technical defects and their natural history have been performed. Clamp time as well as status of stenosis of the contralateral carotid artery may influence velocities.
Surveillance after Carotid Intervention
DUS testing is the recommended technique for surveillance after carotid endarterectomy or stenting. Multiple reports have documented a low (<1%/y) stroke rate in patients undergoing routine surveillance to identify high-grade (>70%) recurrent carotid stenosis. The majority of lesions develop without symptoms. Surveillance testing should occur within 30 days to record a new baseline after surgery or stenting. If normal, follow-up examination should occur at 6 to 12 months; if a greater than 50% stenosis is discovered, a repeated evaluation in 6 months is warranted. Continued surveillance at annual intervals has been recommended.19,32
Carotid Endarterectomy with Patch Closure
After carotid endarterectomy with patch angioplasty, velocity criteria used for native carotid artery stenosis appear to overestimate the severity of stenosis. AbuRahma et al33 evaluated patients who had patch closure (8-mm-diameter) of carotid arteries from a prospective randomized trial who also underwent CTA and recommended different velocity criteria. An ICA PSV higher than 155 cm/s was optimal for greater than 30% restenosis with sensitivity, specificity, PPV, NPV, and overall accuracy of 98%, 98%, 98%, 98%, and 98%, respectively. A PSV higher than 213 cm/s was optimal for greater than 50% restenosis with sensitivity, specificity, PPV, NPV, and overall accuracy of 99%, 100%, 100%, 98%, and 99%, respectively. An ICA PSV higher than 274 cm/s was optimal for greater than 70% restenosis with sensitivity, specificity, PPV, NPV, and overall accuracy of 99%, 91%, 99%, 91%, and 98%, respectively. Receiver operating characteristic analysis showed that the PSVs were significantly better than EDVs and ICA/CCA ratios in detecting greater than 30% and greater than 50% restenosis.33
Carotid Stenting
With the emergence of carotid artery stenting as a treatment option for the management of symptomatic and asymptomatic ICA stenosis, duplex testing after intervention is the recommended diagnostic modality to assess stent patency and to screen for in-stent stenosis. Interpretation criteria for 50% diameter reduction stenosis of the stented ICA may differ because of stent-induced reduced wall compliance, which can cause an increase in PSV. The use of both PSV and PSV ratios is recommended when color or power Doppler imaging detects in-stent stenosis. AbuRahma et al34 have reported recommendations for and revisions to standard carotid criteria to account for the changes occurring with carotid stenting, and these revised velocity criteria are as follows.
An ICA PSV of 154 cm/s or more denoted a 30% or greater stenosis, with a sensitivity of 99%, specificity of 89%, and overall accuracy of 96%. An ICA PSV of 224 cm/s or more was optimal for a 50% or greater stenosis with a sensitivity of 99%, specificity of 90%, and overall accuracy of 98%. An ICA PSV of 325 cm/s or more was optimal for an 80% or greater stenosis with a sensitivity of 100%, specificity of 99%, and overall accuracy of 99%. An ICA EDV of 119 cm/s or more had a sensitivity, specificity, and overall accuracy in detecting an 80% or greater stenosis of 99%, 100%, and 99%, respectively. The PSV of the stented artery was a better predictor than the EDV or ICA/CCA ratio for in-stent restenosis.
Surveillance after carotid stenting has documented a 5% incidence of high-grade in-stent stenosis within 2 to 3 years. Most develop without symptoms, and most are treated by balloon angioplasty or restenting.35
Innominate, Common Carotid, and External Carotid Arteries
Ostial carotid or innominate stenosis is uncommon; typically less than 5% of patients undergoing arch angiography are diagnosed with great vessel stenosis. Duplex criteria are based on indirect findings secondary to the intrathoracic location.
Technique.
Imaging techniques are similar to those used for carotid artery imaging.
Stay updated, free articles. Join our Telegram channel

Full access? Get Clinical Tree


