Chapter 15
Vascular Laboratory
Arterial Physiologic Assessment
Ted R. Kohler, David S. Sumner
In memory of David S. Sumner, MD (1933-2013), who previously authored this chapter. Along with Eugene Strandness, he pioneered the use of ultrasound for diagnosis of peripheral vascular disease.
In most cases, the diagnosis of symptomatic peripheral arterial disease (PAD) can be made on the basis of a careful history and physical examination alone. Physiologic testing adds a degree of objectivity. It can confirm or bring into question the clinical impression, detect disease in asymptomatic patients, and estimate severity and location for planning interventions.1 Noninvasive testing is also the preferred method for monitoring the progression of disease and revascularization procedures for restenosis. Detecting graft stenoses before they become clinically evident allows prophylactic intervention.
Physiologic testing is helpful when the diagnosis is uncertain, such as in patients with pseudoclaudication. These tests are also useful in determining the extent to which arterial disease limits walking in patients who have concomitant orthopedic or neurologic problems contributing to their disability. Noninvasive testing can be used to detect PAD in otherwise asymptomatic patients, which is significant, because PAD is an independent risk factor for cardiac events.2,3 These tests are uniquely able to identify intermittent arterial obstructions, such as those arising from entrapment syndromes, and to distinguish between fixed arterial obstructions and obstructions caused by vasospasm. In patients with advanced disease, physiologic testing helps determine the ability of ischemic ulcers to heal and provides guidance for the optimum level of amputation.
Physiologic tests may be either direct or indirect. Direct methods, such as duplex scanning, obtain information from the specific arterial sites being evaluated. Indirect tests, such as segmental pressure measurement, analysis of downstream velocity waveforms, and plethysmography, use inference from information obtained from accessible arteries to estimate degrees of stenosis elsewhere. These tests have been used less frequently since the advent of duplex scanning and minimally invasive imaging, such as magnetic resonance and computed tomographic angiography (see Chapters 16, 22, and 23). Comprehensive evaluation of PAD requires the integration of physiologic, anatomic, and clinical information. This chapter reviews the theory, methods, interpretation, and applications of the various physiologic arterial tests available in the vascular laboratory.
Doppler Ultrasonography
The development of Doppler ultrasound to detect blood flow and analyze velocity waveforms revolutionized the ability to detect and quantitate peripheral vascular disease noninvasively. Velocities are detected as frequency shifts in reflected ultrasound from the flowing red blood cells. Arterial narrowing causes an increase in velocity at the site of the stenosis and dampening of the velocity waveform beyond. Pulsed Doppler combined with B-mode imaging in duplex ultrasound machines allows analysis of velocity waveforms from specific sites along visualized vessels. This modality is described in Chapter 16. Here, we discuss simple, continuous-wave Doppler and waveform analysis.
Principles of Doppler Ultrasound
Doppler ultrasound detects blood flow velocity.4 The handheld continuous-wave devices used for bedside examinations typically have a transmitting frequency between 5 and 10 MHz. Sound at this frequency can penetrate only a few centimeters beneath the skin. It is more discriminating than the lower frequencies that are required to interrogate deep structures and produces higher frequency shifts. For these reasons, these devices are preferred for study of the smaller arteries of the limbs and digits. A fluid interface, most commonly an aqueous gel, is used to reduce the loss of ultrasound energy from impedance mismatching between the probe and the otherwise dry skin (ultrasound energy does not penetrate air well). The probes have a receiving and transmitting piezoelectric crystal at the tip. Ultrasound is transmitted into tissue and is backscattered by reflectors (regions where the ultrasound impedance changes).
Red blood cells backscatter ultrasound waves. When they reflect the sound beam, the effect is the same as though they were transmitting the sound back to the receiving crystal of the probe. The frequency of the received reflected sound is compared with the transmitting frequency to detect shifts caused by motion of the reflectors relative to the Doppler probe. This shift is due to the Doppler effect, which causes shortening of the wavelength if the receiver and transmitter are moving toward one another and lengthening if they are receding (Fig. 15-1).
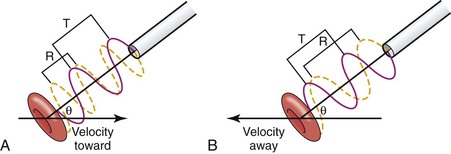
Figure 15-1 The Doppler device compares the frequency of backscattered sound from moving red blood cells with the transmitting frequency to determine the frequency shift, which is proportional to the speed of the flowing blood, the transmitting frequency, and the cosine of the Doppler angle, θ. The drawing shows a Doppler probe transmitting ultrasound at a wavelength T to a red blood cell moving in a direction indicated by an arrow. The red cell is moving toward the probe in (A) and away from the probe in (B). The angle between the ultrasound beam and the direction of red cell velocity is given by θ. The frequency of the ultrasound that is transmitted is the same in both cases (red line). The ultrasound signal that is received (yellow line) has a shorter wavelength (R) in (A) and a longer wavelength in (B).
The magnitude of the frequency shift (Δf) is given by the following Doppler equation:
 [15.1]
where V is blood velocity in centimeters per second, f0 is the transmitted frequency, θ is the angle between the velocity vector and the path of the ultrasound beam (known as the Doppler angle), and C is the velocity of sound through blood (1.54 × 105 cm/s). This equation can be rearranged to solve for V when the Doppler angle can be measured, as it is in duplex scanning (see Chapter 16).
Given the transmitting frequencies used and the velocity of blood flow (between 0 and 500 cm/s), the Doppler frequency shifts are in the audible range. Because the equation requires the cosine of the Doppler angle, the least amount of error occurs when the flow is directly aligned with the probe (the cosign of 0 degrees is 1). This can be the case when ultrasound is used to measure blood velocity at the aortic root with a probe at the sternal notch aimed directly down at the origin of the aorta. The cosine begins to change rapidly above angles of 70 degrees. Therefore, estimates of velocity with such steep angles are prone to considerable error. Continuous-wave ultrasound devices detect the frequency shift, amplify it, and send it to speakers for audible interpretation. The velocity of blood flow is proportional to the frequency shift, which is heard as a change in pitch of the audio signal. Loudness (amplitude) is proportional to the volume of red blood cells moving through the Doppler signal path. An experienced listener can identify increased pitch, which corresponds to increased velocity of flow, and therefore, luminal narrowing. This allows surgeons to detect areas of stenosis intraoperatively on completion of vascular reconstructions. The listener can also perform elementary waveform analysis by taking note of the contour of the velocity waveform (see the following).
Aural Interpretation of the Doppler Waveform
Normal peripheral arteries at rest have a triphasic or biphasic quality with a brisk upstroke of forward flow in systole followed by a brief reverse flow component in diastole caused by reflection of the flow wave from the periphery, and finally, in most but not all peripheral arteries, a small forward component in late diastole (Fig. 15-2).
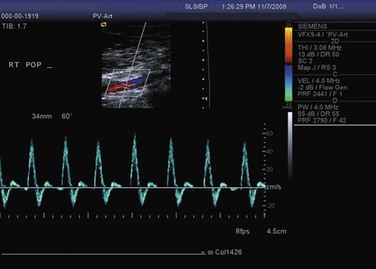
Figure 15-2 Normal triphasic velocity waveform from a peripheral artery obtained with a duplex scanner.
The presence of a normal, crisp triphasic signal nearly always rules out clinically significant PAD at or proximal to the insonated level. Arterial obstruction causes dampening of the waveform, which becomes monophasic. Turbulence causes nonuniform velocities and imparts a harsh quality to the audible Doppler signal. The low-amplitude, monophasic Doppler signals that result from extensive occlusive disease may be difficult to distinguish from venous signals. Gentle compression of the foot forces blood out of the venous system and causes a rush of venous blood that is easy to appreciate in the Doppler signal. Directional Doppler can also be useful to distinguish arterial from venous signals because it can indicate whether blood is flowing toward or away from the ultrasound probe.
Qualitative Analysis
An experienced observer can easily appreciate the difference between the normal brisk, phasic waveform and the monophasic signal downstream from a significant stenosis. The earliest change at the site of stenosis is widening of the waveform (spectral broadening) in early diastole, when flow is decelerating and least stable. The waveform becomes blunted (monophasic). More severe stenosis produces a marked increase in systolic velocity in addition to spectral broadening. Critical stenosis limits flow and pressure and generally occurs when the artery is narrowed by 50% or more. Waveforms at these sites are associated with a doubling of peak systolic velocity compared with the adjacent segments (Fig. 15-3). Waveforms downstream from significant stenoses exhibit widening as a result of turbulence. The result is a noisy, high-pitched Doppler signal. This signal can be heard for several vessel diameters downstream from the site of stenosis because of transmission of the high-velocity jet over this distance. A few centimeters upstream from the stenosis, the waveform is affected by the high resistance of the stenosis. This results in less forward flow and a large, reflected wave following the lower frequency systolic peak. It is heard as a “to-and-fro” signal pattern. Absence of flow is also apparent from lack of Doppler signal, although extremely low flow may not be detectable by handheld Doppler instruments because of inadequate signal generation or cutoff of very low frequencies by the filter, which is used to eliminate wall motion artifacts.
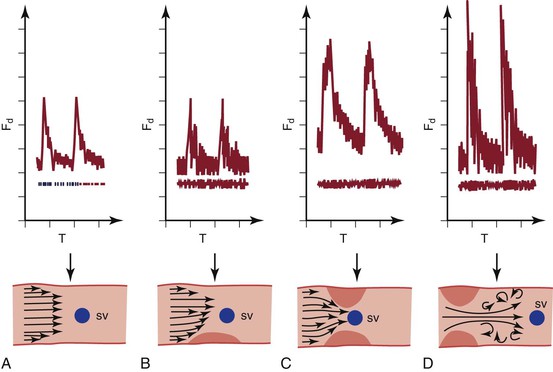
Figure 15-3 Changes in the velocity waveform caused by arterial stenosis. A, Normal waveform with relatively low and uniform velocity (frequency shift). B, Mild stenosis causes disturbed flow in diastole (broadened waveform) and little increase in velocity. C, Significant narrowing (>50%) causes at least a doubling of the peak systolic velocity. D, Beyond a significant narrowing, post-stenotic turbulence causes marked widening of the waveform. Fd, Frequency shift; SV, sample volume; T, time. (Courtesy Jean Primozich.)
Quantitative Waveform Analysis
Audible interpretation of the Doppler waveform is noninvasive, rapid, and inexpensive, but it is operator dependent, subjective, nonquantitative, and limited to readily accessible anatomic sites. More quantitative analysis can be derived from the output of spectrum analyzers. These instruments have a frequency analyzer that uses fast-Fourier analysis or similar methods to provide a full picture of the entire spectrum of frequencies present in each sampling interval. Frequency shifts are displayed on the vertical axis, and time is displayed on the horizontal axis. The amplitude of the reflected signal at each frequency is represented by a gray scale (see Fig. 15-2). The intensity of the gray scale is proportional to the number of red blood cells traveling at a particular velocity at each point in time. These devices, which are used in all duplex scanners, permit identification of features, such as uniformity of flow (narrow band of velocities) or nonuniformity (widening of the velocity waveform, known as spectral broadening). When the angle of insonation is known, the output can be displayed as velocity over time and various parameters can be measured, such as peak and end-diastolic velocity and ratios of various velocity components.
As noted earlier, the normal velocity waveform from an artery supplying a resting extremity is triphasic. The short, reverse component in early diastole is caused by reflected waves from the periphery. When peripheral vascular resistance in the bed being supplied by an arterial segment is low, its velocity waveform does not have the reverse flow component and may become monophasic with forward flow throughout the cardiac cycle. This is true of waveforms from the renal, splenic, and internal carotid arteries. It is also true of waveforms from extremity arteries after exercise, hyperemia, or intra-arterial administration of vasodilating drugs. Conversely, high resistance results in a steep upstroke of the systolic waveform. These principles and the rapidity of the vasoregulatory mechanism at the arteriolar level are easily documented by handheld continuous-wave Doppler interrogation of the radial artery at the wrist. When the fist is clenched, the waveform is more abrupt with minimal diastolic flow. When the hand is relaxed, after as little as 10 seconds, the waveform changes abruptly to continuous forward flow. The hand is observed to turn pink because of the nearly instantaneous vasodilatation that follows even this brief period of relative ischemia, which rapidly returns to normal.
Before the advent of duplex scanning, which allows direct interrogation of velocity patterns along the course of peripheral and abdominal vessels, analysis of waveforms obtained at the femoral level was used as an indirect method to determine whether significant aortoiliac occlusive disease was present. These indirect methods are prone to false-negative interpretations because waveforms can return to normal contours within only a few vessel diameters downstream from a significant stenosis.5,6 Many forms of analysis have been devised for interpretation of waveforms, including the peak-to-peak pulsatility index, Laplace transform, power frequency spectral analysis, pulse-wave velocity, and pulse-transit time. The most widely used has been the peak-to-peak pulsatility index, which is a way to detect dampening of the waveform by proximal stenoses. The equation for calculating this index is as follows:
 [15.2]
where Vmax is the maximum velocity, Vmin is the minimum velocity, and Vmean is the mean velocity. The index is lower (<4.0) when peripheral resistance is low and vice versa.7 It declines in the presence of disease in proportion to the severity and extent of stenosis.8 However, the ability of duplex scanning to evaluate degrees of stenosis based on velocity information taken directly from arterial segments of interest is vastly superior to these less direct methods.
Pressure Measurements
The purpose of the vasculature is to provide blood flow, but flow is more difficult to measure than pressure. Because pressure differentials are the driving force of flow, decreased pressure correlates with decreased flow, and therefore, is a suitable surrogate in most instances. Stenosis causes dampening of the flow velocity waveform, which becomes flattened (Fig. 15-4). Similar changes occur in the pressure and velocity waveforms.
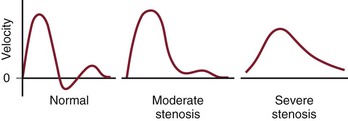
Figure 15-4 The normal velocity waveform from a peripheral artery is triphasic. Downstream from a segment with moderate stenosis, the waveform is damped and is nearly monophasic. Downstream from a segment with severe stenosis, the waveform is damped further and is monophasic. The systolic peak is reduced and the upstroke is less brisk.
The higher frequency components of the pressure waveform are more sensitive to the dampening effects of stenoses, and therefore, a decrease in systolic pressure is more sensitive than a change in mean or diastolic pressure for detecting stenosis. The reduction in pressure is caused by viscous losses resulting from flow through narrow channels and kinetic energy losses secondary to turbulence (turbulence being more significant in all but the smallest arteries). Both viscous and kinetic losses are increased when flow increases. Therefore, mild stenoses that do not cause a drop in pressure in flow and pressure at rest may become evident when flow is increased. This is the principle behind exercise testing and the use of postischemic hyperemia or the administration of vasodilating drugs to detect pressure drops that are minimal or absent at rest. A peak systolic pressure drop across an arterial segment of 10 mm Hg at rest or 15 mm Hg after hyperemia induced by exercise, ischemia, or the administration of vasodilators indicates increased resistance in this segment sufficient to reduce flow by a clinically meaningful amount. Conversely, significant proximal lesions (e.g., in the iliac system) may not be evident even after vasodilatation if the outflow vessels (superficial and profunda femoral arteries) are so diseased that outflow is severely restricted. If there is no flow, there is no pressure drop across a vessel no matter how stenotic.
Ankle Pressure Measurement
Basic Technique
Pressure at the ankle can be measured easily with a blood pressure cuff and a handheld continuous-wave Doppler device (Fig. 15-5). Significant arterial occlusive disease anywhere between the heart and the blood pressure cuff will cause a decrease in systolic pressure at the cuff level. The cuff is placed as low as possible on the leg above the ankle, inflated above systolic pressure, and then slowly deflated while the Doppler probe is held over the posterior tibial artery, just behind the medial malleolus, or the dorsalis pedis artery, slightly lateral to the extensor hallucis longus tendon, about a centimeter distal to the ankle joint.
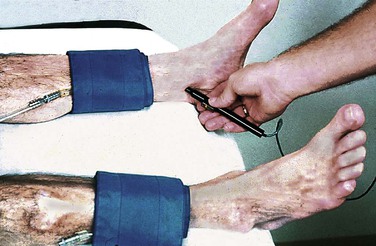
Figure 15-5 Method for measurement of ankle pressure. The cuff is placed just above the ankle, and pressure is measured over the dorsalis pedis and posterior tibial arteries. The higher of the two is used to estimate perfusion pressure at the ankle.
If no signal can be obtained over these arteries, the examiner should check for the terminal branch of the peroneal artery (the lateral tarsal artery), which is just anterior and medial to the lateral malleolus. However, pressure in this artery may not be as good a measure of pedal flow as in the other two tibial arteries because it does not connect directly to the pedal arch.
In general, a pressure of more than 60 mm Hg is required to heal ulceration in nondiabetics. Higher pressure (80 mm Hg or greater) is required for reliable healing in diabetic patients. Although this measurement gives important information, more accurate assessment of the extent of PAD is obtained by calculating the ankle-brachial index (ABI) to normalize for differences in systolic pressure.9
The automated blood pressure instruments that are commonly used in hospitals and clinics to determine blood pressure in the arm may also be used at the ankle level. These devices use oscillometry to determine pressure. The machine detects oscillations of pressure in the cuff as it deflates. Oscillation of cuff pressure is caused by changes in volume in the extremity as a result of influx of blood with each systolic pulse. Oscillation begins while the cuff is well above systolic pressure and continues until it is well below diastolic pressure. Maximum oscillation occurs at mean arterial pressure. Systolic pressure is approximately twice mean pressure. Each manufacturer has its own proprietary algorithm, empirically derived, to determine systolic and diastolic pressure from oscillometry. These algorithms were developed for measurement of arm pressure, but they can also be used for ankle pressure. Like standard Doppler methods, oscillometry has good concordance for normal ankle pressure, but it overestimates pressure when there is moderate disease and is unable to determine pressure in severe disease due to a significantly diminished pressure pulse. Nevertheless, this method may be useful to screen for PAD in primary care clinics because it is rapid and requires no specialized training or equipment.10
Ankle-Brachial Index
Measurement of the ABI is the simplest noninvasive method for documenting the presence of lower extremity arterial occlusive disease. Brachial pressure is used as a surrogate for central aortic pressure, which is not readily obtainable. Brachial pressure is generally accurate unless there is occlusive disease of the vessels supplying the upper extremity. For this reason, pressure is measured in both upper extremities, and the higher of the two is used. Rarely, patients have occlusive disease affecting pressure in both upper extremities; diagnosis of the extent of arterial disease and management of hypertension in these patients can be particularly challenging. The higher ankle pressure (dorsalis pedis, posterior tibial, or peroneal if the other two are absent) is divided by the higher of the two brachial pressures to obtain the ABI for each ankle (Fig. 15-6).
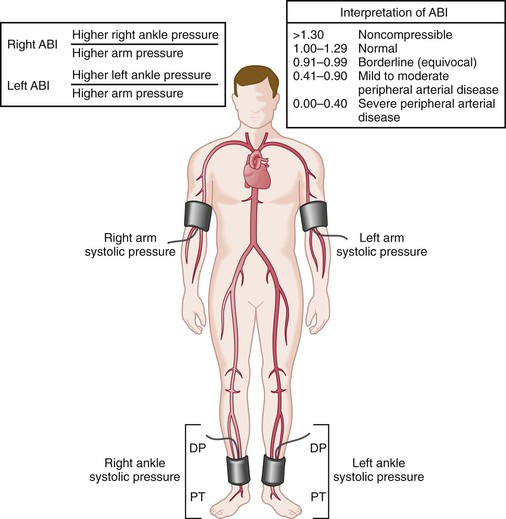
Figure 15-6 Method for measurement of the ankle-brachial index (ABI). The higher of the two brachial pressures and the higher of the two ankle pressures are used for calculation of the index. The patient should be supine and resting for at least 5 minutes before the measurements are made. DP, Dorsalis pedis; PT, posterior tibial. (From Hiatt WR: Medical treatment of peripheral arterial disease and claudication. N Engl J Med 344:1608-1621, 2001.)
Normalizing ankle pressure to brachial pressure serves two purposes. First, it accounts for the normal variation in central pressure that occurs throughout the day and from day to day. This normalized value is less variable than ankle pressure alone. The standard deviation for ABI is approximately 0.07, so differences in measurement of twice this magnitude (0.15) or greater usually represent a significant difference.11 Second, the ratio gives a better appreciation of the extent of arterial occlusive disease. Without accounting for brachial pressure, it would not be possible to know whether a low ankle pressure was caused by systemic hypotension or PAD; conversely, an ankle pressure could be normal despite significant disease if the patient were hypertensive. The goal is to detect occlusive disease by identifying pressure drops between the proximal aorta and ankle.
The pressure waveform changes as it moves through the vasculature (Fig. 15-7). Peak systolic pressure is accentuated by the additive effect of reflected pressure waves from the periphery. Thus, although mean pressure decreases as the pressure wave travels distally, peak systolic pressure increases. As a result, ankle systolic pressure is normally about 10% higher than brachial pressure (ABI of 1.1). Significant PAD decreases this ratio. Consequently, because of the known variance of this test, ABIs in the range of 0.9 to 1.29 are considered normal.
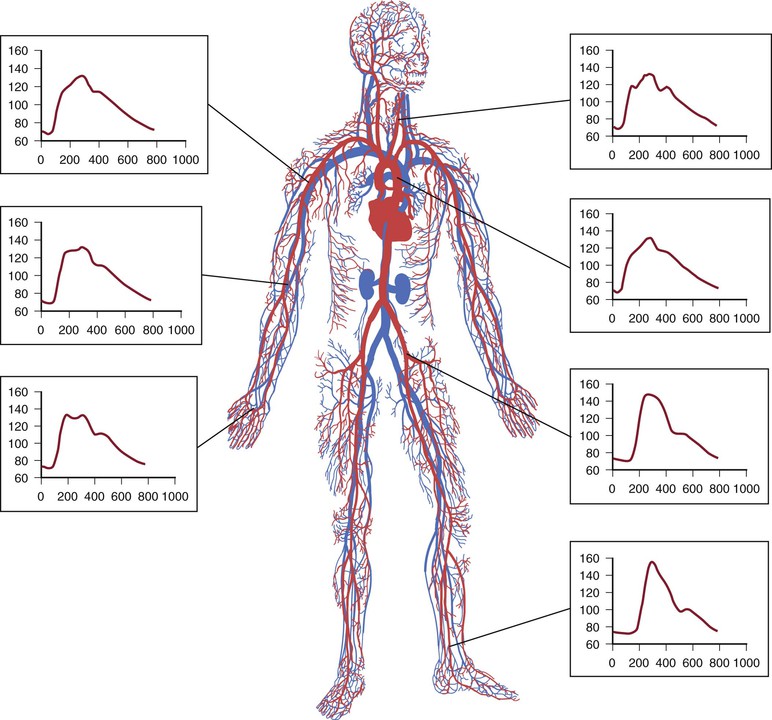
Figure 15-7 The pressure wave changes as it moves distally through the vasculature. Peak systolic pressure is accentuated, and mean arterial pressure decreases.
ABI decreases as the severity and extent of PAD increase (Fig. 15-8). ABI tends to be greater than 0.5 with single-level disease and less than 0.5 with multilevel disease. Most patients with intermittent claudication have an ABI between 0.5 and 0.9, but it may be as high as 1.0 or as low as 0.2. Usually, patients with pain at rest have ABIs below 0.4, and those with impending gangrene have ABIs below 0.3 (Fig. 15-9).
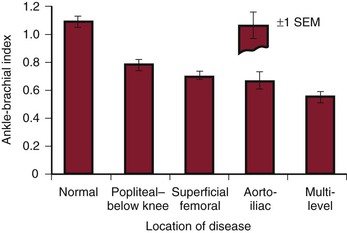
Figure 15-8 Resting ankle-brachial index (ankle systolic/arm systolic) measured in normal limbs and in limbs with arterial obstruction localized to different anatomic levels. (Modified from Strandness DE, Jr, et al: Hemodynamics for surgeons, New York, 1975, Grune & Stratton. Data from Wolf EA, Jr, et al: Correlation between nutritive blood flow and pressure in limbs of patients with intermittent claudication. Surg Forum 23:238, 1972.)
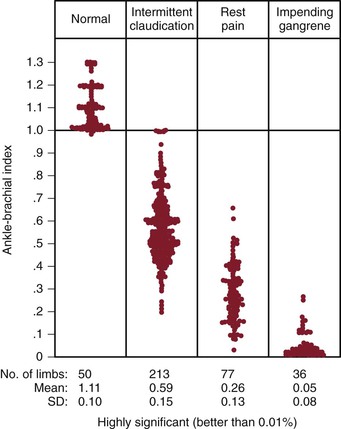
Figure 15-9 Relationship of the ankle-brachial index to functional impairment produced by the occlusive process. (Modified from Yao JST: Hemodynamic studies in peripheral arterial disease. Br J Surg 57:761, 1970.)
Noninvasive tests are useful for the diagnosis of entrapment syndrome. Anatomic entrapment syndrome can be diagnosed by noting changes in ankle plethysmography and ABI with stress maneuvers. The limb is examined with the knee extended and the foot in the neutral, forced plantar-flexed, and forced dorsiflexed positions. The test is considered positive if the ABI decreases more than 0.5 or if there is flattening of the plethysmographic tracing with forced dorsiflexion or plantar flexion.12,13
ABI has been well validated against contrast-enhanced angiography for its ability to detect stenosis of greater than 50%.14 The sensitivity of this test depends on the lower limit of normal that is chosen, with higher limits detecting more disease than lower limits. Investigators have used values ranging from 0.8 to 0.91 as the lower limit of normal.15 Also, some investigators advocate measuring the ABI only at the posterior tibial artery. In contrast, using the lower of the two ankle pressures increases the sensitivity of the test.16 Using an average of the two measurements has been found to correlate better with walking distance than using either the lower or higher ankle pressure.17 The ABI should be interpreted with caution if there is a nonhealing wound. This index may be adequate based on the higher pedal pressure, and yet healing will not occur if the pedal arch is incomplete and the angiosome including the wound is supplied by the more diseased artery. In general, the sensitivity of ABI in detecting PAD ranges from 80% to 95%, and the specificity ranges from 95% to 100%, with positive and negative predictive values in excess of 90%.18 Duplex scanning is more sensitive than ABI in detecting subclinical PAD.19
Stay updated, free articles. Join our Telegram channel

Full access? Get Clinical Tree


