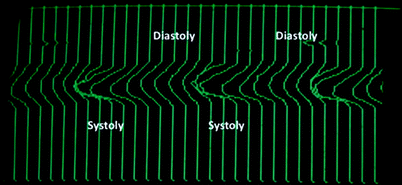
Fig. 5.1
(a) Velocity curve (Doppler spectrum) from posterior tibial artery at rest illustrating how flow velocity is high during systole but low or zero during diastole. Note the steep acceleration and deceleration phase, short negative flow in early diastole – high resistance flow. (b) Velocity curve from internal carotid artery. Note the less steep acceleration and deceleration phases and continuous forward flow throughout the cardiac cycle
Table 5.1
Vascular beds and resistance patterns
Low resistance | High resistance | |
|---|---|---|
Internal carotid | + | |
External carotid | + | |
Vertebral artery | + | |
Renal artery | + | |
Superior mesenteric artery | +a | +a |
Brachial artery | +b | |
Femoral artery | +b |
Flow Profiles
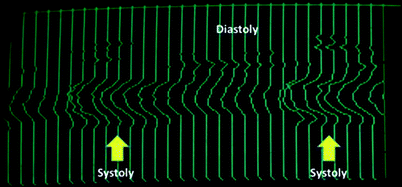
Because arteries are not always straight tubes, but often are curved or bifurcate, blood flow velocity across the vessel may differ. That is, blood flow in the left carotid artery is parabolic in the section between the aortic arch and the carotid bifurcation (parabolic flow: low flow velocities near the vessel walls but high flow in the rest of the artery). However, in the bulb, just before branching into the internal and external carotid arteries (ICA and ECA), blood flow velocities become skewed toward the internal because most flow will be directed to the ICA (Fig. 5.2). Furthermore, flow profiles may vary during the cardiac cycle. As is seen in the flow profile from the ICA, flow is forward during systole in most of the vessel, but opposite the flow divider it is shortly retrograde during systole, whereas in diastole, flow is continuously forward (Fig. 5.3).


Fig. 5.2
Flow profile (pulsed multigated Doppler) from the common carotid artery just before bifurcating into the ICA and ECA. Each vertical line represents velocity as a function of depth, with forward illustrated to the left and backward flow to the right. A new line is generated every 80 ms

Fig. 5.3
Flow profile (pulsed multigated Doppler) from carotid bifurcation showing flow separation (arrows) during systole. Note flow is retrograde (right shift) along the far wall of the artery during systole
Velocity Profiles
Velocity profiles may differ according to vascular bed being supplied. The CCA bifurcates into the ICA and ECA, the ICA supplying the brain having an almost constant, high blood flow due to a high oxygen demand. Therefore, resistance is low resulting in high flow throughout the cardiac cycle. The ECA supplies mainly structures outside the skull and reveals a more or less constant high resistance with only low forward flow in diastole.
As mentioned, also physiological states in vascular beds affect velocity profiles. In the resting limb, the velocity profile is triphasic: steep acceleration and deceleration phase during systole, a short period of retrograde flow, and then slow forward flow in diastole. Almost similar, the velocity profile in the superior mesenteric artery reveals only little diastolic flow when fasting, but shortly after a meal, resistance is lowered, and flow is high both in systole and diastole.
The pulse wave moves forward from the heart after contraction of the ventricle. The speed depends on stiffness of the arteries it travels through; i.e., it may become faster with age with gradual stiffening of the arteries. Watching an electrocardiogram (ECG) and palpating the radial artery pulse at the same time will reveal that pulse is felt sometime after the t-notch and not during the QRS complex when left ventricle contraction takes place. When the pulse wave moves, the artery due to its elastic properties dilates and recoils, thereby promoting forward blood flow since the aortic valve inhibits backward flow. The dilatation is typically 2–3% but may be up to 10% depending on which artery: the carotid bulb dilates up to 10% and other large arteries a 2–5%. Aortic aneurysms may dilate up to 10% more during systole. If reliable measurements for comparison over time, i.e., of aortic diameter, are to be made, first of all, measurements have to be taken at a defined stage in the cardiac cycle, i.e., during systole or diastole. In order to do accurate repeated measurements in the same patient during the same investigation, ECG triggering may be used to identify exactly the same stage of the cardiac cycle.
The effect of gravity is important to have in mind when performing and evaluating vascular testing. For blood pressure measurement, in order to get an estimate of central cardiac blood pressure, the cuff should be at approximately the same level as the heart. Placing it on the upper arm with the patient sitting relaxed with the arm at the side of the chest, or lying down with his arms by the side, the blood pressure will be quite representative. Since the mid-brachium will be at the same level as the heart, both sitting and lying blood pressure measurement should reflect central blood pressure. However, care should be taken when estimating peripheral blood pressure, being it on the antebrachium or at the ankle. Here, it is imminent to evaluate if the location of the blood pressure cuff is at the level of the heart. A difference of, i.e., 10–15 centimeter (cm) will result in a difference in blood pressure of 7–11 mmHg; 15 cm difference equals to 150 mm water which is the same as 11 mmHg (150/13.6). Ankle pressure standing is therefore very high: the central cardiac systolic pressure plus the distance from the heart to the ankle translated into mmHg. For an average person 180 cm in height, the distance from the heart to the ankle may be 140 cm; thus, the ankle pressure standing would be approximately 240 mmHg if the “normal” central pressure is 120/80 mmHg.
Evaluating arterial flow patterns, i.e., with ultrasound Doppler, is best performed with the patient lying; thus, most arteries will be at heart level. Gravity obviously has much greater impact when investigating the venous circulation, which will be discussed later.
Blood Flow in Diseased Arteries
The far most common arterial disease seen in the western world is atherosclerosis which is an inflammatory process that develops over decades. Atherosclerosis results from thickening of the vessel wall due to lipid accumulation and inflammation in the intima and subsequent plaque develops. Because of the slow buildup of plaque and arterial remodeling, hemodynamic changes do not take place for years. Therefore, early stages of atherosclerosis are not detected by tests that evaluate hemodynamic parameters rather imaging methods should be used. Not before the arterial lumen is reduced by 15–20% may local effects of atherosclerotic plaque/stenoses be detected. Eventually, atherosclerotic lesions grow and gradually reduce the lumen more and more, and in some cases, acute thrombosis occurs resulting in sudden occlusion at the site of stenosis or dislodgement of thrombotic material (embolism). Other conditions that may result in pathological hemodynamics are trauma, dissection, aneurysms, etc.
Arterial stenosis, from whatever cause, results in a number of flow-related changes of which three are essential to understand when interpreting noninvasive vascular tests: changes in peak flow velocity, development of turbulence, and changes in flow profile.
Critical Stenosis
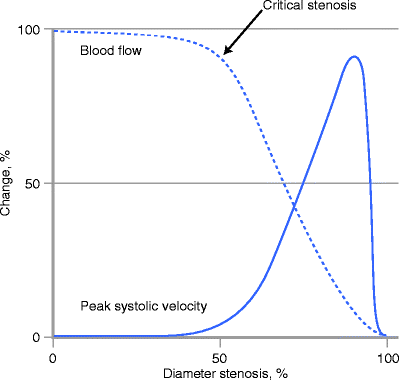
Critical stenosis (or significant stenosis) is a term commonly used to describe a lesion severe enough to reduce flow through the artery. In general terms, and with the hemodynamics in the human circulation, we speak about a critical stenosis when the lumen (cross-sectional area) is reduced by 75%, as may be seen in Fig. 5.4. Seventy-five percent luminal reduction corresponds to a 50% reduction in diameter if seen on an arteriogram or longitudinal ultrasound B-mode image (assuming a round artery).


Fig. 5.4


Diagram showing the relationship between volume flow, degree of stenosis, and pressure. The term “critical stenosis” is typically used when a stenosis exceeds the degree where volume flow decreases
Stay updated, free articles. Join our Telegram channel

Full access? Get Clinical Tree


