Figure 4.1
illustrates the principle of Bernoulli Equation which relates pressure drop that occurs with changing fluid speeds across a narrowing in tube
The modified Bernoulli equation is derived from the Bernoulli equation which relates pressure drop as fluid speed changes across a tube due to change in diameter of the tube. This pressure drop has been applied to stenotic and regurgitant valve orifices to measure pressures across the valves.
 where ρ is density of blood, V1 and V2 represents velocity proximal and distal to stenosis respectively. The second and third parts of the equation representing flow acceleration and viscous resistance components are usually relatively small and ignored in clinical practice [1].

The origin of 4 in modified Bernoulli equation:
Since we measure pressure in mmHg instead of Pascals, and the density of blood is approximately 1060 kg/m3, we get P (in Pa) = ½ ∙ 0.0075 mmHg/Pa (conversion factor) ∙ 1060 kg/m3 ∙ (V22 – V12 (in m/s)) = 3.975 ∙ (V22 – V12). (note: density of blood and conversion factors are approximated). Since 3.975 is close to 4, the equation is further modified to:
 For clinically important transvalvular gradients where V2 is generally much greater than V1, the 4 V1 2 term is negligible compared to the 4 V2 2 term and the 4 V1 2 term is dropped further simplifying the equation to:
 Things to remember:


If V1 > 1.5 m/s or V2 < 3 m/s, then need to include the 4 V1 2 term in the Bernoulli equation.
Pressure recovery: determination of pressure gradient by CV Doppler assumes that all the energy which is transferred to kinetic energy of accelerated flow is dissipated completely and not recovered. The pressure recovery depends on both the effective orifice size of AS jet and aortic size.

Aortic Stenosis
Transvalvular Pressures
Transvalvular pressures are estimated from velocities obtained by Doppler using the Simplified Bernoulli equation: 4 V2 where V is the peak velocity (Fig. 4.2)
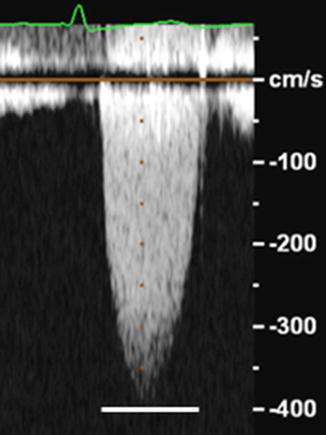

Figure 4.2
Peak transaortic velocity of 400 cm/s or 4 m/s (solid white line) as obtained by Doppler echocardiography in a patient with aortic stenosis; Peak pressure across the stenotic aortic valve can then be calculated as 4 (4 m/s)2 = 64 mmHg
Mean trans AV gradients are based on averaging of instantaneous gradients. In cases where Vprox > 1.5 m/s or Vdistal < 3 m/s, it is recommended to use maximal gradients and velocities for stenosis severity estimation as mean gradients are often not accurately assessed [2].
Maximal pressure gradient calculated is representing maximal transvalvular gradient, not peak LV to peak aortic difference which is obtained from cardiac catheterization (note the peak pressures are not simultaneous). Mean gradients should be used to compare gradients obtained by Doppler echocardiography to cardiac catheterization gradients [3].
Aortic Valve Area Calculations
Aortic valve area in aortic stenosis is calculated using the continuity equation (Fig. 4.3). By the law of conservation of mass the volume flow is constant. Flow proximal to stenosis must equal flow distal to stenosis. Flow is calculated as cross sectional area times velocity and aortic valve area can be calculated as:
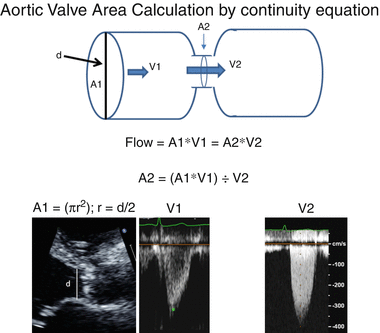


Figure 4.3
illustrates continuity equation which is used to calculate aortic valve area in aortic stenosis. Flow proximal (Q1) to stenosis must equal flow distal (Q2) to stenosis by principle of conservation of mass. Flow is calculated as cross sectional area times velocity. A1 is the cross sectional area of the LVOT velocity and is calculated as πr2 where r = d/2 and d is the diameter of the LVOT; V1 = proximal time velocity integral by pulse wave Doppler; V2 = maximum instantaneous time velocity integral across aortic valve by continuous wave Doppler


Points to remember:
The shape of LVOT is not circular but elliptical in many patients and thus the AVA calculation is often underestimated
The actual calculated area is effective orifice area, not the anatomical valve area (and thus is smaller).
Pliability and shape inlet to the valve orifice will affect location and size of vena contracta
Peak velocities of LVOT and aortic valve can be substituted for time velocity integral
Mitral Valve Stenosis
Rheumatic Mitral Stenosis
Rheumatic mitral stenosis severity is assessed by valve area using direct planimetry of the mitral valve orifice or by pressure half time (PHT) or deceleration time (DT).
Direct Planimetry is preferred method if images are of good quality (Fig. 4.4). Planimetry is performed in the short axis view at the level of the smallest mitral valve orifice. This is generally determined by scanning back and forth to determine the smallest orifice. 3D guided measurement of mitral valve area planimetry has been shown to improve reproducibility of MVA area measurements.
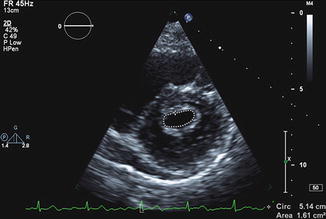

Figure 4.4
Direct planimetry of mitral valve area in patient with rheumatic mitral stenosis
Pressure Half Time (PHT) or Deceleration Time (DT):
MVA can be calculated by using the following empirically derived formulas:
 (Fig. 4.5) or
  . These are simple relatively reproducible measurements to MVA. However, one should use both formulas with caution since they do not take into consideration other variables such as initial pressure gradient, atrial and ventricular compliance, aortic regurgitation, etc [6]. With significant aortic regurgitation (moderate or greater) the MVA can be overestimated.
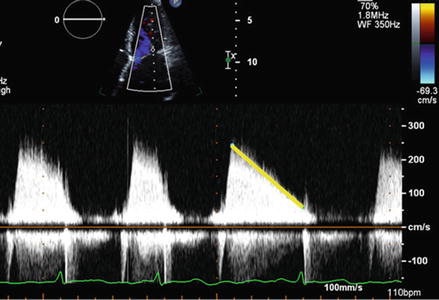
Figure 4.5
Measurement of pressure half time in patient with rheumatic mitral stenosis. PHT is measured by measuring deceleration slope of mitral gradient (yellow line)
Mean transmitral gradients (Fig. 4.6) are important as confirmatory data to determine the severity of mitral stenosis. However it is important to consider that gradients are flow related and heart rate or cardiac output can impact the gradients. We recommend documenting heart rate when reporting the gradient.
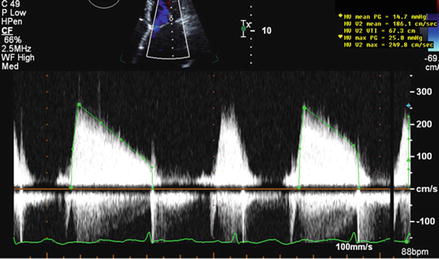

Figure 4.6
Measurement of peak and mean transmitral gradient
Alternate methods for calculating mitral valve area are the Continuity equation and PISA (Proximal Isovelocity Surface Area) method. These latter two methods are time consuming and require significant operator experience. These methods are not applied widely in clinical laboratories.


It is important to remember that care needs to be taken in measuring LVOT diameter as both the echocardiographic cut angle and shape of LVOT (which becomes more elliptical further away from AV) are important sources of error.
< div class='tao-gold-member'>
Only gold members can continue reading. Log In or Register to continue
Stay updated, free articles. Join our Telegram channel

Full access? Get Clinical Tree


