14 Valvular Disease
Mitral Valve Stenosis
 Anatomical and Pathophysiological Basics
The most frequent cause of mitral stenosis is rheumatic endocarditis. The pathomorphological sequelae of this disease lead to an increasing deformation of the valve over years or decades. With progressive scarring, fusion of the commissures, and calcification, these processes result in increasing rigidity and narrowing of the mitral valve opening. Less frequent causes are congenital defects, lupus erythematosus, carcinoid, severe calcification of the mitral valve annulus, or secondary degenerative changes. Functional stenoses can also be caused by an atrial myxoma or a cor triatriatum.
Two-thirds of patients with rheumatic mitral stenosis are female. The normal mitral valve area is ~4.5 cm2; symptoms usually occur only when the valve area is less than 2.0 cm2.
Specific Hemodynamics
When diastolic blood flow through the stenotic mitral valve is impeded, cardiac output decreases and left atrial pressure increases, but end-diastolic pressure in the left ventricle remains normal.
The pressure increase in the left atrium depends on the following factors:
 Severity of the stenosis (valve area)
 Cardiac output
 Duration of diastole
The relationship between valve area, pressure gradient at the mitral valve, and cardiac index was expressed in the Gorlin equation (see Chapter 12, p. 114) and is shown in Fig. 14.1.
 In mild mitral stenosis, left atrial pressure is only slightly increased during rest; with moderate stenosis it is usually still markedly below 20 mm Hg.
 With stress and correspondingly increased cardiac output and shortened duration of diastole, left atrial pressure can increase with moderate stenosis up to 35 mm Hg and result in marked dyspnea.
 In severe mitral stenosis (valve area < 1.0 cm2) left atrial pressure at rest is already markedly increased (> 20 mm Hg). At the same time, the cardiac index is also reduced at rest with correspondingly increased peripheral oxygen extraction.
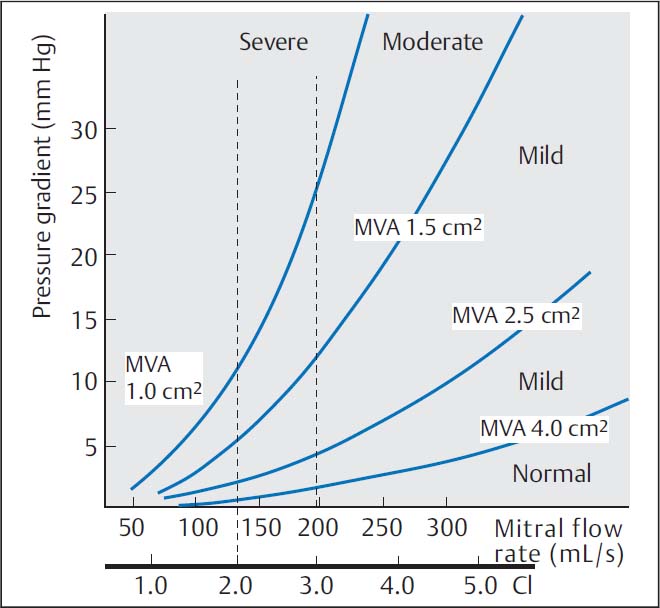
Fig. 14.1 Pressure–flow relationship in mitral stenosis according to the Gorlin equation. CI, cardiac index; MVA, mitral valve area.
The shortening of diastole with the onset of a tachyarrhythmia is the primary cause of acute hemodynamic deterioration of a patient because of the exponential increase in the pressure gradient (see the Gorlin equation, p. 114).
Pulmonary Circulation
The increased pulmonary venous pressure in severe mitral stenosis results in a reactive increase in pulmonary vascular resistance, which via a reduced cardiac output decreases the pressure in the left atrium and in the pulmonary veins.
Over years the chronic pressure increase in the pulmonary circulation leads to characteristic functional and morphological changes of the pulmonary vessels and of the pulmonary parenchyma.
 The morphological changes consist of thickening of the alveolar septa and media hypertrophy of the small pulmonary vessels (subsequently intima fibrosis and sclerosis).
 The functional changes consist of a reflex vasoconstriction due to the pressure increase in the left atrium as well as vasoconstriction of the pulmonary vessels caused by hypoxia.
As a consequence of these morphological and functional changes there is an increase in the pulmonary artery pressure, which markedly exceeds the pressure increase in the left atrium and in the pulmonary capillary wedge position due to the mitral stenosis and which can exceed the systemic pressure. The pressure overload of the right ventricle due to the pulmonary hypertension results in right ventricular hypertrophy and dilatation with tricuspid regurgitation, right atrial dilatation, and development of overt right ventricular failure.
 Indication
Diagnosis and classification of the severity of the mitral stenosis can usually be done on the basis of symptoms, Doppler echocardiography, and right heart catheterization. If these findings are unambiguous, a left heart catheterization to confirm the diagnosis may not be necessary.
However, cardiac catheterization is always indicated in the following cases:
 If noninvasive findings regarding the severity of the mitral stenosis are discrepant
 If the presence of a concomitant valvular defect is suspected
 To assess for coronary artery disease (age > 40 years, coronary risk factors)
 Before planned percutaneous mitral valvuloplasty
 Before planned surgical repair
 Goal
Goal
 Assessment of the severity of the mitral stenosis:
– Measurement of the pressure gradient at the mitral valve
– Calculation of the valve area according to the Gorlin equation
 Evaluation of possible concomitant mitral regurgitation
 Quantitative evaluation of pulmonary hypertension
 Detection of right and/or left ventricular dysfunction
 Evaluation of possible concomitant tricuspid regurgitation
 Assessment for coronary artery disease
 Procedure
 Arterial and venous puncture (4F–6F)
 Catheterization of the left ventricle, placement of a pigtail catheter (4F to 6F)
 Right heart catheterization with placement of the catheter in pulmonary capillary wedge position
 Simultaneous pressure recording of PCW and LV
 Determination of cardiac output
 Left ventriculogram
 Right cardiac catheter pullback with pressure recording
 Left cardiac catheter pullback with pressure recording
 Aortography if required
 Right ventriculogram if required
 Coronary angiography
 Special Characteristics
The frequently significant right ventricular and right atrial dilatation in severe pulmonary hypertension can complicate right heart catheterization and advancement to the pulmonary capillary wedge position. Therefore, it is recommended to use larger (6F) catheters with good steerability and, if necessary, to stiffen the catheter with a guidewire.
 To assess the severity of the mitral stenosis it is crucial to obtain the pulmonary capillary wedge position. If this position cannot be obtained, transseptal puncture of the left atrium is indicated.
According to the Gorlin equation, pressure gradient and valve area are dependent upon cardiac output; therefore, simultaneous measurement of the pressures in the left atrium (or pulmonary capillary wedge pressure) and left ventricle are absolutely required.
This is especially true if an arrhythmia such as atrial fibrillation, which is frequently seen in mitral stenosis, is present. Cardiac catheterization during intermittent tachyarrhythmic periods is suboptimal, as cardiac output cannot be assumed to be stable. Heart rate stabilization with drugs should be attempted before the examination; in individual cases intravenous administration of, for example, verapamil or a β-blocker may also be required during catheterization.
 Findings on Cardiac Catheterization
Left Ventriculogram
Left ventricular size and contractility are normal in the majority of patients with isolated mitral stenosis. In individual patients left ventricular function is markedly reduced, not infrequently with regional hypokinesis of the apical and posterobasal wall segments. Potential causes are a concomitant rheumatic myocarditis or scarring of the mitral valve apparatus, dyssynchrony between right and left ventricle, and impaired left ventricular compliance.
Left Atrial Pressure Curve/Pulmonary Capillary Wedge Pressure
In mild mitral stenosis frequently only the a-wave of the left atrial (or pulmonary capillary wedge) pressure curve is increased as a sign of the enhanced left atrial contraction. In severe mitral stenosis the left atrial mean pressure increases markedly (> 20 mm Hg). The a-wave remains emphasized as long as sinus rhythm is present; the x-descent is well visible; due to the delayed filling of the left ventricle during diastole the v-wave shows a slow decrease to the y-descent. In atrial fibrillation the a-wave is completely absent and the x-descent is markedly less deep (Fig. 14.2). If there is concomitant mitral regurgitation, the x-descent is completely missing, and a pronounced, exaggerated v-wave can be seen.
While the form analysis of the left atrial pressure wave is easy, it is not always possible in the pulmonary capillary wedge position. The wave should neither be damped too much nor superimposed with artifacts. Too much variation due to respiration must also be avoided.
 The pulmonary capillary wedge pressure tracing may only be used to measure the pressure gradient between left atrium and left ventricle if it fulfills all the form criteria of the left atrial pressure tracing. Otherwise false determinations of the mitral valve area are bound to occur.
Pulmonary Artery Pressure/Pulmonary Vascular Resistance
With normal pulmonary vascular resistance the pulmonary artery mean pressure is ~5 to 10 mm Hg higher than the mean pulmonary capillary wedge pressure and pulmonary capillary wedge pressure and diastolic pulmonary artery pressure are at the same level. If due to the structural changes described above there is an increase in pulmonary vascular resistance, the diastolic pulmonary artery pressure is higher than the mean pulmonary capillary wedge pressure. Pulmonary hypertension is quantified by calculating pulmonary vascular resistance (normal value 45–100 dyn·s·cm−5; calculation p. 113). Values above 200 dyn·s·cm−5 are found with reactive pulmonary hypertension with changes of the pulmonary vasculature, while with severe mitral stenosis, values above 1,500 dyn·s·cm−5 can be observed.
Right Ventricular and Right Atrial Pressure
Pulmonary hypertension necessitates a corresponding increase in right ventricular systolic pressures, in extreme cases the right and left ventricular pressures become equal (Fig. 14.3). The pressure load also increases right ventricular end-diastolic pressure. If sinus rhythm is present, the a-wave of the atrial pressure wave is emphasized, indicating enhanced atrial contraction. More frequently there is atrial fibrillation with increased atrial mean pressure as a sign of right ventricular failure. Concomitant tricuspid regurgitation also increases right atrial mean pressure with characteristic changes of the atrial pressure tracing such that there is a high v-wave, augmentation of the y-descent and flattening of the x-descent.
Cardiac Index/Pressure Gradient
The dependency of the pressure gradient at the mitral valve on cardiac index is illustrated for different mitral valve areas in Fig. 14.1. Characteristic of more severe mitral stenosis is a reduced cardiac index (< 2.5 [L/min]/m2). This is both a direct consequence of the valve stenosis and a consequence of the reactive pulmonary hypertension. It is especially prominent if there is also atrial fibrillation. As a result of the reduced cardiac output, peripheral oxygen extraction is increased with correspondingly decreased oxygen saturation in the mixed venous blood.
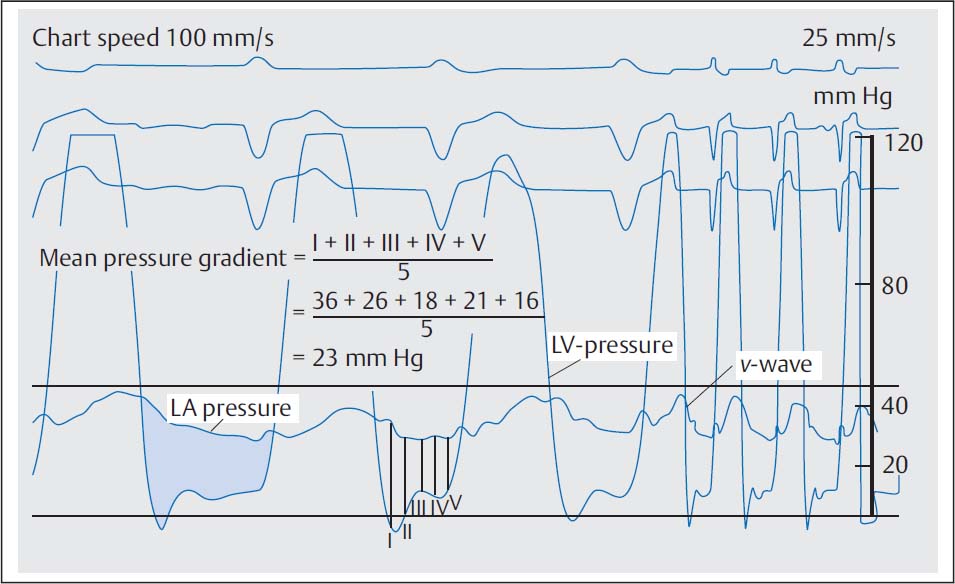
Fig. 14.2 Severe mitral stenosis. Simultaneous pressure recording in the left ventricle and in the left atrium after transseptal puncture (76-year-old woman with atrial fibrillation, mitral valve area 0.5 cm2).
Mitral Valve Area
Mitral valve area is calculated according to the Gorlin equation:
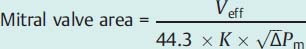
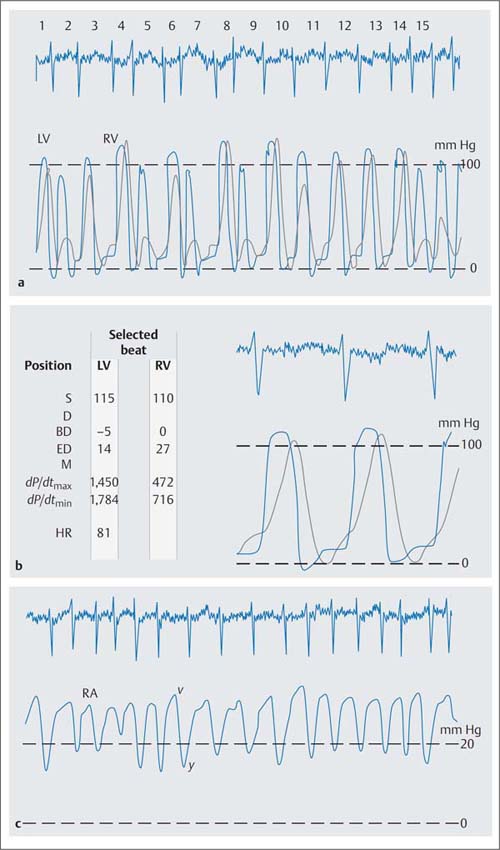
Fig. 14.3 Severe pulmonary hypertension in severe mitral stenosis (mitral valve area 0.76 cm2). Simultaneous pressure recording in the right and left ventricle with pressure equalization the systolic pressures (a) and (b) high v-wave and deep y-descent in the atrial pressure wave (c) as a consequence of the right ventricular dysfunction with concomitant tricuspid regurgitation.
Hemodynamics | |
Aorta: | 115/77 mm Hg |
LVEDP: | 8 mm Hg |
PCW: | 26 mm Hg |
PA: | 101/51 (80) mm Hg |
RV: | 110/0–27 mm Hg |
RA mean: | 25 mm Hg |
CO: | 3.1 L/min |
Cardiac index: | 1.73 (L/min)/m2 |
Pulmonary vascular resistance: | 1,239 dyn·s·cm−5 |
S | systolic pressure |
D | diastolic pressure |
BD | early diastolic pressure |
ED | end-diastolic pressure |
M | mean pressure |
HR | heart rate |
The mean diastolic pressure gradient (ΔPm) at the mitral valve is calculated as the integral between pulmonary capillary wedge pressure (= left atrial pressure) and left ventricular pressure (computer-based, planimetrically, or with the 5-point equation, p. 108).
For the measurement of the diastolic pressure gradient, the pulmonary capillary wedge pressure can be equated with the left atrial pressure and can be used with good precision for the calculation of the valve area.
 However, it is crucial that the pressure measurement is done in the pulmonary capillary wedge position. A damped pulmonary artery pressure must not be used to calculate the pressure gradient.
The following criteria are used to determine the correct pulmonary capillary wedge position:
 The form analysis of the pulmonary capillary wedge pressure tracing, which has to fulfill all form criteria of the atrial pressure tracing
 A lower mean pulmonary capillary wedge pressure compared with the pulmonary artery mean pressure
 Oxygen saturation in the wedge position, which has to agree with the arterial oxygen saturation
When measuring the mean pressure gradient between PCW and diastolic left ventricular pressure the time difference between the pressures (~50–70 ms) between the left atrium and the pulmonary capillary bed has to be considered. The v-wave of the left atrial pressure wave reaches its peak immediately before the steep end-systolic pressure increase of the ventricular wave (Fig. 14.4). If no computerized correction of the time difference is available, the corresponding pulmonary capillary wedge wave for the pressure measurement is shifted so that it corresponds to the position of the left atrial v-wave as described above.
If there is substantial discrepancy between the invasively measured mitral valve area based on the pulmonary capillary wedge pressure wave and the echocardiographic findings and symptomatic status, it may be necessary for patient management to do a transseptal puncture with direct measurement of the left atrial pressure (Fig. 14.4). However, this is only required in exceptional cases.
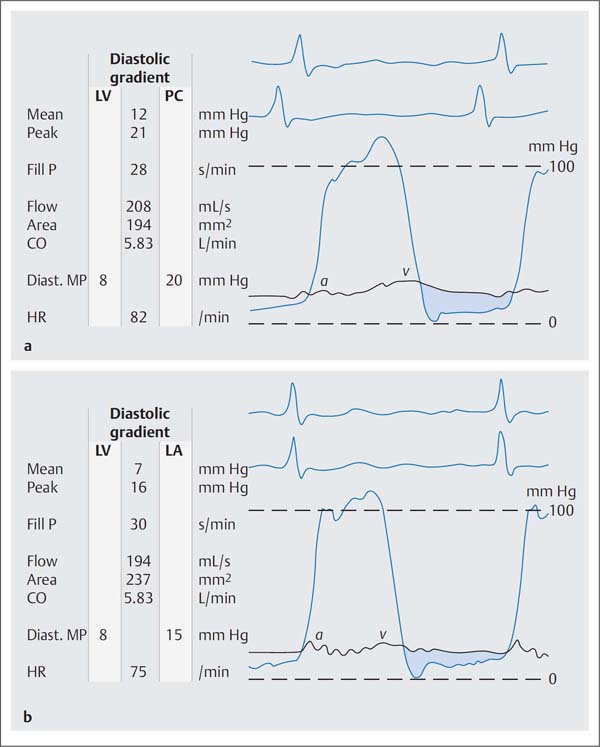
Fig. 14.4 a, b Moderate mitral stenosis.
a Simultaneous pressure recording LV-PCW; mitral valve area 1.94 cm2.
b Simultaneous pressure recording after transseptal puncture LV–LA; mitral valve area 2.37 cm2.
Mean | mean pressure |
Peak | peak pressure |
Fill P | diastolic filling period |
Diast. MP | diastolic mean pressure |
HR | heart rate |
Cardiac output must be determined at the same time as the determination of the mean pressure gradient, because even at rest it cannot be assumed that cardiac output is constant.
 If there is concomitant tricuspid regurgitation, determination of cardiac output with the thermodilution method is incorrect and should not be used to calculate mitral valve area (CO too high due to the regurgitating indicator and thus broadened thermodilution curve). If there is concomitant mitral regurgitation, calculating mitral valve area with the Gorlin equation will overestimate the degree of stenosis. This is because the pressure gradient at the valve is due to effective stroke volume plus regurgitant volume, whereas valve area is calculated only with the effective stroke volume.
This source of error can be compensated for by angiographic determination of the regurgitant volume. Methodological imprecision should be considered when the findings are interpreted.
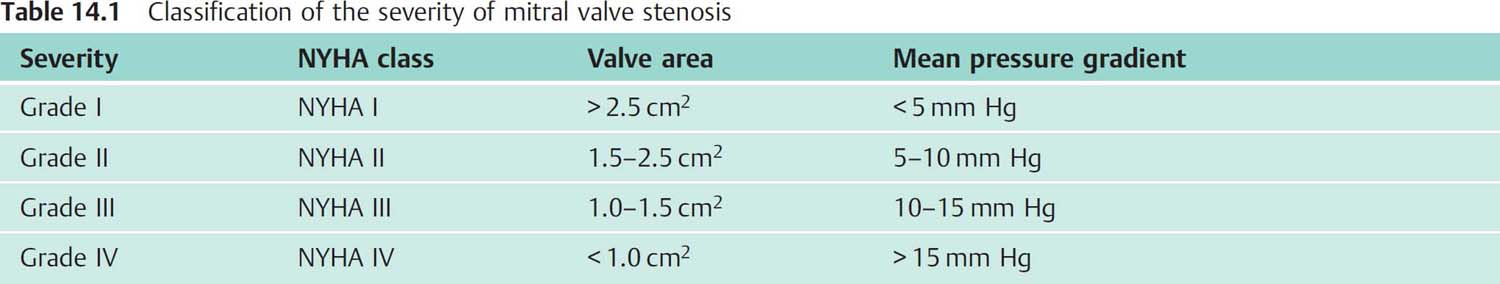
Classification of Severity
The severity of mitral stenosis is classified primarily on the basis of the symptomatic criteria of the NYHA classification. Usually there is a good agreement between clinical severity, invasively determined mitral valve area, and the pressure gradient across the valve with normal cardiac output at rest (Table 14.1).
 Interpretation of Findings and Patient Management
The decision regarding surgical, interventional, or medical therapy of the mitral stenosis depends ultimately on the hemodynamic severity of the stenosis and the overall risk of the patient.
Usually surgical or interventional therapy is indicated at clinical stage NYHA III, at which the valve area is usually less than 1.25 cm2.
Prognosis and therapeutic decisions depend substantially on the clinical status. For example, surgical correction at clinical stage NYHA IV has a high perioperative mortality of 10 to 25 %. Nevertheless, the prognosis is better than with medical therapy alone. This is also true for patients with severe reactive pulmonary hypertension, which after surgical repair or valvuloplasty can regress significantly in many cases with a corresponding improvement in symptoms.
Therapeutic decisions are more difficult for clinical severity NYHA II, with atypical symptoms or with moderate stenoses. These patients often benefit from percutaneous valvuloplasty.
The following examinations and findings are relevant for patient management and for the choice of intervention:
 Clinical examination: NYHA class, recurrent emboli?
 Left/right heart catheterization: valve area, concomitant mitral regurgitation, pulmonary vascular resistance, concomitant coronary artery disease, other valvular defects
 Transthoracic and transesophageal echocardiography: valvular motility and morphology, especially calcifications, papillary muscles and chordae, demonstration of thrombi in the left atrium
 Right heart catheterization: pulmonary artery pressure and CO response to stress
 Cardiac MRI and cardiac CT: Currently neither method has an established role for quantification or patient management.
The following findings favor surgical or interventional treatment:
 Left/right heart catheterization:
– Mitral valve area < 1.25 cm2
– Pulmonary capillary wedge pressure > 20 mm Hg
– Cardiac index decreased at rest
– Pulmonary vascular resistance > 450 dyn·s·cm−5
 Right heart catheterization:
– Cardiac index without physiological increase under stress
– Increase in pulmonary artery mean pressure to >40mm Hg at 25W
 NYHA class:
– NYHA I: indication if stenosis is severe
– NYHA II: indication primarily for valvuloplasty
– If valve area < 1.5 cm2
– Limited activity level
– For women wishing to become pregnant
– NYHA III: surgical valvular repair or replacement or percutaneous valvuloplasty is indicated if the valve area is < 1.5 cm2
– NYHA IV: definitive indication for therapy; however, there is high peri- and postsurgical mortality
 Independently of NYHA class: with recurrent systemic emboli despite adequate anticoagulation
Only in exceptional cases will the operator be able to make therapeutic decisions based on individual findings. In most cases the presence of concomitant mitral regurgitation and the extent of calcification of the valve apparatus determine whether a mitral commissurotomy or a valvuloplasty is possible or whether a mitral valve replacement is required. The procedure for percutaneous mitral commissurotomy and its contraindications will be discussed in Chapter 31.
Mitral Regurgitation
 Anatomical and Pathophysiological Basics
Mitral regurgitation can develop due to organic changes of the valves, papillary muscles, or chordae, or secondarily to dilatation of the left ventricle. Among the numerous possible causes of mitral regurgitation (Table 14.2), prolapse of individual or several valvular segments is currently the leading cause that requires surgical valve replacement or reconstruction; this is followed by papillary muscle dysfunction secondary to coronary artery disease, infectious endocarditis, and rheumatic valve diseases. There are also reports of mitral regurgitation after the use of appetite suppressants.
With mitral valve prolapse both the leaflets and the chordae can be affected by the changes. The enlarged mitral leaflets prolapse convexly into the left atrium and cause mitral regurgitation of differing degrees of severity. Furthermore, mitral prolapse with rupture of the chordae tendineae is a cause of acute mitral regurgitation.
Other causes of acute mitral regurgitation with usually larger regurgitant volumes are papillary muscle dysfunction or a papillary muscle rupture after acute ischemia of the area that supplies the papillary muscles, and leaflet perforations or chordae ruptures as a result of infectious endocarditis.
An isolated mitral regurgitation as a result of rheumatic valve disease is rather rare; usually there is concomitant mitral stenosis.
Table 14.2 Causes of mitral regurgitation
Underlying disease | Pathomorphology |
Mitral valve prolapse | (Myxomatous) Changes of the leaflet and/or chordae tendineae, rupture of the chordae |
Papillary muscle dysfunction due to – Chronic ischemia – Myocardial infarction | Necrosis, scarring of a papillary muscle, papillary muscle rupture |
Infectious endocarditis | Valve destruction, perforation of the leaflet, rupture of the chordae |
Rheumatic valve disease | Shrinking of the leaflet and of the chordae tendineae |
Endocardial cushion defects – Septum primum defect – Partial and total AV canal | Cleft mitral valve |
Relative mitral regurgitation – Dilated cardiomyopathy – Coronary artery disease – Post myocardial infarction – Decompensated hypertensive heart disease | Lateral displacement of the papillary muscles, ventricular dilatation, loss of the sphincter function, asynergy |
Hypertrophic obstructive cardiomyopathy | Asynergy |
Appetite suppressant use | Plaquelike encasement of leaflets and chordae tendineae |
Due to the valve’s inability to close during systole, blood is ejected from the left ventricle both into the aorta and into the left atrium. The regurgitant blood volume depends on the area of the mitral valve that is open during systole, on the left atrial pressure, and on the systemic vascular resistance (left ventricular afterload). As the blood volume that flows back into the left atrium during systole will flow again into the left ventricle in addition to the blood volume that is received from the lungs, volume overload of the left atrium and of the left ventricle ensues.
Compensatory mechanisms in mitral regurgitation are aimed at adjusting for the regurgitant volume to maintain a normal effective stroke volume. If the regurgitant volume is small, this is achieved by increasing ejection fraction. Larger regurgitant volumes are compensated for by an additional increase in left ventricular end-diastolic volume (= increased total stroke volume).
A normal effective stroke volume cannot be maintained when the regurgitating volume is large despite these compensatory mechanisms. Heart failure develops, with initially still preserved ventricular function but not yet congestion. The left ventricular end-diastolic pressure (LVEDP) is not considerably elevated, the left atrial mean pressure only slightly. However, chronic volume overload ultimately leads to left ventricular systolic dysfunction with increased LVEDP, increased pressures in the pulmonary circulation, and decreased effective cardiac output.
Specific Hemodynamics
Acute mitral regurgitation. The hemodynamic particularities of acute and chronic mitral regurgitation are primarily determined by left atrial compliance. In acute mitral regurgitation usually a relatively large amount of blood regurgitates during systole into a left atrium that is not enlarged and not easily stretched. This leads to a large increase in left atrial pressure, especially of the v-wave, which is more than double, occasionally triple, the atrial mean pressure (or mean pulmonary capillary wedge pressure). The ejection fraction is compensatorily increased.
Compensatory increases in left ventricular end-diastolic volume are limited. The effective stroke volume is thus significantly reduced, that is, there is forward failure. In addition, patients are at risk for acute pulmonary edema, rapid development of pulmonary hypertension, and right ventricular failure. For the differential diagnosis it should be noted that an acute ventricular septal rupture or acutely decompensated left ventricular failure can also lead to a markedly increased v-wave.
Chronic mitral regurgitation. In chronic mitral regurgitation the increased distensibility of the dilated left atrium and of the pulmonary veins attenuates the pressure rise in the pulmonary circulation. Despite relatively large regurgitant volumes, both the atrial mean pressure and the v-wave are frequently normal or only slightly increased. Therefore, no conclusions regarding the severity of a chronic mitral regurgitation can be drawn from the height of a v-wave.
In contrast to acute mitral regurgitation, left ventricular end-diastolic volume (LVEDV) is in most cases markedly increased. In compensated mitral regurgitation the effective stroke volume is in the normal range, whereas in decompensated mitral regurgitation with further left ventricular dilatation both the ejection fraction and the effective stroke volume are decreased.
 Indications
Acute Mitral Regurgitation
Cardiac catheterization is indicated for assessing acute mitral regurgitation primarily when noninvasive methods are not possible or not sufficient. The following frequent causes of acute mitral regurgitation can be differentiated:
 Chordae rupture in mitral valve prolapse
 Papillary muscle dysfunction or papillary muscle rupture after myocardial infarction
 Infectious endocarditis with destruction of the leaflet and chordae rupture
 Prosthesis dysfunction or paravalvular leak post valve replacement surgery
Particularly in the case of ischemic papillary muscle dysfunction, cardiac catheterization with coronary angiography to assess left ventricular function and coronary status are mandatory.
The other causes can usually be diagnosed with transthoracic and transesophageal echocardiography, and, if the findings are conclusive, the indication for cardiac catheterization can be made depending on the presence of concomitant valvular defects and the age of the patient.
Chronic Mitral Regurgitation
For chronic mitral regurgitation, cardiac catheterization is indicated in the following cases:
 In symptomatic patients when more severe mitral regurgitation is suspected
 In asymptomatic patients with more severe mitral regurgitation before planned surgical replacement or reconstruction of the mitral valve
 In mitral regurgitation with reduced left ventricular function to clarify the cause (primary versus secondary valve disease, functional mitral regurgitation in coronary artery disease, or dilated cardiomyopathy)
 In patients with concomitant mitral stenosis or additional aortic valve disease
 If assessment of the severity of the regurgitation or of left ventricular function is insufficient with noninvasive methods
 Presurgical coronary angiography if age > 40 years and coronary risk factors
Cardiac catheterization is not indicated in asymptomatic patients or in mild to moderate mitral regurgitation by echocardiography.
 Goals
Goals
 Determination of the hemodynamic severity of the regurgitation (calculation of the regurgitant fraction, classification of severity by angiography)
 Evaluation of ventricular function at rest; measurement of end-systolic and end-diastolic volumes
 Assessment for concomitant valvular defects
 Assessment for concomitant coronary artery disease
 Procedure
 Arterial and venous punctures (4F–6F sheaths)
 Engagement of the left ventricle with the pigtail catheter
 Right heart catheterization with placement of the catheter in the wedge position (balloon catheter)
 Simultaneous pressure recording of pulmonary capillary wedge pressure and left ventricular pressure
 Determination of cardiac output (according to Fick or thermodilution)
 Ventriculography (LAO, lateral 90° projection)
 Calibration and measurement of left ventricular volume (sphere)
 Right heart catheter pullback with pressure recording
 Left heart catheter pullback with pressure recording
 Aortography if required
 Coronary angiography
 Special Characteristics
With mitral regurgitation attention has to be paid to the correct position in midcavity of the pigtail catheter to avoid any artificial influence on the regurgitant jet by extrasystoles or by positioning of the catheter too close to the valve. An enlarged left ventricle and a frequently markedly dilated left atrium require a correspondingly larger amount of contrast administration for left ventriculography. Flow of contrast medium into the left atrium is best visualized in the 90° lateral projection.
 Findings on Cardiac Catheterization
Left Ventriculogram
Besides demonstrating regurgitation as a systolic backflow of contrast into the left atrium, the left ventriculogram can provide additional information regarding the cause of mitral regurgitation.
 Frequently the systolic prolapse of the posterior mitral valve leaflet into the left atrium with mitral valve prolapse can be identified in the RAO projection.
 With a broad-based regurgitant jet and calcified mitral valve annulus, a rheumatic etiology of the regurgitation is likely.
 With ischemia-induced papillary muscle syndrome in coronary artery disease, abnormal contraction can be seen in the area of a papillary muscle (mostly akinesis or dyskinesis) with an eccentric regurgitation jet.
 An anteriorly directed regurgitation jet points to dysfunction of the posterior leaflets; a posteriorly directed jet indicates dysfunction of the anterior leaflet (90° lateral projection).
 Functional mitral regurgitation is most likely present if the left ventricle is severely dilated and its contractility is globally impaired; usually, regurgitation is mild to moderate according to angiographic criteria. Frequently the ventricular shape is spherical, which is associated with lateral displacement of the papillary muscles.
 Back flow into the pulmonary veins is a sign of severe mitral regurgitation.
Pressure
With more severe mitral regurgitation, the left ventricular pressure tracing has an early systolic peak with premature pressure decrease in late systole. The ejection phase is shortened.
The left atrial pressure and correspondingly the pulmonary capillary wedge pressure show a normal a-wave. After the c-wave, often without x-descent, there is during systole a giant v-wave, which very rapidly reaches the early diastolic pressure minimum y (Fig. 14.5).
A v-wave is considered increased if its peak pressure is at least twice the mean pressure in the left atrium or in the pulmonary capillary wedge position. As already mentioned, the height of the v-wave does not correlate with the severity of the regurgitation, as the distensibility of the left atrium and pulmonary veins as well as the systemic vascular resistance strongly affect the height of the v-wave. In addition, there can be other causes for an increased v-wave. With severe mitral regurgitation and drug-induced decrease in left ventricular afterload (e.g., with nitrates) the height of the v-wave will be smaller than without therapy (Fig. 14.6). In some cases the v-wave can be made to disappear by afterload reduction or, conversely, can be augmented by increasing afterload. Nevertheless, a significant mitral regurgitation without any v-wave increase would be unusual.
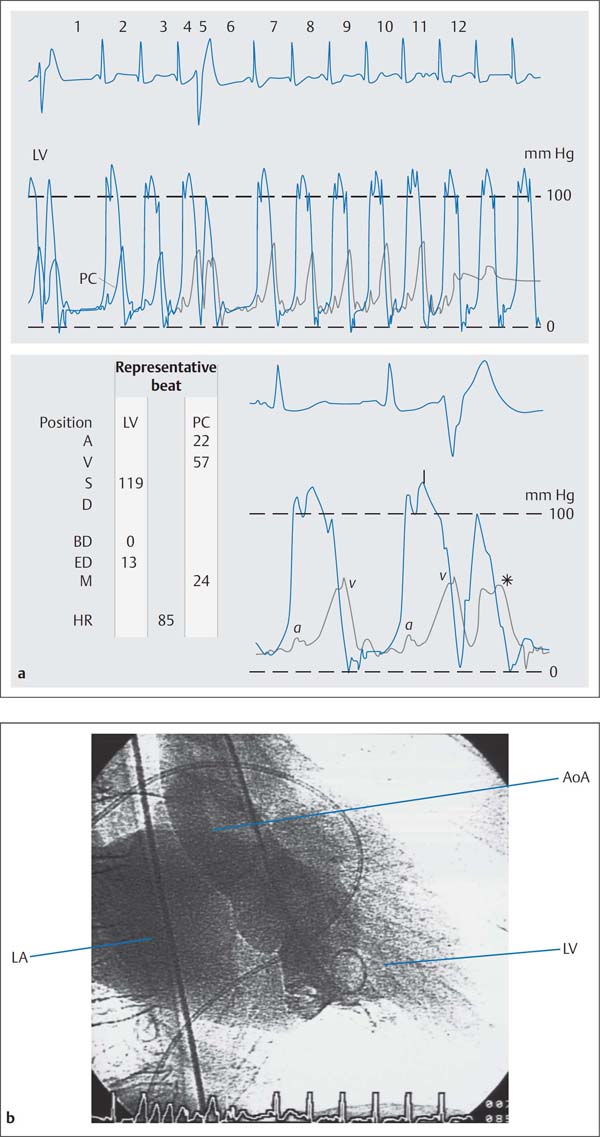
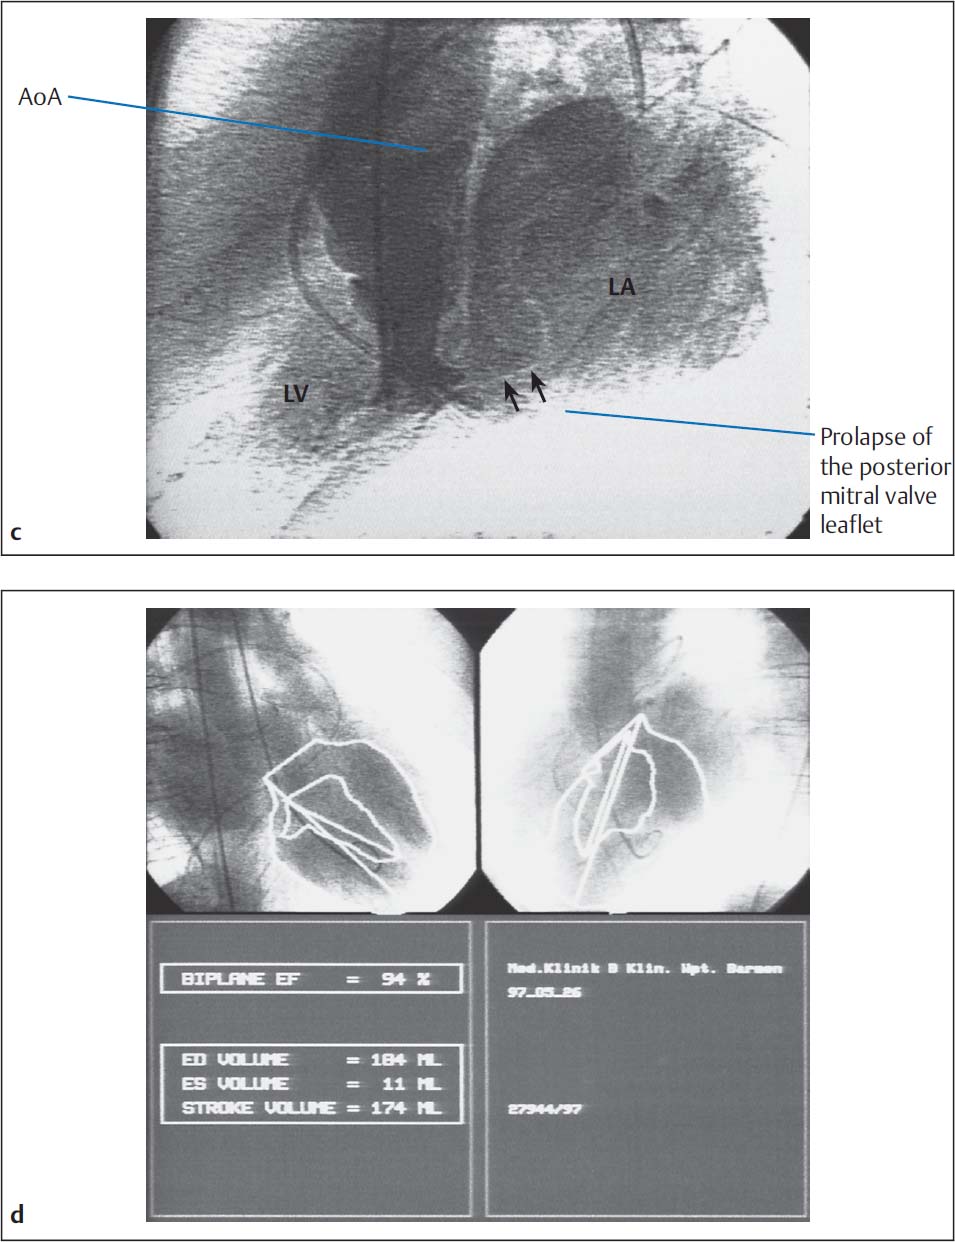
Fig. 14.5 a–c Hemodynamics in severe mitral regurgitation (57-year-old woman with partial rupture of the posterior mitral valve leaflet).
Hemodynamics | |
Aorta: | 121/67 mm Hg |
LVEDP: | 13 mm Hg |
PCW mean: | 24 mm Hg |
v-wave: | 57 mm Hg |
PA: | 52/22 (33) mm Hg |
RV: | 45/1–5mm Hg |
RA mean: | 6 mm Hg |
CO: | 5.2 L/min |
Stroke volume (SV) according to Fick: | 61 mL |
Angiographic SV: | 174 mL |
End-diastolic volume: | 184 mL |
Regurgitant fraction: | (174−61)/174 = 65 % (MI grade IV) |
a Simultaneous pressure recording LV-PCW, ventricularization of the PCW tracing with extrasystoles (*).
A | a-wave |
V | v-wave |
S | systolic pressure |
D | diastolic pressure |
BD | early diastolic pressure |
ED | end-diastolic pressure |
M | mean pressure |
HR | heart rate |
b Left ventriculogram with intense opacification of the dilated left atrium corresponding to grade IV mitral regurgitation, prolapse of the posterior mitral valve leaflet.
c, d Calculation of ejection fraction and angiographic stroke volume.
Angiographic Quantification of Mitral Regurgitation
The severity of mitral regurgitation is classified either by the qualitative evaluation of the systolic contrast regurgitation into the left atrium during left ventriculography or by calculating the regurgitant volume from the stroke volume obtained by ventriculography and the cardiac output.
Classification of the severity based on the left ventriculogram. The qualitative classification of the severity (Table 14.3) of mitral regurgitation is influenced by several factors, which have to be considered when the findings are interpreted. These include
 Selected contrast medium volume
 Injection rate
 Size of the left atrium
 Extent of left ventricular dilatation
 Heart rate
 Cardiac output
Sources of error. The most frequent sources of error include incorrectly placing the angiography catheter too close to the mitral valve as well as selecting a projection that does not adequately display the left atrium.
Classification of severity according to regurgitant fraction. Left ventricular end-diastolic and end-systolic volumes are determined from the left ventriculogram (prior calibration necessary). The difference gives the total stroke volume:
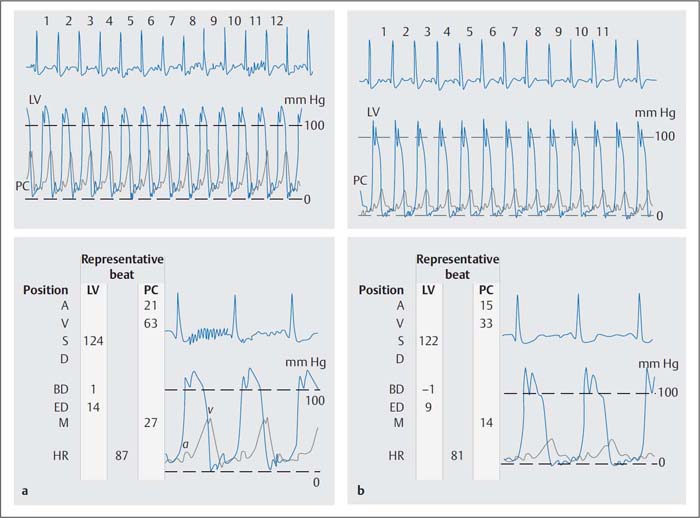
Fig. 14.6 a, b v–Wave before and after administration of 2 mg nitroglycerin IV in severe mitral regurgitation (54-year-old woman, simultaneous pressure recording LV-PCW).
a Before nitroglycerin administration the v-wave is 63 mm Hg and the mean PCW pressure is 27 mm Hg.
b After nitroglycerin administration the v-wave and the mean PCW pressures are reduced by half; however, the criteria for an increased v-wave continue to be fulfilled (v-wave > 2 × mean PCW).
Table 14.3 Classification of the severity of mitral regurgitation by left ventriculography
Severity | Findings on the left ventriculogram |
I | Minimal contrast flow into the left atrium No complete opacification |
II | Complete opacification of the left atrium after several heartbeats Markedly lower contrast opacification in the atrium than in the ventricle |
III | Complete and dense opacification of the left atrium Same contrast density as in left ventricle |
IV | Immediate and complete opacification of the left atrium within 1–2 heartbeats Opacification increases with each heartbeat Opacification is stronger than in the left ventricle Systolic contrast medium flow into the pulmonary veins |
Using cardiac output the effective stroke volume is calculated:
Regurgitant volume = Total stroke volume – Effective stroke volume
Classification according to regurgitant fraction is also into four degrees of severity:
Severity I: < 20 %
Stay updated, free articles. Join our Telegram channel

Full access? Get Clinical Tree


