Previous methods to quantify dyssynchrony could not determine regional 3-dimensional (3-D) strain. We hypothesized that a novel 3-D speckle tracking strain imaging system can quantify left ventricular (LV) dyssynchrony and site of latest mechanical activation. We studied 64 subjects; 54 patients with heart failure were referred for cardiac resynchronization therapy (CRT) with an ejection fraction 25 ± 6% and QRS interval 165 ± 29 ms and 10 healthy volunteer controls. The 3-D speckle tracking system determined radial strain using a 16-segment model from a pyramidal 3-D dataset. Dyssynchrony was quantified as maximal opposing wall delay and SD in time to peak strain. The 3-D analysis was compared to standard 2-dimensional (2-D) strain datasets and site of 3-D latest mechanical activation, not possible by 2D was quantified. As expected, dyssynchrony in patients on CRT was significantly greater than in controls (maximal opposing wall delay 316 ± 112 vs 59 ± 12 ms and SD 124 ± 48 vs 28 ± 11 ms, p <0.001 vs normal). The 3-D opposing wall delay was closely correlated with 3-D 16-segment SD (r = 0.95) and 2-D mid-LV strain (r = 0.83) and SD (r = 0.85, all p values <0.001). The 3-D site of the latest mechanical activation was most commonly midposterior (26%), basal posterior (22%), midlateral (20%), and basal lateral (17%). Eleven patients studied after CRT demonstrated improvements in 3-D synchrony (300 ± 124 to 94 ± 37 ms) and ejection fraction (24 ± 6% to 31 ± 7%, p <0.05). In conclusion, 3-D speckle tracking can successfully quantify 3-D dyssynchrony and site the latest mechanical activation. This approach may play a clinical role in management of patients on CRT.
Cardiac resynchronization therapy (CRT) has had a major impact on improving symptoms and survival in patients with heart failure (HF). A large body of data has demonstrated that abnormalities of left ventricular (LV) mechanical timing, known as dyssynchrony, impairs ejection efficiency and is improved with CRT. Existing echocardiographic methods to quantify dyssynchrony, such as tissue Doppler, have been shown to have technical limitations that preclude their routine use for patient selection for CRT. Accordingly, there is a desire for technologic improvements in means to quantify LV dyssynchrony. Speckle tracking echocardiography has emerged as a promising method to assess mechanical dyssynchrony because it may measure strain as active wall thickening, unlike M-mode or tissue Doppler velocity, which cannot differentiate from passive movement. However, speckle tracking has been limited to 2-dimensional (2-D) tomographic imaging planes, which may oversimplify the complexities of LV dyssynchrony in individual patients. A newly developed 3-dimensional (3-D) speckle tracking system can quantify LV strain using complete 3-D pyramidal datasets. The objective of the present study was to test the hypothesis that this novel echocardiographic system can qualify 3-D dyssynchrony, map the 3-D site of latest activation, which is not possible by 2-D, and determine improvements in 3-D synchrony after CRT.
Methods
The study group consisted of 67 subjects, 57 patients with HF referred for CRT and 10 healthy volunteers as normal controls. This protocol was approved by the institutional review board on biomedical research and all subjects gave informed consent consistent with this protocol. The study group consisted of 54 patients with HF after 3 (5%) were excluded from analysis because of poor echocardiographic windows. All patients had HF functional class III, with an ejection fraction (EF) ≤35% and QRS duration ≥120 ms. Details of patient demographic data are presented in Table 1 . Twenty-seven patients (50%) had ischemic cardiomyopathy; none had atrial fibrillation. The control group consisted of 10 volunteers 35 ± 5 years of age with no history of cardiovascular disease and completely normal electrocardiograms and 2-D and Doppler echocardiograms (QRS duration 88 ± 6 ms and EF 61 ± 4%).
| Baseline Variable | Patients With HF (n = 54) |
|---|---|
| Age (years) | 68 ± 11 |
| Men/women | 32/13 |
| QRS duration (ms) | 165 ± 29 |
| Coronary disease | 27 (50%) |
| Ejection fraction (%) | 25 ± 6 |
| Radial dyssynchrony by 2-dimensional speckle tracking (ms) | 230 ± 101 |
| Radial dyssynchrony by 3-dimensional speckle tracking (ms) | |
| Maximal opposing wall delay | 316 ± 112 |
| Standard deviation | 124 ± 48 |
All echocardiographic studies were performed with a commercially available echocardiographic system (Aplio Artida, Toshiba Medical Systems Corp., Tokyo, Japan). Digital routine gray-scale 2-D cine loops from 3 consecutive beats were obtained at end-expiratory apnea using a matrix array transducer (PST-25SX, Toshiba Medical Systems Corp., Tokyo, Japan) from standard apical and mid-LV short-axis views at depths of 11 to 20 cm (mean 16 ± 2). Frame rates were 44 to 90 Hz (mean 61 ± 14) for gray-scale imaging used for speckle tracking. Sector width was optimized to allow for complete myocardial visualization and maximize frame rate. Gain settings were adjusted for routine gray-scale imaging to optimize endocardial definition. LV volumes and EF were assessed by biplane Simpson rule using manual tracing of digital images.
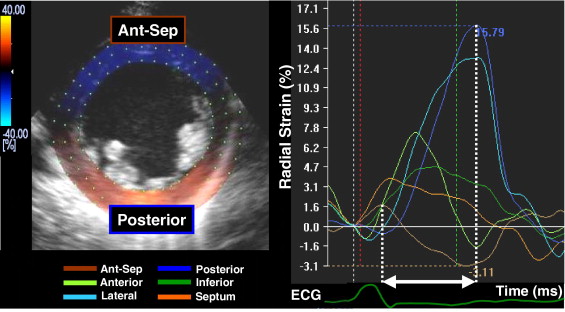
Routine B-mode gray-scale images were analyzed for frame-by-frame movement of stable patterns of natural acoustic markers, or speckles, present in ultrasound tissue images over the cardiac cycle, as described previously in detail. Briefly, the mid-LV short-axis plane was used ( Figure 1 ). A circular region of interest was traced counterclockwise on the endocardium starting from the 9 o’clock position at end-systole (minimum cavity area) using a point-and-click approach. A second larger concentric circle was then automatically generated and manually adjusted near the epicardium. The software automatically divided the short-axis image into 6 segments and generated corresponding time-strain curves from each segment. The region of interest was fine-tuned by visual assessment during the cine-loop play feature to ensure that all segments were tracked throughout the cardiac cycle. Often, the regions of interest were placed slightly wider than the LV wall to obtain the highest-quality time-strain curves. The 2-D speckle tracking radial dyssynchrony was defined as a time difference between the anteroseptal and posterior wall segmental peak strains.

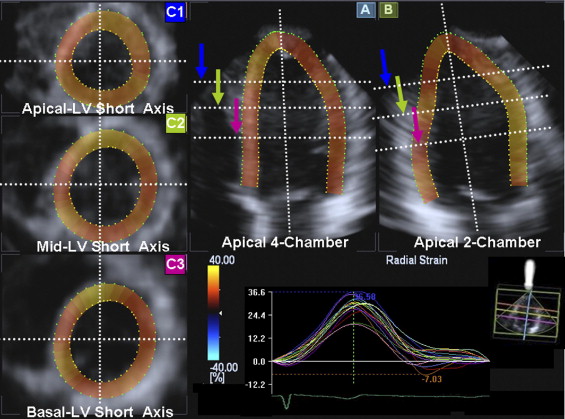
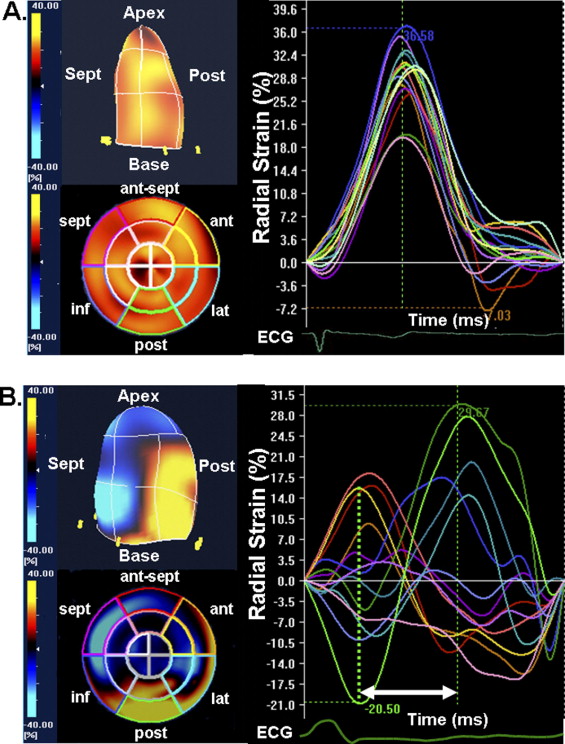
The 3-D speckle tracking system used a pyramidal volume from a matrix array transducer. Acquisition of a full-volume dataset required 4 smaller wedge-shaped subvolumes from 4 consecutive cardiac cycles during a breath hold that were combined to provide the larger pyramidal volume. Data were acquired from the apical window at depths of 15 to 18 cm during breath hold and a relatively stable RR interval to minimize translation artifacts among the 4 acquired subvolumes. Gain settings were adjusted to optimize endocardial and epicardial definitions. The wide sector width (mean 88 ± 5° × 88 ± 5°) was used to include the entire LV volume. The 3-D datasets were displayed in 5 different cross-sections that could be modified interactively ( Figure 2 ). Tomographic planes were the apical 4-chamber view, apical 2-chamber view, and the 3 standard short-axis views. Using this convention, maximal long-axis dimensions were adjusted to obtain the true apex. First, the orientation of the long-axis of the 4- and 2-chamber views was determined by positioning the main axis line to pass near the center of the LV cavity. Then, the 3 standard short-axis planes were defined by positioning the lines in the 2 apical views at each level perpendicular to the long axis of the left ventricle. A region of interest was traced in a counterclockwise direction on the endocardium starting from the right-hand mitral annulus at end-diastole (maximum cavity area) in the 2 apical views using a point-and-click approach with special care taken to adjust tracking of all endocardial segments. A second larger region of interest was then automatically generated and manually adjusted near the epicardium in the 2 apical views. The software automatically divided the left ventricle into 16 standard segments based on the recommendation of the American Society of Echocardiography and generated corresponding time-strain curves from each segment ( Figure 3 ). The region of interest was fine-tuned by visual assessment during the cine-loop play feature to ensure that all wall regions were included throughout the cardiac cycle. The 3-D speckle tracking radial dyssynchrony was quantified from mechanical activation mapped from all 16 sites as maximal opposing wall delay in time to peak strain and SD of time to peak strain. The 3-D movies of regional strain were generated with color coding of strain. Thickening or positive radial strain was color coded as orange-yellow, and thinning or negative radial strain was color coded as blue. The 3-D LV displays and polar maps or bull’s-eye plots were generated.


All group data were presented as mean ± SD and compared with 2-tailed Student’s t test for paired and unpaired data, respectively. Correlation analysis was performed using linear regression and expressed as a Pearson correlation coefficient. Statistical significance was a p value <0.05.
Results
Overall, 3-D speckle tracking radial dyssynchrony analysis was possible in 963 of 1,024 attempted segments (94%) from the 64 subjects with overall technically adequate images. The total time for 3-D speckle tracking dyssynchrony analysis was approximately 4 to 7 minutes per patient. As expected, 3-D speckle tracking dyssynchrony in patients with HF was significantly greater than that in controls (maximal opposing wall delay 316 ± 112 vs 59 ± 12 ms and SD 124 ± 48 vs 28 ± 11 ms, p <0.001 vs controls). The 3-D opposing wall delay was closely correlated with 3-D 16-segment SD (r = 0.95, p <0.001; Figure 4 ). Mid-LV 2-D dyssynchrony was also significantly correlated with 3-D–derived speckle tracking radial dyssynchrony indexes: anteroseptal to posterior wall delay by 2-D speckle tracking radial strain versus maximal opposing wall delay by 3-D speckle tracking radial strain (r = 0.83, p <0.001; Figure 4 ) and anteroseptal to posterior wall delay by 2-D speckle tracking radial strain versus SD by 3-D speckle tracking radial strain (r = 0.85, p <0.001; Figure 4 ). Inter- and intraobserver variabilities of 3-D speckle tracking radial dyssynchrony were 9 ± 8% and 9 ± 7%.
Using time to peak maximal radial strain, the prevalence of the site of the latest mechanical activation from all 16 sites in all 54 patients was midposterior in 14 (26%), basal posterior in 12 (22%), midlateral in 11 (20%), basal lateral in 9 (17%), midinferior in 4 (7%), basal inferior in 3 (6%), and apical lateral in 1 (2%; Figure 5 ). Overall, 85% of the site of the latest mechanical activation was located in posterior or lateral regions at the mid or basal levels. In the sample of patients studied, the site of latest mechanical activation did not occur in the septum, was rare at the apical level, and uncommon in the inferior wall. The 3-D speckle tracking system was able to characterize the individual patients with a broad site of latest mechanical activation from those with a narrow site.


