The present study assessed the effect of age and co-morbidity on the outcomes of mild, moderate, and severe aortic stenosis (AS) in patients aged >60 years during 18 years of follow-up. The outcomes evaluated were hemodynamic progression, a composite cardiac mortality or aortic valve replacement (AVR) end point, and all-cause mortality. Consecutive Department of Veterans Affairs patients (aged >60 years) with AS were prospectively enrolled from 1988 to 1994 and followed until 2008 (n = 239). The baseline demographic, co-morbidity, and echocardiographic parameters were recorded. At enrollment, the mean age was 74 ± 6 years, and 78% were men. The annualized mean aortic valve gradient progression was 4 ± 4, 6 ± 5, and 10 ± 8 mm Hg for mild, moderate, and severe AS, respectively (p <0.001). During a mean follow-up of 8 ± 5 years, 206 deaths (52% cardiac) and 91 AVRs were recorded. The AVR/cardiac mortality event rate at 1, 5, and 10 years was 2%, 26%, and 50% for mild AS, 13%, 63%, and 69% for moderate AS, and 66%, 95%, and 95% for severe AS (p <0.001). During the study period, 132 patients developed severe AS. The survival rate at 1, 5, and 10 years was 60 ± 7%, 14 ± 5%, and 5 ± 3% with conservative management and 98 ± 2%, 82 ± 4%, and 50 ± 5% after AVR, respectively (p <0.001). The independent predictors of all-cause mortality were the age-adjusted Charlson co-morbidity index (hazard ratio 1.24, p <0.001), AVR (hazard ratio 0.40, p <0.001), and grade of left ventricular dysfunction (hazard ratio 1.36, p = 0.01). In conclusion, the prognostic significance of AS is determined by the hemodynamic severity, left ventricular function, and the presence of symptoms, in the context of age and co-morbidities. The age-adjusted Charlson co-morbidity index provides crucial prognostic information to guide the surgical risk/benefit discussions for patients with severe AS.
The primary outcome of the present large, prospective, observational cohort study was to document the natural history of mild, moderate, and severe aortic stenosis (AS) in patients aged >60 years, with regard to hemodynamic progression, the composite cardiac end point of aortic valve replacement (AVR) or cardiac mortality, and all-cause mortality. In addition, we sought to identify the predictors of clinical outcomes, including the Charlson co-morbidity index (CCI), in this cohort.
Methods
Consecutive Department of Veterans Affairs patients (aged >60 years) with AS presenting to a single Australian tertiary university veterans’ hospital from 1988 to 1994 were enrolled in the present study after giving written informed consent. Patients with coexistent severe additional valve disease were excluded. At baseline, the demographics and symptomatic status were recorded and transthoracic echocardiography was performed. The present study complied with the Declaration of Helsinki, and the institutional ethics board approved the study protocol.
Transthoracic echocardiography was performed using commercially available ultrasound systems with the patients in the left lateral decubitus position by experienced sonographers. The measurements and recordings were obtained according to the published recommendations of the American Society of Echocardiography. Standard parasternal views with M-mode echocardiography were used to assess left ventricular hypertrophy and the left atrial dimension. Left ventricular hypertrophy was defined from the LV wall thickness as absent (<1.1 cm), mild (1.1 to 1.3 cm), moderate (1.4 to 1.6 cm), or severe (≥1.7 cm). Left atrial size was classified as normal (<4 cm), mildly enlarged (4.0 to 4.9 cm), moderately enlarged (5.0 to 5.9 cm), or severely enlarged (≥6.0 cm). LV systolic function was defined semiquantitatively as normal function (LV ejection fraction ≥50%), mild dysfunction (LV ejection fraction 40% to 49%), moderate dysfunction (LV ejection fraction 30% to 39%), or severe dysfunction (LV ejection fraction <30%). Pulsed-wave and continuous-wave Doppler ultrasonography were used to record the velocities through the LV outflow tract and aortic valve, respectively. The aortic valve was examined from multiple windows, including apical, suprasternal, and right parasternal to obtain the peak aortic valve gradient (AVG) and mean AVG. The aortic valve area was calculated using the continuity equation. For analysis, the patients were grouped according to their baseline AS severity, which was retrospectively classified according to the current American Heart Association/American College of Cardiology guidelines : mild (aortic valve area >1.5 cm 2 or mean AVG <25 mm Hg), moderate (aortic valve area 1.0 to 1.5 cm 2 or mean AVG 25 to 40 mm Hg), or severe AS (aortic valve area <1.0 cm 2 or mean AVG >40 mm Hg). Additional subanalysis was performed on the cohort of patients diagnosed with severe AS during the follow-up period.
Comprehensive baseline co-morbidity data were retrospectively collated by way of hospital record review for calculation of the CCI and the logistic European System for Cardiac Operative Risk Evaluation (euroSCORE). The diseases recorded for calculation of the CCI and their corresponding point values were myocardial infarction (1), congestive heart failure (1), cerebrovascular disease with mild or no residual deficit (1), chronic lung disease (1), peripheral vascular disease (1), peptic ulcer disease (1), diabetes mellitus without end organ damage (1), dementia (1), connective tissue disease (1), mild liver disease (1), hemiplegia (2), diabetes mellitus with organ damage (2), moderate or severe chronic renal impairment (2), solid organ malignancy (2), leukemia (2), lymphoma (2), moderate or severe chronic liver disease (3), metastatic solid organ malignancy (6), and acquired immunodeficiency syndrome (6). The CCI was calculated with and without adjustment for age (1 point per decade >40 years). Age-adjusted CCI (age-CCI) tertiles were used to define the groups with low (age-CCI ≤5), intermediate (age-CCI 6 to 7), and high (age-CCI ≥8) risk profiles. In addition, the presence of significant coronary artery disease (>50% stenosis on coronary angiography), atrial fibrillation, anemia (hemoglobin <13 g/dl for men or <12 g/dl for women), and a physician diagnosis of hypertension were recorded.
The patients were prospectively followed up until June 2008 by way of attendance for medical review and/or telephone interview of the patient, their relatives, or physician. The frequency of clinical review and echocardiography was determined by the managing physician. In general, the minimum follow-up frequency was every 3 to 5 years for mild AS, 1 to 2 years for moderate AS, and every 6 to 12 months for severe AS. The data recorded included the development of AS-related symptoms (exertional chest pain, dyspnea, or syncope without an alternate explanation), hemodynamic progression, and the occurrence of AVR and death. The cases of the candidates for AVR were discussed at a multidisciplinary meeting involving cardiologists and cardiac surgeons with the patient’s symptoms, AS severity, and co-morbidities taken into account before recommendations for treatment were made. An Australian Institute of Health and Welfare National Death Index inquiry was conducted to confirm the date and cause of death. Deaths were classified as cardiac or noncardiac. The survival data for the AS cohort were compared to the age- and gender-matched Australian population survival data (referent group) sourced from the Australian Institute of Health and Welfare. The referent population survival was reassessed at 5-year intervals to account for the aging study population.
Statistical analysis was performed using the Statistical Package for Social Sciences, version 17 (SPSS, Chicago, Illinois). Data are reported as the mean ± SD.
The comparison between groups was done using the independent samples t test or analysis of variance for parametric variables. Categorical variables were compared by chi-square analysis and are presented as numbers (percentages). Multivariate Cox proportional hazards analysis with forward stepwise selection was performed using significant (p <0.05), clinically relevant predictors from the univariate analysis to identify the independent predictors of all-cause mortality. Multivariate logistic regression analysis was performed to identify independent predictors of the AVR/cardiac mortality end point. In patients who developed severe AS during the study period, receiver operating characteristic curve analysis was performed to compare the prognostic utility of the age-CCI and logistic euroSCORE for all-cause mortality at 1 and 5 years. Kaplan-Meier curves were constructed to depict survival between the groups, and the log-rank test was used to compare the survival curves. Survival was defined as the mean ± SE. Two-tailed p values <0.05 were considered statistically significant.
Results
A total of 239 patients were enrolled in the present study, and the follow-up duration was 8.1 ± 5.4 years (range 0 to 18). The age at enrollment was 74 ± 6 years, and 78% of the patients were men. No patients were lost to follow-up. The baseline characteristics according to AS severity class are listed in Table 1 . During the follow-up period, the AVR/cardiac mortality outcome was recorded in 167 patients (70%) and included 91 AVRs (age at AVR 74 ± 9 years). The primary indication for AVR was severe AS with symptoms (n = 87); 4 patients underwent AVR for moderate AS with concomitant coronary artery bypass grafting. The surgical procedures were isolated AVR in 44%, AVR plus coronary artery bypass grafting in 48%, and AVR plus other procedures in 8%. Of the 239 patients, 206 (86%) died, and the cause of death was available for 190 (92%); 52% of the deaths were attributable to cardiac causes. The age at death was 82 ± 6 years.
| Variable | AS Severity | ||
|---|---|---|---|
| Mild (n = 120) | Moderate (n = 55) | Severe (n = 64) | |
| Age (years) | 74 ± 5 | 74 ± 6. | 75 ± 6 |
| Men | 99 (82%) | 44 (74%) | 47 (73%) |
| Charlson co-morbidity index | 4 ± 2 | 4 ± 3 | 4 ± 2 |
| Age-adjusted Charlson co-morbidity index | 7 ± 2 | 7 ± 3 | 7 ± 2 |
| Charlson co-morbidity index conditions | |||
| Myocardial infarction | 49 (41%) | 18 (33%) | 28 (44%) |
| Congestive heart failure | 37 (31%) | 24 (44%) | 31 (48%) ⁎ |
| Cerebrovascular disease | 29 (24%) | 11 (20%) | 14 (22%) |
| Hemiplegia | 5 (4%) | 2 (4%) | 0 (0%) |
| Chronic lung disease | 32 (24%) | 22 (40%) | 13 (20%) ⁎ |
| Peripheral vascular disease | 22 (18%) | 13 (24%) | 7 (11%) |
| Peptic ulcer disease | 28 (23%) | 16 (29%) | 20 (31%) |
| Diabetes mellitus | 23 (19%) | 5 (9%) | 9 (14%) |
| Diabetes mellitus with organ damage | 18 (15%) | 4 (7%) | 8 (12%) |
| Chronic renal impairment (moderate or greater) | 53 (44%) | 22 (40%) | 29 (45%) |
| Chronic liver disease | 1 (1%) | 2 (4%) | 0 (0%) |
| Solid organ malignancy | 15 (12%) | 11 (20%) | 10 (16%) |
| Metastatic malignancy | 3 (2%) | 3 (5%) | 0 (0%) |
| Leukemia or lymphoma | 4 (3%) | 1 (2%) | 3 (5%) |
| Connective tissue disease | 3 (2%) | 3 (5%) | 3 (5%) |
| Dementia | 1 (1%) | 2 (4%) | 4 (6%) ⁎ |
| Acquired immunodeficiency disorder | 0 (0%) | 0 (0%) | 0 (0%) |
| Other co-morbidities | |||
| Coronary artery disease (>50% stenosis) | 66 (55%) | 34 (62%) | 34 (53%) |
| Anemia (hemoglobin, men <13 g/dl; women <12 g/dl) | 34 (28%) | 17 (31%) | 18 (28%) |
| Atrial fibrillation | 30 (25%) | 14 (25%) | 14 (22%) |
| History of hypertension | 89 (74%) | 34 (62%) | 40 (62%) |
| Baseline echocardiographic parameters | |||
| Mean aortic valve gradient (mm Hg) | 15 ± 4 | 28 ± 7 | 54 ± 20 † |
| Peak aortic valve gradient (mm Hg) | 26 ± 7 | 47 ± 11 | 90 ± 33 † |
| Aortic valve area (cm 2 ) | 1.7 ± 0.3 | 1.1 ± 0.2 | 0.8 ± 0.2 † |
| Left ventricular dysfunction (ejection fraction <50%) | 9 (7%) | 16 (29%) | 14 (22%) ‡ |
| Left ventricular hypertrophy (wall thickness ≥1.1 cm 2 ) | 51 (42%) | 26 (47%) | 44 (69%) ‡ |
| Left atrial enlargement (diameter ≥4.0 cm) | 40 (33%) | 25 (45%) | 27 (42%) ⁎ |
Of the 239 patients, 120 had mild AS at enrollment. The annualized rate of change in the mean AVG was 4 ± 4 mm Hg. Progression to severe AS occurred in 38 patients (32%), 32 patients developed AS-related symptoms (27%), and 26 patients underwent AVR (22%). The AVR/cardiac mortality event rate at 1, 5, and 10 years was 2%, 26%, and 50%, respectively. With conservative management, the survival rate at 1, 5, and 10 years was 93 ± 3%, 57 ± 5%, and 30 ± 5%, respectively ( Figure 1 ). Overall, death was from cardiac causes in 52% of the cases.
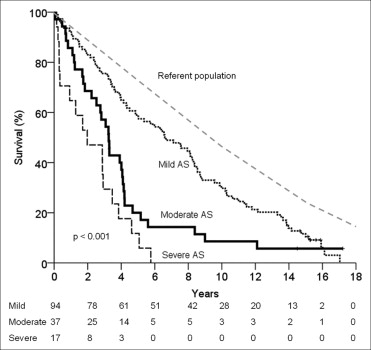
A total of 55 patients had moderate AS at enrollment. The annualized rate of change in the mean AVG was 6 ± 5 mm Hg. Progression to severe AS occurred in 30 patients (55%), 26 patients developed AS-related symptoms (47%), and 18 underwent AVR (33%). The AVR/cardiac mortality event rate at 1, 5, and 10 years was 13%, 63%, and 69%, respectively. With conservative management, the survival rate at 1, 5, and 10 years was 84 ± 6%, 20 ± 7%, and 8 ± 5%, respectively ( Figure 1 ). Overall, death was from cardiac causes in 52% of the cases.
A total of 64 patients had severe AS at enrollment. The annualized rate of change in the mean AVG was 10 ± 8 mm Hg (p <0.001 compared to mild and moderate AS). The AVR/cardiac mortality event rate at 1, 5, and 10 years was 66%, 95%, and 95% respectively. With conservative management, the survival rate at 1, 5, and 10 years was 65 ± 12%, 6 ± 6%, and 0%, respectively ( Figure 1 ). Overall, death was from cardiac causes in 53% of the cases.
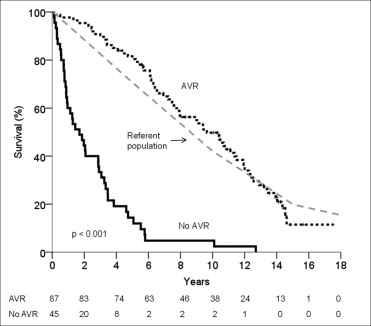
During the study period, 132 patients were diagnosed with severe AS. These patients were aged 76 ± 6 years at the diagnosis of severe AS, and 78% were men, with an age-CCI of 7 ± 2 and a logistic euroSCORE of 12 ± 9%. AS-related symptoms developed in 112 patients (85%), and 87 patients underwent AVR (66%). A total of 45 patients did not undergo AVR during the study period. The major reasons for nonoperation included significant medical co-morbidity (47%), a lack of significant symptoms (36%), advanced age (13%), LV dysfunction (9%), and patient wishes (4%); 3 patients died while awaiting surgery (>1 reason was given for some patients). Patients treated conservatively were older (79 ± 6 years vs 74 ± 5 years, p <0.001) and had more significant co-morbidities (age-CCI, 9 ± 2 vs 7 ± 2, p <0.001; and logistic euroSCORE, 16 ± 11% vs 10 ± 7%, p = 0.001). No significant difference was found between the parameters of AS severity (mean AVG, p = 0.27, and aortic valve area, p = 0.61).
With conservative management of severe AS, the 1-, 3-, 5-, and 10-year survival rate was 60 ± 7%, 33 ± 7%, 14 ± 5%, and 5 ± 3%, respectively. In contrast, the survival rate after AVR at 1, 3, 5, and 10 years was 98 ± 2%, 90 ± 3%, 82 ± 4%, and 50 ± 5%, respectively (p <0.001; Figure 2 ). The perioperative mortality rate was 1%, and the operation type (AVR or AVR plus coronary artery bypass grafting) did not affect long-term survival (p = 0.42). Cardiac mortality was significantly reduced by AVR (AVR 26%, conservative 67%, p <0.001). In the conservative management subgroup, the presence of AS-related symptoms conferred a sevenfold increase in the likelihood of cardiac mortality (odds ratio 7.7, 95% confidence interval 1.5 to 40.0, p = 0.016).
The univariate and multivariate models for prediction of the composite AVR/cardiac mortality end point are listed in Table 2 . With multivariate analysis, the independent baseline predictors of AVR/cardiac mortality were symptoms at enrollment and cardiac failure, with a trend shown for AS severity. The AVR/cardiac mortality outcome was less likely in patients with solid organ malignancy or diabetes mellitus.
| Variable | OR | 95% CI | p Value |
|---|---|---|---|
| Univariate predictors | |||
| Age (per decade) | 1.04 | 0.67–1.62 | 0.85 |
| Male gender | 1.59 | 0.82–3.09 | 0.17 |
| Charlson co-morbidity index ⁎ | 0.91 | 0.80–1.03 | 0.14 |
| Age-adjusted Charlson co-morbidity index ⁎ | 0.93 | 0.83–1.05 | 0.22 |
| Symptoms at enrollment | 29.6 | 4.0–219.3 | 0.001 |
| Cardiac failure | 2.03 | 1.09–3.81 | 0.03 |
| Chronic renal impairment (moderate or greater) | 0.76 | 0.43–1.36 | 0.36 |
| Anemia | 0.59 | 0.32–1.09 | 0.09 |
| Peptic ulcer disease | 0.94 | 0.49–1.79 | 0.85 |
| Malignancy | 0.43 | 0.20–0.93 | 0.03 |
| Peripheral vascular disease | 1.09 | 0.51–2.34 | 0.82 |
| Dementia | 1.54 | 0.17–14.1 | 0.70 |
| Atrial fibrillation | 1.20 | 0.60–2.38 | 0.61 |
| Cerebrovascular disease | 0.82 | 0.42–1.61 | 0.57 |
| Diabetes mellitus | 0.41 | 0.19–0.85 | 0.02 |
| Chronic lung disease | 0.66 | 0.35–1.23 | 0.19 |
| Hypertension | 1.44 | 0.78–2.67 | 0.24 |
| Myocardial infarction | 1.51 | 0.82–2.77 | 0.18 |
| Coronary artery disease | 1.55 | 0.86–2.78 | 0.14 |
| Previous cardiac surgery | 1.20 | 0.66–2.17 | 0.54 |
| Aortic stenosis severity † | 2.57 | 1.69–3.93 | <0.001 |
| Mean aortic valve gradient (per 10 mm Hg) | 1.72 | 1.33–2.22 | <0.001 |
| Aortic valve area (per 0.25 cm 2 ) | 0.68 | 0.53–0.86 | 0.001 |
| Left ventricular hypertrophy † | 2.61 | 1.29–5.29 | 0.01 |
| Left ventricular dysfunction † | 1.58 | 0.92–2.73 | 0.10 |
| Left atrial enlargement † | 1.35 | 0.87–2.12 | 0.18 |
| Multivariate predictors | |||
| Symptoms at enrollment | 14.7 | 1.77–121.9 | 0.01 |
| Malignancy | 0.29 | 0.11–0.72 | 0.01 |
| Diabetes mellitus | 0.39 | 0.17–0.91 | 0.03 |
| Cardiac failure | 2.18 | 1.08–4.38 | 0.03 |
| Aortic stenosis severity † | 1.65 | 0.98–2.78 | 0.06 |
The univariate and multivariate models for the prediction of all-cause mortality are listed in Table 3 . Two separate multivariate analyses were performed. Model 1 included age-CCI and model 2 assessed individual factors. In model 1, the independent predictors of all-cause mortality were age-CCI, AVR, a history of anemia, LV dysfunction, and left atrial enlargement. In model 2, the independent predictors of all-cause mortality were age, AVR, LV dysfunction, left atrial enlargement, a history of anemia, and congestive cardiac failure.


