Low levels of statin adherence may compromise treatment outcomes. The aim of this study was to investigate whether nurse-led cardiovascular risk-factor counseling could improve statin adherence and lipid levels without increasing patients’ anxiety. Patients with indications for statin therapy for primary or secondary prevention of cardiovascular disease were randomly assigned to receive routine care or extended care (EC) at baseline and at months 3, 9, and 18. Patients in the EC group received a personalized risk-factor passport, showing modifiable and unmodifiable individual risk factors and a graphical presentation of their calculated absolute 10-year cardiovascular disease risk as well as the target risk that could be reached if all modifiable risk factors were optimally treated. Lipid levels were assessed at each visit. Carotid intima-media thickness was measured at baseline and at month 18. Adherence, anxiety, quality of life, symptoms, and smoking status were assessed using a self-administered questionnaire at each visit. A total of 201 patients were included in the study. Statin adherence was significantly higher (p <0.01) and anxiety was significantly lower (p <0.01) in the EC group than in the routine care group. Low-density lipoprotein cholesterol was statistically significantly lower in the EC group than in the routine group (2.66 vs 3.00 mmol/L, respectively, p = 0.024) in primary prevention patients only. Intima-media thickness improved significantly from baseline (p <0.01) in all patients, irrespective of group assignment. In conclusion, cardiovascular risk-factor counseling resulted in improved lipid profiles in primary prevention patients and higher levels of adherence to statins and lower levels of anxiety in all patients.
The objective of the present study was to investigate if nurse-led multifactorial cardiovascular risk-factor counseling would improve adherence to lipid-lowering medication and lipid levels without increasing patients’ anxiety compared to routine care (RC). We also investigated whether such an intervention would result in a lower body mass index; lower blood pressure; improved intima-media thickness (IMT) and flow-mediated dilatation (FMD); better quality of life (QoL), symptom scores, and beliefs about medication; changed risk perception; and more smoking cessation compared with RC.
Methods
Patients (aged >18 years) with indications for statin use (primary or secondary prevention of cardiovascular events) were consecutively selected from the outpatient clinics of 2 hospitals in Amsterdam, The Netherlands (Academic Medical Center and the Slotervaart Hospital) by their treating physicians and included from May 2002 to May 2004. Patients with severe fasting dyslipidemia (total cholesterol >9.0 mmol/L or triglycerides >4.0 mmol/L) were excluded, as were those with fasting glucose >7.0 mmol/L. In addition, patients who had used statins for >3 months before inclusion, who had histories of drug and/or alcohol abuse, who were pregnant or breast-feeding, or who had life expectancies <2 years were excluded. In case patients had started statin therapy within 3 months, a washout period of 2 weeks was applied. Written informed consent was obtained from each patient, and the institutional review board of the Academic Medical Center approved the study protocol.
After inclusion, patients were randomly assigned to RC or extended care (EC), using a randomization computer program, to obtain an equal distribution of primary and secondary prevention patients, hospital origin, and gender in the 2 groups. All patients visited a study nurse practitioner at the Academic Medical Center in addition to their regular visits to their treating specialists. The baseline visit took place within 3 months after statin treatment had been indicated. Subsequent visits were scheduled after 3, 9, and 18 months. At baseline, all patients completed a self-report questionnaire containing questions about anxiety, QoL, risk perception, and smoking status. Before the subsequent consultations with the study nurse, patients completed the same questionnaire, which then also included questions about adherence to lipid-lowering medication and beliefs about medication. RC consisted of measuring body weight and blood pressure and performing a capillary lipid profile at each visit (Cholestech; Alere Health BV, Tilburg, The Netherlands). Initially, all patients received atorvastatin 10 mg, unless baseline cholesterol levels were severe and more aggressive therapy was needed. Dose escalation during the study period was allowed if deemed appropriate by the treating physician.
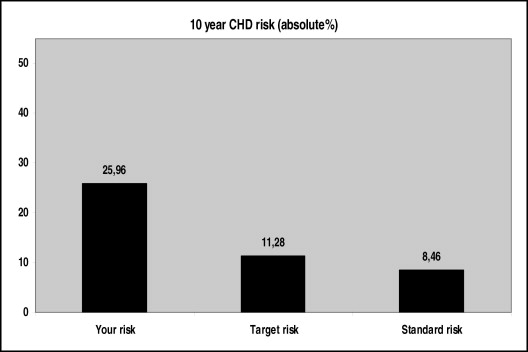
In addition to RC, subjects in the EC group received multifactorial risk-factor counseling, during which the nurse practitioner explained the presence of unmodifiable risk factors, such as age, gender, and family history, and modifiable risk factors, such as lipid levels, diabetes mellitus, blood pressure, overweight, smoking habits, and physical activity. The study nurse was not blinded to the purpose of the study. The counseling focused on changing modifiable risk factors such as increasing medication adherence, reducing overweight, smoking cessation, and increasing physical activity. All obtained data were summarized in a personal risk-factor passport: a graphical presentation of the patient’s calculated 10-year cardiovascular disease risk. It also showed the target risk that could be reached if all the patient’s modifiable risk factors were optimally treated, as well as the standard age- and gender-related risk ( Figure 1 ). Ten-year risk and target risk were calculated using the Framingham risk score. In addition, the risk-factor passport contained the most recent ultrasound image of the patient’s carotid artery, as well as an example of a healthy and an unfavorable image of the carotid artery, which were both explained and discussed by the nurse practitioner. This risk-factor passport was updated during each follow-up visit.
A fasting lipid profile was analyzed from capillary finger-stick whole blood using the Cholestech LDX Lipid Analyzer (Alere Health BV), which measures the following: total cholesterol (range 2.6 to 12.9 mmol/L), triglycerides (range 0.5 to 7.3 mmol/L), and high-density lipoprotein cholesterol (range 0.4 to 2.6 mmol/L) with approximately 35 μL of whole blood in approximately 5 minutes. Low-density lipoprotein (LDL) cholesterol was calculated. Adherence to lipid-lowering medication was measured using 2 validated self-report questions. In the first question, subjects were asked how many days during the past week they took their lipid-lowering medications on a 5-point scale (1 = not 1 day, 5 = all 7 days). In the second question, subjects were asked what percentage of their prescribed lipid-lowering medications they took during the past month (1 = <30%, 9 = 100%). Anxiety was assessed using the Hospital Anxiety and Depression Scale. Higher scores indicate higher levels of anxiety. At all visits, participants were weighed on an electronic scale (Seca, Hamburg, Germany), and their standing height was measured. Body mass index was calculated as body weight in kilograms divided by the square of height in centimeters. Two separated sitting blood pressures were measured after ≥5 minutes of rest and ≥1 minute apart and averaged.
Carotid IMT and FMD were measured at baseline and at month 18 as previously published. B-mode ultrasound IMT measurements were performed in the far walls of the carotid arteries. The mean of 3 measurements was used to calculate IMT. FMD was determined in terms of the percentage change in diameter relative to the baseline measurement. Baseline vessel diameter was calculated as the average of the 3 baseline measurements. Each of the imaging operations was performed by a single highly skilled sonographer.
QoL was measured using the Medical Outcomes Study Short-Form 12-Item Health Survey. Two subscale scores can be obtained, a physical health score and a mental health score. Higher scores indicate better physical and mental health. Symptoms related to the use of lipid-lowering medication were assessed using a symptom checklist containing 20 items that were derived from the item bank of the European Organisation for Research and Treatment of Cancer QoL group. The checklist includes the most frequently occurring side effects observed by statin users (i.e., stomachache, headache, and muscle ache). The presence of a symptom during the past 4 weeks was scored on a 4-point scale (1 = not at all, 4 = very much). We calculated a summary score, with higher scores indicating more symptomatology. Beliefs about lipid-lowering medication were assessed using the Beliefs About Medication Questionnaire, which comprises a necessity scale and a concern scale. The necessity scale measures subjects’ perceived necessity of treatment with lipid-lowering medication. The concern scale measures subjects’ concerns about potential adverse effects of lipid-lowering medication. Higher scores indicate higher perceived necessity and more concerns. Risk perception was assessed using the following question: “How do you estimate your risk for having a cardiac arrest within the next 10 years?” (9-point scale, 1 = 0% to 5%, 9 = >40%). We calculated the accuracy of risk perception by subtracting the actual risk score from the perceived risk score. Smoking status was assessed using the following self-report question: “Do you currently smoke?” This question could be answered as either “yes” or “no.”
Because the dose and the type of statins could be changed during the study period, we categorized the prescribed statins according to their potency : (1) atorvastatin 5 mg, simvastatin 10 mg, pravastatin 20 mg, and fluvastatin 40 mg; (2) rosuvastatin 5 mg, atorvastatin 10 mg, and simvastatin 20 mg; (3) rosuvastatin 10 mg, atorvastatin 20 mg, and simvastatin 40 mg; (4) rosuvastatin 20 mg and atorvastatin 40 mg; and (5) rosuvastatin 40 mg and atorvastatin 80 mg. Patients not using statins were assigned a score of 0.
Primary outcomes were lipid levels, medication adherence, and anxiety. A sample size of 97 patients in each group would be required to detect a difference in means of 1.5 points, assuming a common standard deviation of 3.7, with 80% power and a 2-sided α value of 0.05. LDL cholesterol target levels had been set differently for primary (3.5 mmol/L) and secondary (3.0 mmol/L) prevention patients. Consequently, we investigated the difference between the 2 groups in LDL cholesterol for primary and secondary prevention patients separately. Analyses were according to intention to treat (i.e., patients were analyzed as randomized). Patients with baseline measurements and ≥1 follow-up measurement were included in the analyses. We used repeated-measures linear mixed models, which can handle missing measurements, to test for differences between the RC and EC groups in lipid levels, anxiety, body mass index, blood pressure, QoL, symptoms, risk perception, accuracy of risk perception, IMT, and FMD during follow-up, with baseline values included as covariates. Model results were summarized by the estimated mean values during follow-up, adjusted for baseline measurements. Linear mixed models were also used to investigate differences between the 2 groups during follow-up in adherence to lipid-lowering medication, beliefs about medication (concerns and necessity), and statin potency score. We used generalized estimating equations to investigate the difference between the 2 groups in the percentage of patients reporting current smoking. Additionally, we investigated the change from baseline during follow-up in all outcome measures irrespective of group assignment using linear mixed models. To verify the validity of self-reported adherence to lipid-lowering medication, we calculated Pearson’s correlation coefficients between self-reported adherence and concurrent LDL cholesterol concentrations, adjusting for baseline LDL cholesterol and statin potency score. All data were analyzed using SPSS version 16 (SPSS, Inc., Chicago, Illinois).
Results
A total of 201 consecutive patients were enrolled ( Figure 2 ). Characteristics at baseline are listed in Table 1 . There were no statistically significant differences in baseline characteristics between patients in the 2 study arms within the subgroups of primary and secondary prevention patients.
| Variable | RC group (n = 100) | EC group (n = 101) | p Value |
|---|---|---|---|
| Age (years) | 49.2 ± 1.3 | 48.9 ± 1.2 | 0.68 |
| Men | 60 (60%) | 59 (59%) | 0.95 |
| Primary prevention patients | 52 (52%) | 48 (48%) | 0.72 |
| Total cholesterol | 0.90 | ||
| mmol/L | 6.55 ± 1.6 | 6.57 ± 1.4 | |
| mg/dl | 253 ± 62 | 254 ± 54 | |
| Triglycerides | 0.93 | ||
| mmol/L | 2.32 ± 1.4 | 2.25 ± 1.3 | |
| mg/dl | 205 ± 124 | 199 ± 115 | |
| HDL cholesterol | 0.09 | ||
| mmol/L | 1.13 ± 0.3 | 1.21 ± 0.3 | |
| mg/dl | 44 ± 12 | 47 ± 12 | |
| LDL cholesterol ⁎ | 0.82 | ||
| mmol/L | 4.88 ± 1.4 | 4.82 ± 1.2 | |
| mg/dl | 189 ± 54 | 186 ± 46 | |
| LDL cholesterol † | 0.55 | ||
| mmol/L | 3.75 ± 1.3 | 3.91 ± 1.3 | |
| mg/dl | 145 ± 50 | 151 ± 50 | |
| Anxiety (HADS score) | 5.6 ± 4.1 | 5.1 ± 3.8 | 0.38 |
| Body mass index (kg/m 2 ) | 28.1 ± 5.2 | 28.1 ± 5.0 | 0.91 |
| Systolic blood pressure (mm Hg) | 134.2 ± 22.7 | 132.7 ± 22.2 | 0.56 |
| Diastolic blood pressure (mm Hg) | 83.1 ± 11.0 | 81.8 ± 10.0 | 0.39 |
| IMT (mm) | 0.63 ± 0.16 | 0.62 ± 0.15 | 0.91 |
| FMD (%) | 6.35 ± 3.7 | 6.41 ± 3.3 | 0.91 |
| QoL physical health score (SF-12) | 46.5 ± 10.4 | 48.4 ± 9.6 | 0.24 |
| QoL mental health score (SF-12) | 49.4 ± 9.2 | 51.4 ± 8.7 | 0.16 |
| Symptoms (EORTC) | 15.7 ± 11.1 | 15.3 ± 12.1 | 0.80 |
| Risk perception score | 3.5 ± 2.5 | 4.4 ± 2.9 | 0.03 |
| Difference between actual and perceived risk | 4.9 ± 14 | 10.8 ± 16 | 0.01 |
| Smokers | 35 (35%) | 31 (31%) | 0.69 |
| 10-year Framingham risk score | 12.5 ± 8.9 | 11.3 ± 8.7 | 0.34 |
| Statin potency score | 2.06 ± 0.28 | 2.16 ± 0.47 | 0.07 |
LDL cholesterol was statistically significantly lower in the EC group than in the RC group during follow-up in primary prevention patients but not in secondary prevention patients ( Table 2 , Figure 3 ). Patients in the EC group reported significantly higher levels of adherence to lipid-lowering medication (about 95% to 100%) than patients in the RC group (about 90% to 95%) ( Table 2 , Figure 3 ). Patients in the EC group had significantly lower levels of anxiety than patients in the RC group ( Table 2 , Figure 3 ). Patients in the EC group had significantly lower symptom and concern scores than patients in the RC group. Higher levels of self-reported adherence to lipid-lowering medication were significantly correlated with lower concurrent LDL cholesterol (r = −0.36, p <0.001), and also when adjusted for baseline LDL cholesterol and statin potency score, thereby supporting the validity of self-reported adherence.
| Variable | RC group (n = 100) | EC group (n = 101) | Change from Baseline | Between-Group Difference ⁎ |
|---|---|---|---|---|
| Total cholesterol | ||||
| mmol/L | 4.71 ± 0.07 | 4.66 ± 0.07 | −1.88 (−2.08 to −1.67) ∥ | −0.05 (−0.12 to 0.02) |
| mg/dl | 182 ± 2.7 | 180 ± 2.7 | −73 (−80 to −65) ∥ | −2 (−5 to 0.8) |
| HDL cholesterol | ||||
| mmol/L | 1.23 ± 0.02 | 1.23 ± 0.02 | 0.50 (0.02 to 0.8) ∥ | 0.01 (−0.06 to 0.07) |
| mg/dl | 48 ± 0.8 | 48 ± 0.8 | 19 (0.8 to 31) ∥ | 0.4 (−2.3 to 2.7) |
| Triglycerides | ||||
| mmol/L | 1.95 ± 0.08 | 1.81 ± 0.09 | −0.46 (−0.62 to −0.31) ∥ | −0.14 (−0.30 to 0.02) |
| mg/dl | 173 ± 7.1 | 160 ± 7.9 | −41 (−55 to −27) ∥ | −12 (−27 to 1.8) |
| LDL cholesterol † | ||||
| mmol/L | 3.00 ± 0.10 | 2.66 ± 0.10 | −2.02 (−2.33 to −1.72) ∥ | −0.34 (−0.64 to −0.04) § |
| mg/dl | 116 ± 3.9 | 103 ± 3.9 | −78 (−90 to −67) ∥ | −13 (−25 to −1.5) § |
| LDL cholesterol ‡ | ||||
| mmol/L | 2.39 ± 0.10 | 2.52 ± 0.09 | −1.37 (−1.67 to −1.07) ∥ | 0.13 (−3.16 to 3.44) |
| mg/dl | 92 ± 3.9 | 97 ± 3.5 | −53 (−65 to −41) ∥ | 5 (−122 to 133) |
| Adherence to statins last week | 4.60 ± 0.05 | 4.90 ± 0.05 | — | 0.30 (0.03 to 0.63) ∥ |
| Adherence to statins last month | 8.86 ± 0.15 | 9.39 ± 0.15 | — | 0.53 (0.02 to 1.05) § |
| Anxiety (HADS score) | 5.0 ± 0.2 | 4.2 ± 0.2 | −0.69 (−1.16 to −0.22) ∥ | −0.80 (−1.4 to −0.2) § |
| Body mass index (kg/m 2 ) | 28.1 ± 0.2 | 28.0 ± 0.2 | −0.08 (−0.39 to 0.23) | −0.10 (−0.32 to 0.12) |
| Diastolic blood pressure (mm Hg) | 80.1 ± 0.7 | 78.7 ± 0.7 | −4.32 (−5.81 to −2.82) § | −1.40 (−4.5 to 1.69) |
| Systolic blood pressure (mm Hg) | 128.2 ± 1.3 | 126.1 ± 1.3 | −7.02 (−9.97 to −4.08) ∥ | −2.10 (−7.56 to 3.36) |
| IMT (mm) | 0.57 ± 0.01 | 0.60 ± 0.01 | −0.04 (−0.06 to −0.02) ∥ | 0.03 (−0.02 to 0.08) |
| FMD (%) | 8.11 ± 0.32 | 8.00 ± 0.33 | 2.05 (1.35 to 2.76) | −0.11 (−0.62 to 0.41) |
| QoL (SF-12) | ||||
| Physical health summary score | 47.7 ± 0.5 | 48.7 ± 0.5 | 0.83 (−0.31 to 1.98) | 1.00 (−2.33 to 0.35) |
| Mental health summary score | 50.6 ± 0.6 | 51.9 ± 0.6 | 0.45 (−0.72 to 1.62) | 1.30 (−4.58 to 7.18) |
| Symptoms (EORTC) | 15.9 ± 0.7 | 13.4 ± 0.7 | −0.90 (−2.24 to 0.44) | −2.50 (−5.35 to −0.37) § |
| Beliefs about medication (BMQ) | ||||
| Concerns | 14.8 ± 0.4 | 13.0 ± 0.4 | — | −1.05 (−0.43 to −3.16) ∥ |
| Necessity | 15.3 ± 0.3 | 15.7 ± 0.3 | — | 0.40 (−0.11 to 3.57) |
| Risk perception | 3.5 ± 0.2 | 3.0 ± 0.2 | −0.82 (−1.19 to −0.44) ∥ | −0.50 (−1.57 to 0.55) |
| Difference between actual and perceived risk | ||||
| Current smokers | 35% | 30% | 1.07 (0.87 to 1.32) | 0.69 (0.4 to 1.2) |
| Statin potency score | 2.3 ± 0.1 | 2.4 ± 0.1 | 0.47 (0.36 to 0.59) ∥ | 0.10 (−0.14 to 0.34) |
Stay updated, free articles. Join our Telegram channel

Full access? Get Clinical Tree


