Multiple echocardiographic criteria are routinely used for the estimation of left heart filling pressures. We assessed the predictive value of various echocardiographic parameters to estimate the left heart filling pressure and proposed a simplified approach for its evaluation. We collected the clinical, echocardiographic, and invasive hemodynamic data from 93 patients with heart failure who underwent right-sided heart catheterization and transthoracic echocardiography within a 24-hour period. Of these 93 patients, 57% had a left ventricular ejection fraction <50% and 69% had an elevated mean pulmonary capillary wedge pressure of ≥15 mm Hg. A mitral E/E′ of ≥15 had a sensitivity of 55% but a specificity of 96%. A left atrial area of ≥20 cm 2 had a sensitivity of 66% and specificity of 89%. A deceleration time <140 ms had a sensitivity of 51% and specificity of 93% to predict a pulmonary capillary wedge pressure of ≥15 mm Hg. The combination of E/E′ ≥15 ± left atrial area of ≥20 cm 2 ± deceleration time <140 ms provided a sensitivity of 92% and specificity of 85%. On multivariate analysis, the combination of E/E′ ≥15, left atrial area of ≥20 cm 2 , and deceleration time <140 ms was the most significant predictor of a pulmonary capillary wedge pressure of ≥15 mm Hg (odds ratio 48, 95% confidence interval 10 to 289, p <0.001). In conclusion, this simplified approach using 3 echocardiographic parameters provides an accurate and a practical approach for the routine estimation of the elevated left heart filling pressure.
Transthoracic echocardiography has been increasingly used to assess the left heart filling pressure. The American Society of Echocardiography has published a complex algorithm for the evaluation of left heart filling pressure according to multiple parameters. However, this strategy often leads to discordant results and uncertainty regarding the filling pressure. Recently published studies have shown the limited accuracy of the individual echocardiographic parameters. The purpose of our study was to evaluate which parameters had the best predictive value and then to develop a simplified approach for accurate estimation of the left heart filling pressure.
Methods
For the present retrospective study, we reviewed the medical records of patients with heart failure and heart transplant patients from January 2000 to April 2008. We included patients with impaired systolic left ventricular (LV) function and New York Heart Association class III or greater or those after cardiac transplantation with normal or reduced LV function. We excluded patients with previous heart valve surgery, severe valvular disease, or atrial fibrillation and patients requiring mechanical ventilation. The local institutional review board approved the present study.
Patients underwent right-sided heart catheterization and transthoracic echocardiography within a 24-hour period. A Swan-Ganz catheter was used to estimate the filling pressure at end expiration. A comprehensive transthoracic echocardiography was performed using standard techniques. Multiple echocardiographic parameters were measured ( Table 1 ). These measurements were performed by 2 independent echocardiographer cardiologists who were unaware of the hemodynamic data. The E′ lateral mitral annulus velocity was measured, the mitral E/E′ for the lateral annulus was calculated, and the estimated left atrial (LA) pressure was derived according to a study by Nagueh et al.
| Variable | All (n = 93) | LVEF <50% | p Value | |
|---|---|---|---|---|
| Yes (n = 50) | No (n = 43) | |||
| Age (years) | 54 ± 15 | 54 ± 14 | 54 ± 15 | 0.966 |
| Men | 79 (85%) | 44 (88%) | 35 (81%) | 0.375 |
| Pulmonary capillary wedge pressure (mm Hg) | 21 ± 10 | 26 ± 9.4 | 14 ± 6 | <0.001 |
| Cardiac index (L/min/m 2 ) | 2.4 ± 0.8 | 2.1 ± 0.7 | 2.8 ± 0.6 | <0.001 |
| Left ventricular ejection fraction (%) | 41 ± 19 | 25 ± 9% | 60 ± 6% | <0.001 |
| Left ventricular end-diastolic dimension (cm) | 5.5 ± 1.5 | 6.6 ± 1.2 | 4.3 ± 0.6 | <0.001 |
| Left ventricular mass index (g/m2) | 120 ± 52 | 149 ± 51 | 85 ± 26 | <0.001 |
| Mitral E velocity (cm/s) | 89 ± 24 | 95 ± 26 | 82 ± 19 | 0.006 |
| Mitral E/A | 2.2 ± 1.1 | 2.4 ± 1.3 | 1.9 ± 0.7 | 0.025 |
| Mitral deceleration Time (ms) | 162 ± 56 | 152 ± 66 | 174 ± 40 | 0.071 |
| Mitral E/E′ lateral | 16 ± 8 | 19 ± 9 | 12 ± 5 | <0.001 |
| Left atrial area (cm 2 ) | 21 ± 8 | 23 ± 9 | 17 ± 6 | <0.001 |
| Systolic pulmonary artery pressure (mm Hg) | 38 ± 17 | 44 ± 18 | 31 ± 12 | <0.001 |
| Central venous pressure (mm Hg) | 9 ± 6 | 11 ± 6 | 6 ± 3 | <0.001 |
| B-bump present | 37 (45%) | 25 (57%) | 12 (31%) | 0.017 |
| L-wave present | 5 (7%) | 3 (9%) | 2 (5%) | 0.456 |
| L′-wave present | 3 (5%) | 2 (11%) | 1 (2%) | 0.163 |
| Diastolic pulmonary vein flow | 61 (79%) | 32 (78%) | 29 (81%) | 0.787 |
Statistical analysis was performed using SPSS, version 18.0 (Chicago, Illinois). Between group comparisons were done using the t test and Fisher’s exact test. The correlation of linear variables was assessed using Pearson’s coefficient. Receiver operating characteristic analysis was done to evaluate the area under curve. The sensitivity and specificity of echocardiographic parameters were derived. Multivariate analysis was done using stepwise logistic regression analysis.
Results
The baseline clinical and echocardiographic characteristics of the study group (n = 93) are listed in Table 1 . The mean age of the study cohort was 54 ± 15 years. The mean LV ejection fraction (LVEF) 41 ± 19%, 57% of the patients had a LVEF <50%, and 69% of the patients had a pulmonary capillary wedge pressure (PCWP) of ≥15 mm Hg. Patients with a LVEF <50% had a significantly greater PCWP than patients with a LVEF of ≥50% (26 ± 9 vs 14 ± 6, p <0.001). Patients with a LVEF <50% had a greater mitral E/A, a shorter deceleration time (DT), a lower E′, a greater E/E′, an increased LA area, a greater systolic pulmonary artery pressure, and an estimated central venous pressure compared to those with a LVEF of ≥50% ( Table 1 ).
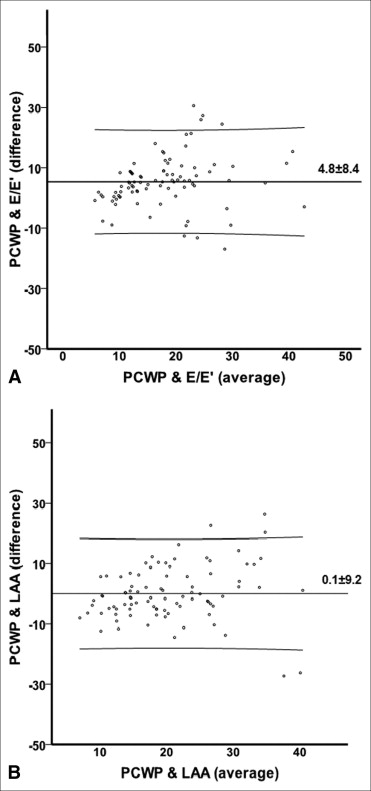
The correlation coefficient varied widely from 0.2 to 0.7, depending on the echocardiographic parameters used. Correlations were poor for the LVEF ≥50% subgroup in which the correlation coefficient varied from 0.1 to 0.5. The agreement between the E/E′-derived estimated LA pressure and PCWP was assessed using the Bland-Altman plot ( Figure 1 ). Similarly, the agreement was evaluated between the LA area and PCWP ( Figure 1 ).
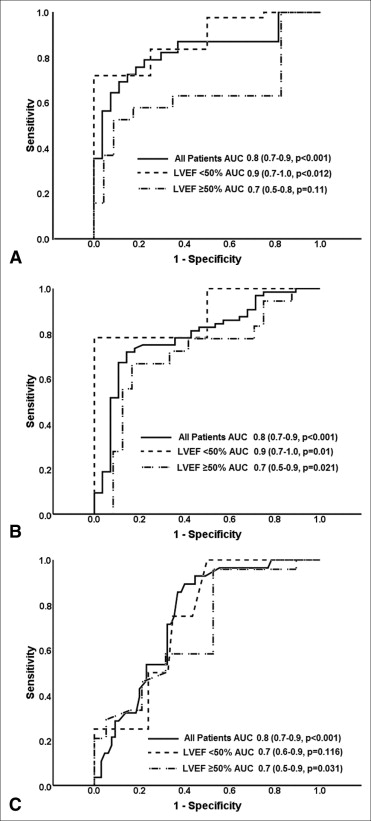
The area under the curve was 0.8 for LVEF, mitral E velocity, deceleration time, E/E′, and LA area. The area under the curve was 0.7 for E/A, pulmonary artery pressure, and central venous pressure. The area under the curve for E/E′ and LA area was greater for patients with a LVEF <50% ( Figure 2 ).
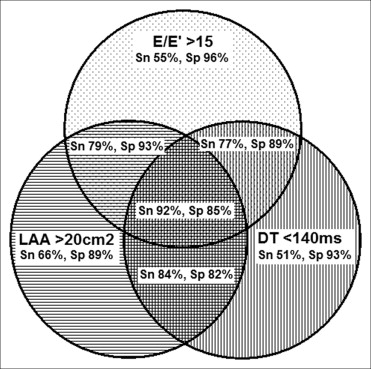
A mitral E/E′ of ≥15 had a sensitivity of 55% but a specificity of 96%. A LA area of ≥20 cm 2 had a sensitivity of 66% and specificity of 89%, and a DT <140 ms had a sensitivity of 51% and specificity of 93% to predict a PCWP of ≥15 mm Hg. The sensitivity and specificity of the other individual echocardiographic parameters stratified by LV function are listed in Table 2 . To improve the predictive value of the individual echocardiographic parameters, we tested 30 different combinations (see on-line Appendix Table 1 ). The combination of E/E′ ≥15 ± LA area of ≥20 cm 2 ± DT <140 ms provided the best predictive value, with a sensitivity of 92% and specificity of 85% to predict an elevated PCWP ( Figure 3 ). The estimated central venous pressure, E/A, pulmonary vein flow, pulmonary artery pressure, L wave, and L′ wave did not lead to any further improvements in the prediction of elevated PCWP.
| Variable | Cutoff | All (n = 93) | LVEF <50% | ||||
|---|---|---|---|---|---|---|---|
| Yes (n = 50) | No (n = 43) | ||||||
| Sensitivity (%) | Specificity (%) | Sensitivity (%) | Specificity (%) | Sensitivity (%) | Specificity (%) | ||
| Mitral E velocity (cm/s) | ≥80 | 74% | 79% | 76% | 100% | 68% | 75% |
| Mitral E/A | ≥2 | 66% | 75% | 67% | 100% | 61% | 67% |
| Mitral deceleration time (ms) | <140 | 51% | 93% | 57% | 75% | 37% | 96% |
| Mitral E/E′ lateral | ≥8 | 95% | 18% | 100% | 25% | 84% | 17% |
| ≥12 | 73% | 81% | 81% | 75% | 53% | 83% | |
| ≥15 | 55% | 96% | 65% | 100% | 32% | 96% | |
| Left atrial area (cm 2 ) | ≥20 | 66% | 89% | 70% | 100% | 56% | 88% |
| Systolic pulmonary artery pressure (mm Hg) | ≥40 | 52% | 89% | 60% | 100% | 37% | 79% |
| Central venous pressure (mm Hg) | ≥10 | 48% | 89% | 56% | 75% | 32% | 92% |
| B-bump | Present | 54% | 77% | 60% | 75% | 41% | 77% |
| Pulmonary vein flow | Diastolic | 85% | 35% | 81% | 50% | 94% | 32% |