The high incidence of sudden cardiac death in heart failure (HF) reflects electrophysiologic changes in response to myocardial failure. We previously showed that short-term variability of QT intervals (STV QT ) identifies latent repolarization disorders in patients with drug-induced or congenital long QT syndrome. This study sought to determine (1) if STV QT is increased in patients with dilated cardiomyopathy (DC) and moderate congestive HF and (2) if increased STV QT is associated with ventricular arrhythmia in patients with HF. Sixty patients (53 ± 12 years of age, 14 women) with DC and moderate HF (New York Heart Association classes II to III) were compared to matched controls. Twenty patients had implantable cardiac defibrillators secondary to a history of ventricular tachycardia (VT). Two cardiologists blinded to diagnosis manually measured QT intervals. Beat-to-beat variability of repolarization was determined from Poincaré plots of 30 consecutive QT intervals as was STV QT . QTc intervals were comparable in patients and controls (419 ± 36 vs 415 ± 32 ms, respectively, p >0.05), whereas STV QT was significantly higher in patients with HF (7.8 ± 3 vs 4.1 ± 2 ms, respectively, p <0.05). STV QT was more increased in patients with a history of VT compared to those without VT (10.1 ± 2 vs 6.6 ± 2 ms, respectively, p <0.05). Increased STV QT and decreased ejection fraction were associated with a history of VT; however, STV QT was the strongest indicator. In conclusion, the present study demonstrates for the first time that STV QT is increased in patients with DC with HF. Patients with DC and HF and implantable cardiac defibrillators for secondary prevention had the highest STV QT . Thus, increased STV QT in the context of moderate HF may reflect a latent repolarization disorder and increased susceptibility to sudden death in patients with DC, which is not identified by a prolonged QT interval.
Heart failure (HF) is the most common cause for hospital admission and the main hospital discharge diagnosis. Advanced circulatory insufficiency and sudden cardiac death due to ventricular arrhythmias are important causes of death in HF. The high incidence of sudden cardiac death in HF reflects the composite dynamic structural, electrical, and functional changes in response to myocardial insufficiency. Animal models and results from clinical trials have investigated the role of repolarization abnormalities that underlie action potential prolongation and arrhythmogenesis. Thus far, decreased left ventricular ejection fraction is the most commonly used factor for risk stratification in these patients, with insufficient predictive value. Therefore, improved risk stratification in patients with dilated cardiomyopathy (DC) in the context of implantable cardioverter–defibrillator (ICD) therapy is desirable. Several parameters are discussed to quantify repolarization disturbances in HF. Based on the hypothesis of repolarization reserve, short-term variability of QT intervals (STV QT ) was recently shown to improve risk stratification in patients with acquired and congenital long QT syndrome and proarrhythmia. Because HF shares important myocardial electrical characteristics with long QT syndromes, we assessed in the present study (1) if STV QT is increased in patients with nonischemic DC and HF compared to an age- and gender-matched control group and (2) if increased STV QT is associated with an increased risk for arrhythmias.
Methods
The study population of this multicenter study included patients with HF and nonischemic DC and symptomatic HF in functional New York Heart Association class II or III. All patients underwent noninvasive and invasive evaluation (physical examination, blood tests, M-mode and 2-dimensional echocardiography, coronary angiography). Left ventricular ejection fraction was documented by 2-dimensional echocardiography (Simpson method). At the time of electrocardiographic recording, all patients were in stable condition and on concomitant medical treatment including β blockers and angiotensin-converting enzyme inhibitors. Requirements for electrocardiographic recording at rest were sinus rhythm without pacemaker activity and minimal premature supraventricular or ventricular activity that allowed analysis of 30 consecutive beats. None of the patients were on class I or III antiarrhythmic agents. Serum potassium concentrations were within normal limits in all patients at the time of the study. Exclusion criteria were functional New York Heart Association class IV, intraventricular conduction disturbances (left or right bundle branch block), ICD implantation for primary prophylaxis, or implanted cardiac resynchronization therapy systems. Sixty patients with HF (mean age 53 ± 12 years, 14 women) from 100 screened patients with HF were included, of whom 20 had an ICD implanted for secondary prophylaxis due to documented symptomatic sustained ventricular tachycardia (VT) or survived sudden cardiac death. Eight patients with HF had a history of paroxysmal atrial fibrillation. All patients provided written informed consent for the study, which was approved by the human ethics committee of Ludwig Maximilians University (Munich, Germany) and the local ethics boards of the participating centers.
Patients with HF were matched 1:1 with controls according by age (±5 years) and gender. The control population had normal left ventricular function assessed by echocardiography and was recruited from an ongoing population-based cohort study from which 880 controls were available for matching. All patients and controls were of Caucasian origin.
A 12-lead electrocardiogram was recorded over 2 minutes at a paper speed of 50 mm/s on a Mortara electrocardiographic recorder (Mortara Portrait Electrocardiograph, Mortara Instruments, Milwaukee, Wisconsin) after a 10-minute rest in the supine position. Two observers blinded to patient data manually measured RR and QT intervals of 30 consecutive beats. QT intervals were determined in lead II or lead V 5 from the onset of the QRS complex to the end of the T wave employing the method of Lepeschkin and Surawicz. QT intervals were corrected for heart rate (QTc interval) using the formula of Bazett. The cut-off value for QT prolongation was defined as 440 ms. By plotting RR or QT intervals against the previous interval for 30 consecutive beats, Poincaré plots were obtained as previously described. STV, defined as the mean distance of points perpendicular to the line of identity in the Poincaré plot, was calculated (STV D = Σ|D n + 1 − D n |/[30 × √2], where D n represents the RR or QT interval of beat n). A spreadsheet with automated calculation of STV based on users’ input is available as online supplemental material .
All variables are reported as mean ± SD. To assess significance levels between case samples and control samples and for patients with VT versus those without VT, logistic regression analysis was performed and a significance threshold with a p value <0.05 was accepted as statistically significant, if not stated otherwise.
Results
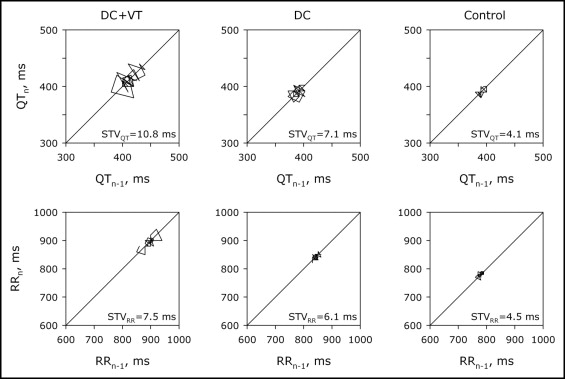
Hemodynamic and electrophysiologic characteristics of the 60 patients with HF and their age- and gender-matched controls are presented in Table 1 . The HF group showed, as expected, significantly decreased left ventricular function ( Table 1 ). The percentage of patients who had symptomatic VTs in functional New York Heart Association class II was 29% versus 44% in functional New York Heart Association class III. Clinical characteristics of patients with HF with and without a history of VT are presented in Table 2 . Patients with HF had a significantly slower heart rate compared to controls. QRS duration was similar in patients with HF and controls. Relative intraobserver error of QT measurement in our study was 3.1%. We found no significantly longer QTc duration in patients with HF compared to controls ( Table 1 ). Poincaré plots were drawn by plotting RR or QT intervals against the previous interval for 30 consecutive beats and STV was calculated. QT and RR Poincaré plots from representative control and patients with HF with and without documented VT are shown in Figure 1 . We found significantly larger STV QT in patients with HF compared to control patients ( Table 1 ). This increase was further accentuated in patients with HF and documented VT compared to patients with HF without VT ( Table 2 ). Individual STV QT in patients with HF with or without documented VT and their respective age- and gender-matched controls is shown in Figure 2 . Prolonged QTc intervals (>440 ms) were found in all groups, including the control population. No significant correlation between STV QT and STV RR was found in control subjects (r s = 0.47) or within the HF group (r s = 0.32). Decreased ejection fraction and increased STV QT were associated with a history of arrhythmias in the present HF population. Multiple logistic regression analysis of these parameters indicated high STV QT with an odds ratio of 1.52 (95% confidence interval 1.20 to 2.07, p = 0.007) and low ejection fraction with an odds ratio of 1.13 (95% confidence interval 0.91 to 1.1, p = 0.015) as the strongest indicators of VT requiring ICD for secondary prophylaxis.
| Variable | Controls (n = 60) | Patients With HF (n = 60) | p Value |
|---|---|---|---|
| Women/men | 14/46 | 14/46 | — |
| New York Heart Association class II | 0 | 42 | — |
| New York Heart Association class III | 0 | 18 | — |
| Left ventricular ejection fraction (%) | 67 ± 5 | 37 ± 10 | 0.0001 |
| Cycle length (ms) | 842 ± 134 | 891 ± 112 | 0.001 |
| Duration of QRS interval (ms) | 102 ± 14 | 109 ± 14 | 0.78 |
| Heart-rate corrected QT interval (ms) | 415 ± 32 | 419 ± 36 | 0.609 |
| Short-term variability of QT intervals (ms) | 4.1 ± 2 | 7.8 ± 3 | 0.0001 |
| Short-term variability of RR intervals (ms) | 16 ± 12 | 13 ± 9 | 0.196 |
| Variable | VT | p Value | |
|---|---|---|---|
| No | Yes | ||
| Group size | 40 | 20 | — |
| Women/men | 11/29 | 3/17 | 0.2672 |
| New York Heart Association class II | 30 | 12 | 0.2373 |
| New York Heart Association class III | 10 | 8 | 0.3273 |
| Left ventricular ejection fraction (%) | 41 ± 9 | 31 ± 9 | 0.014 |
| Cycle length (ms) | 905 ± 156 | 865 ± 138 | 0.3232 |
| Duration of QRS interval (ms) | 106 ± 9 | 117 ± 22 | 0.3983 |
| Heart rate–corrected QT interval (ms) | 418 ± 30 | 422 ± 47 | 0.6852 |
| Short-term variability of QT intervals (ms) | 6.6 ± 2 | 10.1 ± 2 | 0.007 |
| Short-term variability of RR intervals (ms) | 14 ± 10 | 11 ± 7 | 0.3994 |
Stay updated, free articles. Join our Telegram channel

Full access? Get Clinical Tree


