Endothelial dysfunction is a key feature of atherosclerosis. Retinal microvascular endothelial function can be assessed using noninvasive dynamic vessel imaging techniques. Whether it is impaired in subjects with coronary artery disease (CAD) is unknown. The aim of this study was to examine the relation of retinal microvascular endothelial function with CAD. Vascular studies were performed in 197 prospectively recruited subjects divided into 2 groups: those without CAD but ≥2 cardiovascular risk factors (non-CAD controls; n = 119) and those with stable CAD (n = 78). Retinal microvascular endothelial dysfunction was assessed by measuring retinal arteriolar and venular dilatation to flicker light, a nitric oxide–dependent phenomenon, expressed as percentage increase over baseline diameter. Fingertip pulse-volume amplitude was measured to calculate reactive hyperaemia index and brachial artery flow-mediated dilatation assessed as measures of peripheral microvascular and conduit vessel endothelial function, respectively. Mean retinal arteriolar dilatation was attenuated in patients with CAD compared with non-CAD controls (1.51 ± 1.51% vs 2.37 ± 1.95%, p = 0.001). Retinal arteriolar dilatation was independently associated with CAD after adjustment for age, gender, cardiovascular risk factors, and medication use (odds ratio 1.60, 95% confidence interval 1.14 to 2.25, p = 0.007). Reactive hyperaemia index and flow-mediated dilatation were not different. In conclusion, the capacity of retinal arterioles to dilate in response to flicker light is an independent predictor of the presence of CAD and suggests that retinal microvascular endothelial dysfunction is a marker for underlying CAD.
The retinal circulation allows a direct and noninvasive window to the health of the circulation in vivo. Large epidemiologic studies have indicated that single “static” photographic images of the retina, showing the presence or absence of signs of retinopathy, and the measurement of retinal vascular caliber, provides information on the risk for cardiovascular complications. The “dynamic” response of the retinal vessels can be evaluated in real-time by noninvasive assessment of retinal vascular dilatation in response to diffuse luminance flicker light and applied in systemic and ocular disease. Previous work has shown that nitric oxide, a vasoactive mediator that is produced by the vascular endothelium, is a significant contributor to this phenomenon. It is unknown if retinal microvascular endothelial dysfunction is related to the presence of coronary artery disease (CAD) and can be a marker of underlying risk. In this study, we sought to determine if retinal microvascular endothelial function is impaired in patients with underlying CAD.
Methods
The study was approved by the Human Research Ethics Committee of Austin Health. Patients were recruited prospectively from cardiology outpatient clinics to participate in this study (n = 197). Two groups were defined before recruitment. Group 1 included subjects with ≥2 cardiovascular risk factors but no clinical manifestations of CAD (non-CAD controls; n = 119). Group 2 included subjects with clinically evident stable CAD, as defined by documented coronary angiographic stenosis >50% on visual assessment or the presence of symptoms of myocardial ischemia and abnormal stress test results (n = 78). In group 2, 62 patients (83%) had histories of coronary revascularization. Detailed clinical data were collected on all subjects, including a standardized clinical examination and fasting venous blood. Endothelial function tests were performed in a temperature-controlled, quiet environment with subjects fasting. Patients were not recruited if adequate retinal examinations could not be performed. Vasoactive drugs, caffeinated drinks, and nicotine were withheld for ≥12 hours.
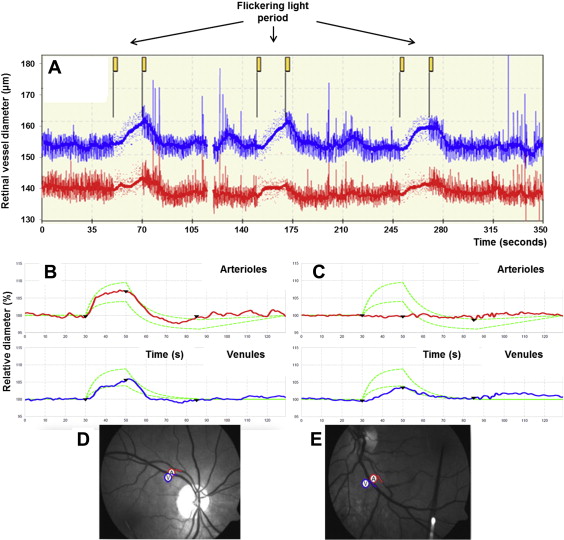
Pupils were dilated with 1% tropicamide eyedrop solution to obtain optimal retinal images. Assessment of flicker light–induced retinal vasodilatation was performed using the Dynamic Vessel Analyzer (Imedos Systems UG, Jena, Germany) to assess percentage change of retinal vessel diameter compared with baseline ( Figure 1 ). This measurement is a continuous, automated vessel analysis, with a complete examination of both eyes taking approximately 20 minutes. In brief, the patient focuses on a fixation bar positioned inside the analyzer’s viewing system while the fundus is examined under green light. An arteriolar and venular segment between 0.5 and 2 disc diameters from the margin of the optic disc is selected. The diameter of the vessel is then calculated continuously along the selected segment. A baseline recording for 50 seconds is performed, followed by a 20-second provocation by flickering light. This is then followed by 80 seconds of steady illumination to allow the vessel to return to baseline. The cycle is then repeated twice with a total duration of 350 seconds. Responses were measured in both eyes, and an average measurement per patient was recorded. Maximum flicker light–induced retinal arteriolar dilatation (FI-RAD) and flicker light–induced venular vasodilatation (FI-RVD) were expressed as percentage increases from baseline. A previous study showed a mean FI-RAD of 7.0 ± 2.3% and a mean FI-RVD of 6.8 ± 3.4% in healthy subjects. Excellent reproducibility of this technique has been established in our laboratory, as previously described.
Static digital retinal photographs were taken of both eyes after pupil dilation (Canon EOS 40D, CF-60UVi fundus camera; Canon, Tokyo, Japan). The analysis was performed by a research assistant blinded to the disease status of the participants. A computer-based standardized protocol (IVAN; University of Wisconsin, Madison, Wisconsin) automatically measures the diameter of arterioles and venules within 0.5 to 1 disc diameter from the margin of the optic disc. The central retinal artery and vein equivalents are calculated on the basis of the 6 biggest vessels, reflecting the estimated diameter of the central retinal artery and vein. Arteriovenous ratio is defined as central retinal artery equivalent divided by central retinal vein equivalent. Diabetic retinopathy was graded according to the modified Airlie House classification. Other structural changes were also assessed, including focal arteriolar narrowing and arteriovenous nicking, following the modified protocol for the Multi-Ethnic Study of Atherosclerosis (MESA).
Brachial artery flow-mediated dilatation (FMD) is a measure of conduit vessel endothelial function and depends on shear stress–induced endothelial nitric oxide release. Brachial artery measurements were acquired using high-resolution ultrasound (Terason t3000 Ultrasound System; Burlington, Massachusetts). B-mode and Doppler signals were encoded and analyzed using Camtasia Studio version 6.0 (TechSmith, Okemos, Michigan). Baseline and maximum brachial artery diameter measurements were assessed, and FMD was calculated off-line as percentage increase in diameter from baseline conditions to maximum diameter during hyperemia using edge detection and wall-tracking software as previously described.
Peripheral microvascular endothelial function was assessed by measuring digital pulse-volume amplitude during reactive hyperemia, in which nitric oxide has been shown to play a central role. This technique is recognized as a validated marker of endothelial function. Beat-to-beat pulse-volume amplitude was recorded from the index finger using a peripheral arterial tonometric system and analyzed using a computer-based algorithm (endo-PAT2000 version 3.2.4; Itamar Medical Ltd, Caesarea, Israel). In brief, a pneumatic cuff was placed on the upper arm (study arm), with the contralateral arm as a control, with the subject in a supine position. The pneumatic plethysmographic probes were placed on the index finger of each hand and inflated to allow continuous recording of pulsatile blood volume responses from both hands. After 5 minutes of baseline recording, the pneumatic cuff on the upper arm was inflated to 200 mm Hg or 60 mm Hg above systolic pressure for a period of 5 minutes. The cuff was then deflated to induce reactive hyperemia, and pulse-volume recordings were continued for 5 more minutes. The reactive hyperemia index (RHI) is defined as the ratio of the average pulse-volume amplitude over a 1 minute time interval (started 1 minute after cuff deflation) divided by the average pulse volume amplitude over a 3.5-minute time period before cuff inflation (baseline). The value from the study arm was normalized to the control arm to compensate for potential systemic alterations in vascular tone.
Continuous values are expressed as mean ± SD. Categorical values are expressed as counts and percentages. Data were assessed for normality using the Shapiro-Wilk test and found to be normally distributed. Baseline characteristics were analyzed with chi-square tests for categorical variables and Student’s t tests for continuous variables. Multivariate logistic regression analysis was performed to determine predictors of underlying CAD. This analysis was performed after adjusting for cardiovascular risk factors and medication use, which were selected on the basis of their known association with vascular function.
Sample size was calculated on the basis of mean values of FI-RAD previously reported in patients with type 1 diabetes mellitus, as retinal microvascular endothelial function had not previously been assessed in subjects with coronary disease. It was estimated that a sample size of 171 patients would be required with 80% power at a 5% α level to detect a difference of 20% in FI-RAD between the study and control groups. A p value ≤0.05 was considered statistically significant. All statistical analyses were performed with SPSS version 18 for Windows (SPSS, Inc., Chicago, Illinois).
Results
Baseline characteristics and biochemical parameters are listed in Tables 1 and 2 , respectively. FI-RAD was attenuated in patients with CAD compared with the non-CAD control patients (1.51 ± 1.51% vs 2.37 ± 1.95%, p = 0.001; Table 3 ). However, FI-RVD was not different between groups ( Table 3 ). Focal arteriolar narrowing and arteriovenous nicking were numerically more frequent in the non-CAD group, but the differences were not statistically significant. There was a trend toward slightly larger venular diameters in the non-CAD group compared with the CAD group. However, central retinal artery equivalent and arteriovenous ratio were not significantly different ( Table 3 ). After adjustment, FI-RAD was significantly associated with CAD. Each 1% decrease in FI-RAD was associated with a 60% higher risk for having CAD (odds ratio 1.60, 95% confidence interval 1.14 to 2.25, p = 0.007). FMD (3.57 ± 1.84% vs 3.98 ± 2.04%, p = 0.162) and RHI (2.47 ± 0.07 vs 2.52 ± 0.09, p = 0.697) were not different between the CAD and non-CAD groups. All other retinal structural changes and peripheral endothelial functional measurements were found not to be independent predictors of CAD.
| Parameters | Coronary Artery Disease | p | |
|---|---|---|---|
| No (n = 119) | Yes (n = 78) | ||
| Age (year) | 55 ± 12 | 63 ± 9 | <0.001 |
| Men | 65 (55%) | 64 (82%) | <0.001 |
| Hypertension | 81 (68%) | 70 (90%) | <0.001 |
| Dyslipidaemia | 88 (74%) | 71 (91%) | <0.001 |
| Current smoker | 36 (30%) | 12 (15%) | 0.027 |
| Diabetes mellitus | 49 (41%) | 29 (37%) | 0.765 |
| Body mass index (kg/m 2 ) | 34 ± 8 | 31 ± 5 | 0.002 |
| Cardiovascular disease risk score (%) | 10 ± 8 | 13 ± 7 | 0.018 |
| Systolic blood pressure (mmHg) | 138 ± 18 | 140 ± 16 | 0.609 |
| Diastolic blood pressure (mmHg) | 78 ± 11 | 76 ± 9 | 0.179 |
| Diabetic medication | 34 (29%) | 21 (27%) | 0.872 |
| Lipid lowering therapy | 65 (55%) | 70 (90%) | <0.001 |
| RAS blocker medication | 69 (58%) | 60 (77%) | 0.009 |
| Beta blocker | 29 (24%) | 51 (65%) | <0.001 |
| Calcium channel blocker | 30 (25%) | 20 (26%) | 0.946 |
| Antiplatelet therapy | 38 (32%) | 70 (90%) | <0.001 |
Stay updated, free articles. Join our Telegram channel

Full access? Get Clinical Tree


