Repolarization abnormalities in the setting of bundle branch blocks (BBB) are generally ignored. We used Cox regression models to determine hazard ratios (HRs) with 95% confidence intervals (CIs) for incident heart failure (HF) associated with wide spatial and frontal QRS/T angle (upper twenty-fifth percentile of each) in men and women with and without BBB. This analysis included 14,478 participants (54.6% women, 26.4% blacks, 377 [2.6%] with BBB) from the Atherosclerosis Risk in Communities Study who were free of HF at baseline. Using No-BBB with normal spatial QRS/T angle as the reference group, the risk for HF in multivariable adjusted models was increased 51% for No-BBB with wide spatial QRS/T angle (HR 1.51, 95% CI 1.37 to 1.66), 48% for BBB with normal spatial QRS/T angle (HR 1.48, 95% CI 1.17 to 1.88), and the risk for incident HF was increased more than threefold for BBB with wide spatial QRS/T angle (HR 3.37, 95% CI 2.47 to 4.60). The results were consistent across subgroups by gender. Similar results were observed for the frontal plane QRS/T angle. In the pooled BBB group excluding right BBB, a positive T wave in lead aVR and heart rate 70 bpm and higher were also potent predictors of incident HF similar to the QRS/T angles. In conclusion, both BBB and wide QRS/T angles are predictive of HF, and concomitant presence of both carries a much higher risk than for either predictor alone. These findings suggest that repolarization abnormalities in the setting of BBB should not be considered benign or an expected consequence of BBB.
Abnormal electrocardiographic (ECG) repolarization markers such as wide spatial and frontal QRS/T angle have been repeatedly shown to be predictive of cardiovascular disease (CVD) events including incident heart failure (HF). Most of these previous studies, however, excluded participants with bundle branch blocks (BBBs). Hence, there is a paucity of information on the prognostic significance of repolarization abnormalities in the setting of BBBs. The aim of the present study is to evaluate the independent prognostic significance for the QRS/T angle and other ECG measurements of abnormal repolarization for the prediction of incident HF in men and women with and without BBB.
Methods
This analysis included participants from the Atherosclerosis Risk in Communities (ARIC) Study, a population-based multicenter prospective study of blacks and whites designed to investigate the natural history and cause of atherosclerotic and CVD from 4 US communities: Forsyth County, North Carolina; Jackson, Mississippi; suburbs of Minneapolis, Minnesota; and Washington County, Maryland (n = 15,792 men and women aged 45 to 64 years). Eligible participants were interviewed at home and then invited to a clinical examination at baseline between 1987 and 1989. They attended 3 additional clinical examinations at 3-year intervals and a recent fifth examination completed in 2013 for which data are not included here. Participants were interviewed by phone annually. Details of the ARIC Study design, protocol sampling procedures, and selection and exclusion criteria were published elsewhere. The study was approved by each study site’s institutional review board. All participants provided written informed consent. For the purpose of this analysis, we excluded 1,314 participants: 405 with missing ECG or key variables, 126 with inadequate quality ECG or ECG diagnosis of external pacemaker or Wolff-Parkinson-White pattern, 44 with race other than black or white, and 739 with prevalent HF at baseline. After all exclusions, 14,478 participants, of whom 377 had BBB, remained and were included in this analysis.
Incident HF occurred from baseline through December 31, 2010 was considered in the present investigation. The follow-up period was up to 24 years (mean 21 years). Incident HF was defined by International Classification of Disease ( ICD ) codes as the first occurrence of either a hospitalization with an HF hospital discharge diagnosis code ( ICD, Ninth Revision, Clinical Modification , code 428) or a death certificate with any listing of a 428 ICD ( Ninth Revision ) code or I50 ICD ( Tenth Revision ) code. Detailed definitions for incident HF classification were published previously.
Identical electrocardiographs (MAC PC; Marquette Electronics Inc., Milwaukee, Wisconsin) were used at all clinic sites, and resting, 10-second standard simultaneous 12-lead ECGs were recorded in all participants using strictly standardized procedures. All ECGs were processed in a central ECG laboratory (initially at Dalhousie University, Halifax, NS, Canada, and later at the EPICARE Center, Wake Forest School of Medicine, Winston-Salem, NC), where all ECGs were visually inspected for technical errors and inadequate quality using an interactive computer graphics terminal. The ECGs were first processed by the Dalhousie ECG program and were reprocessed for the present study using the 2001 version of the GE Marquette 12-SL program (GE, Milwaukee, Wisconsin). Different patterns of BBB were classified according to the Minnesota Code (MC) criteria as follows : complete left BBB (LBBB, MC-7.1), complete right BBB (RBBB, MC-7.2, QRS axis > −45°), intraventricular conduction defect (MC-7.4), and combination of RBBB and left anterior fascicular block (MC-7.8, RBBB and QRS axis between −45 and −120°). Global interval measurements were obtained from the quasi-orthogonal XYZ leads computed from the standard 12-lead ECGs using the Horáĉek transform. Spatial QRS/T angle was derived as the angle between the mean QRS and T vectors. Frontal plane QRS/T angle was defined as the absolute value of the difference between the frontal plane QRS axis and frontal plane T axis and was adjusted to the minimal angle using (360° − angle) for an angle >180° (axis measure range from −89° to +270° in the GE Marquette ECG program, GE, Milwaukee, Wisconsin). ECG-left ventricular hypertrophy was defined by modified Cornell voltage (RaVL + SV3). Rate-adjusted QT interval (QTa) was computed as a linear function of the RR interval with separate formulas derived for women or men and with or without BBB.
In our previous report on BBB and HF in postmenopausal women, STJ-aVL amplitude in LBBB and STJ-aVL and T-aVR amplitudes in a No-LBBB group were found to be significant predictors of HF in addition to quintile 5 of the QRS/T angle. Therefore, it was decided to include STJ and T-wave amplitudes from 3 quasi-orthogonal standard leads (V 6 , aVR, and V 1 ) as additional repolarization variables in some of the analyses of the present study.
Frequency distributions of ECG measurements were inspected to identify anomalies and outliers. Descriptive statistics were used to determine mean values, SDs, and percentile distributions for continuous variables and frequencies and percentages for categorical variables. Cox’s proportional hazards regression was used to assess the associations of ECG measurements with the risk of HF: model 1 for unadjusted, model 2 adjusted for demographics (age, gender, and race), and model 3 adjusted for demographic, regional center, body mass index, systolic blood pressure, smoking status, hypertension, diabetes mellitus, history of CVD status, ratio of total cholesterol/high-density lipoprotein, blood glucose, serum creatinine, and ECG QRS duration at baseline, which were potential confounders and could impact on QRS/T angle. The risk for incident HF in BBB was first evaluated with QRS/T angles as continuous variables. It was observed that the risk for frontal plane QRS/T angle started increasing approximately at the seventy-fifth percentile and that for spatial QRS/T angle at the 50th percentile. It was decided to determine the risk for HF for QRS/T angles with quartile 4 as the test group and quartiles 1 to 3 in the No-BBB as the reference group ( Supplementary Table 1 ). Hazard ratios were evaluated for increased values of ECG predictor variables (quartile 4) with quartiles 1 to 3 as the reference group (hazard ratio = 1). However, quartile 1 (decreased or more negative values) was used as the test group for T-wave amplitude and ST J-point depression in lead V 6 , with quartiles 2 to 4 as the reference group. All analyses were performed with SAS version 9.3 (SAS Institute Inc., Cary, North Carolina).
Results
The mean age at baseline was 54 years, 54.6% were women, 26.4% African-American, and 5.2% had a history of CVD or ECG evidence of myocardial infarction. BBB was present in 2.6%. Details of demographic, clinical, and ECG characteristics of the study population are summarized in Table 1 .There were statistically significant differences between the test group and reference group by spatial QRS/T angle and No-BBB group and BBB group in most of the demographic, clinical characteristics, and ECG measurements (p <0.05 or less).
| Variable | Bundle Branch Block | |||
|---|---|---|---|---|
| No | Yes | |||
| QRS/T < 75th (n = 10,576) | QRS/T ≥ 75th (n = 3,525) | QRS/T < 75th (n = 283) | QRS/T ≥ 75th (n = 94) | |
| Age (years) | 54 ± 6 | 54 ± 6*** | 56 ± 6 | 58 ± 5* |
| Body mass index (kg/m 2 ) | 28 ± 5 | 28 ± 5 | 28 ± 5 | 27 ± 4 |
| Systolic blood pressure (mm Hg) | 119 ± 17 | 126 ± 22*** | 124 ± 21 | 126 ± 20 |
| Women | 61.2% | 37.2%*** | 28.6% | 42.6%* |
| African-American | 25.4% | 29.5%*** | 27.6% | 19.2% |
| Education ≤ high school | 54.9% | 56.8%*** | 60.4% | 66.0% |
| Current smoker | 24.0% | 31.6%*** | 29.0% | 23.4% |
| Hypertension | 29.7% | 41.0%*** | 37.5% | 47.9% |
| Diabetes mellitus | 9.4% | 15.7%*** | 14.2% | 17.0% |
| History of CVD † | 3.4% | 9.5%*** | 15.9% | 22.3% |
| Antihypertensive therapy | 25.8% | 30.7%*** | 34.3% | 51.1% |
| ECG characteristics | ||||
| Spatial QRS/T angle ‡ (°) | 56 ± 18 | 107 ± 18*** | 91 ± 29 | 154 ± 10*** |
| Frontal QRS/T angle § (°) | 20 ± 17 | 41 ± 38*** | 44 ± 35 | 113 ± 49*** |
| QRS axis (°) | 33 ± 29 | 23 ± 39*** | 15 ± 51 | −4 ± 51** |
| T axis (°) | 37 ± 22 | 43 ± 48*** | 29 ± 35 | 92 ± 75*** |
| Heart rate (beats/min) | 66 ± 10 | 67 ± 11*** | 63 ± 11 | 67 ± 10** |
| QRS duration (ms) | 90 ± 9 | 95 ± 10*** | 134 ± 14 | 143 ± 16*** |
| QTa ¶ (ms) | 415 ± 16 | 417 ± 16*** | 441 ± 17 | 446 ± 17* |
| STJ-point amplitude (μV) | ||||
| Lead aVR | −24 ± 22 | −10 ± 22*** | −13 ± 22 | 15 ± 30*** |
| Lead V 1 | 2 ± 30 | 23 ± 34*** | 47 ± 45 | 117 ± 70*** |
| Lead V 6 | 22 ± 25 | 5 ± 25*** | 7 ± 28 | −17 ± 37*** |
| T-wave amplitude (μV) | ||||
| Lead aVR | −226 ± 81 | −140 ± 103*** | −206 ± 106 | −30 ± 130*** |
| Lead V 1 | 35 ± 133 | 168 ± 143*** | −19 ± 262 | 390 ± 337*** |
| Lead V 6 | 240 ± 115 | 120 ± 135*** | 199 ± 156 | −58 ± 162*** |
| ECG-LVH by CV ‖ | 0.6% | 5.7%*** | ||
| Right bundle branch block | 51.6% | 13.8%*** | ||
| Other BBB categories | 48.4% | 86.2%*** | ||
† History of cardiovascular disease (CVD) = classified by ECG evidence of myocardial infarction according to the Minnesota Code or the NOVACODE criteria or a self-reported history of a clinical diagnosis of myocardial infarction, angina pectoris, coronary artery bypass surgery, coronary angioplasty, heart failure, or stroke at the time entered study.
‡ QRS/T angle-spatial plane = spatial angle between the mean QRS and ST-T vectors.
§ QRS/T angle-frontal plane = the absolute value of the difference between frontal plane QRS axis and frontal plane T axis. Using (360° − angle) for an angle >180° (axis measurement range from −89° to +270° in the GE Marquette ECG program).
¶ QTa = QT adjusted for rate as a linear function of RR interval; QTa = QT−185 (RR−1) for women with no BBB and QTa = QT−157 (RR−1)−0.86 (QRS duration−138) for women with BBB; and add 6 ms for men both in No-BBB and BBB groups.
‖ ECG-LVH = left ventricular hypertrophy by Cornell voltage (RaVL + SV3) ≥2200 μV for women and ≥2800 μV for men with ECG QRS duration <120 ms.
The correlation between spatial and frontal plane QRS/T angle was 0.464 in the No-BBB group and 0.648 in the BBB group ( Supplementary Table 2 ). The correlations for T-wave amplitude in aVR, V 1 , and V 6 with spatial QRS/T angle were also listed, respectively.
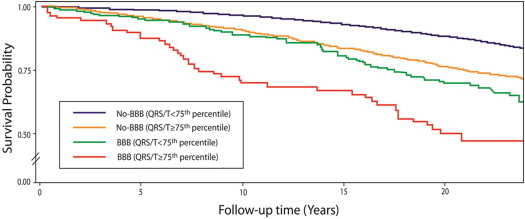
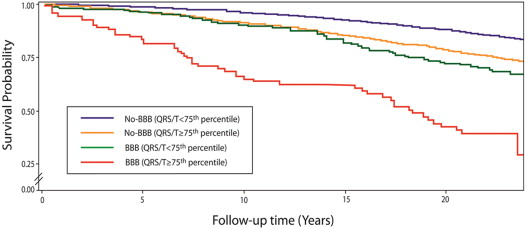
During an average of 21 years follow-up, 2,329 were hospitalized for incident HF. The event rates of incident HF for different outcomes by dichotomized QRS/T angle categories were listed in Table 2 . In multivariable adjusted models and compared with No-BBB with normal spatial QRS/T angle, BBB with normal QRS/T angle and wide QRS/T angle without BBB were associated with 48% and 51% increased risk of HF. In addition, presence of both BBB and wide spatial QRS/T angle was associated with more than threefold risk of incident HF. Similar results were observed for the frontal plane QRS/T angle. Survival curves for subgroups by dichotomized spatial QRS/T angles in No-BBB and BBB groups are shown in Figures 1 and 2 for incident HF further highlighting the trends listed in Table 2 . No interaction was observed by gender, and the results were consistent in men and women ( Table 3 ).
| N = 2,329/14,478 | Event Rate (n/N) | Hazard Ratio (95% CI) | ||
|---|---|---|---|---|
| Model-1 † | Model-2 ‡ | Model-3 § ¶ | ||
| QRS/T angle-spatial ‖ | ||||
| No-BBB (QRS/T < 75th) | 1384/10576 | 1.00 (Ref) | 1.00 (Ref) | 1.00 (Ref) |
| No-BBB (QRS/T ≥ 75th) | 822/3525 | 2.04 (1.87–2.22)*** | 1.90 (1.74–2.08)*** | 1.51 (1.37–1.66)*** |
| BBB (QRS/T < 75th) | 81/283 | 2.20 (1.76–2.76)*** | 2.00 (1.60–2.51)*** | 1.48 (1.17–1.88)** |
| BBB (QRS/T ≥ 75th) | 42/94 | 4.16 (3.06–5.66)*** | 4.23 (3.11–5.76)*** | 3.37 (2.47–4.60)*** |
| QRS/T angle-frontal ‖ | ||||
| No-BBB (QRS/T < 75th) | 1426/10568 | 1.00 (Ref) | 1.00 (Ref) | 1.00 (Ref) |
| No-BBB (QRS/T ≥ 75th) | 780/3533 | 1.65 (1.51–1.80)*** | 1.61 (1.48–1.76)*** | 1.30 (1.19–1.43)*** |
| BBB (QRS/T < 75th) | 74/282 | 1.92 (1.52–2.43)*** | 1.72 (1.36–2.18)*** | 1.31 (1.02–1.67)* |
| BBB (QRS/T ≥ 75th) | 49/95 | 4.47 (3.35–5.95)*** | 4.57 (3.42–6.11)*** | 3.35 (2.50–4.49)*** |
‡ Model 2: Adjusted for age, gender, and race.
§ Model 3: Adjusted for demographic and clinical variables of age, gender, race, region of residence, body mass index, systolic blood pressure, smoking status, education, hypertension, diabetes mellitus, cardiovascular disease status, ratio of total cholesterol/high-density lipoprotein, blood glucose, serum creatinine, and QRS duration at baseline.
¶ For interaction between gender and QRS/T angle group, overall p = 0.1048 for spatial QRS/T angle group and p = 0.5148 for frontal QRS/T angle group in the multivariable adjusted model 3.
‖ The spatial QRS/T angle at the 75th percentile cut point: ≥86° in the no-bundle branch block group, and ≥139° in bundle branch block group. The frontal QRS/T angle at 75th percentile cut point: ≥33° in the no-bundle branch block group and ≥90° in bundle branch block group.
| QRS/T angles | Events/1000 Person-Years | Hazard Ratio (95% Confidence Intervals) § | ||
|---|---|---|---|---|
| Women | Men | Women (N = 7901) | Men (N = 6577) | |
| QRS/T angle-spatial † | ||||
| No-BBB (QRS/T < 75th) | 5.9 | 7.6 | 1.00 (Ref) | 1.00 (Ref) |
| No-BBB (QRS/T ≥ 75th) | 11.1 | 15.9 | 1.45 (1.27–1.65)*** | 1.64 (1.42–1.89)*** |
| BBB (QRS/T < 75th) | 16.0 | 17.3 | 2.03 (1.36–3.02)** | 1.44 (1.05–1.95)* |
| BBB (QRS/T ≥ 75th) | 27.2 | 36.1 | 4.85 (2.72–8.67)*** | 3.17 (2.15–4.68)*** |
| QRS/T angle-frontal ‡ | ||||
| No-BBB (QRS/T < 75th) | 6.1 | 7.8 | 1.00 (Ref) | 1.00 (Ref) |
| No-BBB (QRS/T ≥ 75th) | 10.3 | 15.3 | 1.22 (1.07–1.39)** | 1.56 (1.35–1.79)*** |
| BBB (QRS/T < 75th) | 13.5 | 16.1 | 1.75 (1.14–2.68)* | 1.40 (1.03–1.90)* |
| BBB (QRS/T ≥ 75th) | 37.1 | 44.9 | 4.63 (2.79–7.70)*** | 3.29 (2.21–4.90)*** |
Stay updated, free articles. Join our Telegram channel

Full access? Get Clinical Tree


