Surgical risk scores fail to accurately predict mortality after transcatheter aortic valve implantation (TAVI). The aim of this study was to develop and validate a dedicated risk score for accurate estimation of mortality risk in these patients. All consecutive patients who underwent TAVI at 6 international institutions were enrolled. Predictors for 1-year all-cause mortality were identified by means of Cox multivariate analysis and incorporated in a prediction score. Accuracy of the score was derived and externally validated for 30-day and 1-year mortality. The net classification improvement compared with the Society of Thoracic Surgeons (STS) score was appraised. A total of 1,064 patients constituted the derivation cohort and 180 patients constituted the external validation cohort. A total of 165 patients (15%) died at 1-year follow-up. Previous stroke (odds ratio [OR] 1.80, 1.4 to 3), inverse of renal clearance (OR 8, 6 to 14), and systolic pulmonary arterial pressure ≥50 mm Hg (OR 2.10, 1.5 to 3) were independently related to 1-year mortality. Area under the curve (AUC) of the survival post TAVI (STT) for 1-year mortality was 0.68 (0.62 to 0.71). At 30 days, 65 patients (7%) had died and the AUC for the STT at this time point was 0.66 (0.64 to 0.75). In the external validation cohorts, the AUC of the STT were 0.66 (0.56 to 0.7) for 30-day and 0.67 (0.62 to 0.71) for 1-year mortality. Net reclassification improvement for STT compared with STS was 31% (p <0.001) for 30-day mortality and 14% (p <0.001) for 1-year mortality. In conclusion, the STT score represents an easy and accurate tool to assess the risk of short-term and mid-term mortality in patients undergoing TAVI.
In this study we aimed to develop and validate a scoring system for more accurate prediction of 1-year mortality in patients undergoing transcatheter aortic valve implantation (TAVI), the survival post TAVI (STT) score.
Methods
The present article is reported according to the strengthening the reporting of observational studies in epidemiology statement. Patients who underwent TAVI at 6 institutions (Turin, Catania, Padova, 2 centers in Milan, and Utrecht) constituted the derivation cohort, which has been previously analyzed for other purposes. The STT was externally validated on an independent cohort of another Institution (Bologna). All consecutive patients with severe symptomatic aortic stenosis referred for TAVI at our institutions from January 2007 to December 2012 were included. In each center, the indication for TAVI was appraised after consensus by a team of cardiac surgeons, cardiologists, and anesthetists. Coronary anatomy and hemodynamic status were assessed by coronary angiography and left heart catheterization. Valvular morphology and annulus size were evaluated with transthoracic and transesophageal echocardiography, contrast angiography of the aortic root, and multislice computed tomography of the thoracic aorta. Vascular access sites were assessed by color-Doppler sonography and multislice computed tomographic angiography of the aortoiliofemoral system. Transfemoral, transubclavian, direct aortic, and transapical procedures were performed according to the expertise of each center, with implantation of a Medtronic CoreValve (Medtronic, Minneapolis, Minnesota) or an Edwards Sapien and/or Sapien XT prosthesis (Edwards Lifesciences Corporation, Irvine, California). All preprocedural, procedural, and follow-up data were documented in local institutional databases and adverse events adjudicated according to the Valve Academic Research Consortium criteria. Death at 1 year of follow-up was the primary end point. Thirty-day all-cause mortality was the secondary end point, defined according to Valve Academic Research Consortium as mortality at 30 days after the index procedure or longer if the patient was not discharged. Categorical variables were compared with the use of Fisher’s exact test. Continuous variables, presented as means ± SD, were compared with the use of analysis of variance. Parametric distribution was checked both graphically both with Kolmogorov Smirnov. All preprocedural variables significantly associated (with a p value <0.10) for 1 year all-cause mortality were incorporated into multivariate logistic regression analysis with Hosmer-Lemeshow statistics for calibration of the model. Multicollinearity of the models was checked with tolerance and inflation statistics. For all the primary and secondary end points, predictive accuracy was tested with an area under the curve (AUC), which was also constructed for STS score and EuroSCORE (reported as absolute values and confidence interval). Moreover calibration was appraised with Hosmer-Lemeshow test. In the validation process, each patient received a risk assessment using the new developed risk score plus the 2 previously quoted surgical scores. AUCs of the scores were compared according to Hanley et al. The effects of reclassification using STT score were then assessed estimating the net reclassification improvement (NRI). The prediction model for each subject was re-estimated. Reclassification to a higher risk group was considered upward movement and/or improvement in classification for those patients experiencing all-cause mortality, whereas reclassification downward was considered a failure for patients who died. Conversely, among patients who survived, reclassification upward was considered detrimental, and reclassification downward was considered beneficial. Improvement in reclassification was then estimated by taking the sum of differences in proportions of patients reclassified upward minus the proportion reclassified downward for subjects who died of cardiovascular causes and the proportion of subjects moving downward minus the proportion moving upward for those who did not die. Using this method, the overall reclassification sum is the NRI. All data were processed using the Statistical Package for Social Sciences, version 11 (SPSS, Chicago, Illinois).
Results
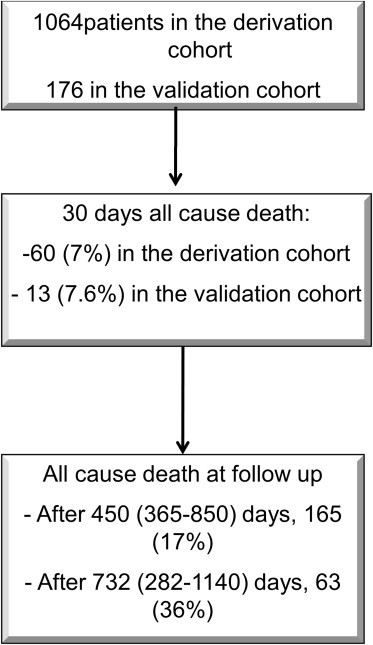
A total of 1,064 patients constituted the derivation cohort and 180 patients constituted the external validation cohort ( Figure 1 ). A total of 165 patients (15%) died at 1 year. Features with differences at univariate analysis are reported in Tables 1 and 2 .
| Alive at 1 year follow up | ||||
|---|---|---|---|---|
| Variable | No (N=165) | Yes (N=904) | p value | Odds Ratio (LCI-UCI) |
| Age (years) | 81.5±5.9 | 81.6±6.4 | 0.69 | |
| Women | 79 (64.4%) | 558 (56.0%) | 0.14 | 1.2 (0.9-1.3) |
| Non-insulin dependent diabetes mellitus ∗ | 45 (36.0%) | 286 (29.0%) | 0.17 | 1.2 (0.7-1.5) |
| Insulin dependent Diabetes mellitus ∗ | 30 (20.0%) | 84 (13.0%) | 0.09 | 1.4 (0.8-2.5) |
| Hypertension ∗ | 130 (83.0%) | 826 (83.0%) | 0.52 | 1.3 (0.8-2.1) |
| Hyperlipidemia ∗ | 70 (50.0%) | 146 (34.5%) | 0.05 | 0.6 (0.4-1.0) |
| Previous myocardial infarction | 30 (29.0%) | 192 (19.0%) | 0.21 | 1.3 (0.6-1.9) |
| Previous percutaneous coronary intervention | 43 (32.0%) | 351 (55.0%) | 0.22 | 1.1 (0.5-1.9) |
| Previous coronary bypass graft | 15 (17.0%) | 145 (16.0%) | 0.91 | 1.5 (0.5-4.1) |
| Carotid artery disease ∗ | 19 (19.0%) | 164 (25.0%) | 0.31 | 1.1 (0.6-1.9) |
| Peripheral artery disease ∗ | 45 (25.0%) | 139 (13.0%) | 0.21 | 0.9 (0.5-1.9) |
| Previous stroke | 38 (17.0%) | 111 (12.0%) | 0.02 | 2.3 (1.5-4.5) |
| Chronic obstructive pulmonary disease † | 49 (34.0%) | 128 (24.0%) | 0.08 | 1.5 (0.8-2.1) |
| Last clearance value before intervention (Glomerular Filtration Rate; mL/min/1.73 m 2 ) ‡ | 37.6±15.6 | 51.9±23.0 | <0.001 | 2.4 (1.6-3.6) |
| Logistic euroscore § | 19.3±2 | 18.3±14.1 | 0.68 | 1.1 (0.6-1.9) |
| STS score mortality ¶ | 11.1±10 | 9.4±7.9 | 0.14 | 1.5 (0.8-1.9) |
∗ According to STS (Society of Thoracic Surgeons) definition http://209.220.160.181/STSWebRiskCalc261/de.aspx .
† Evaluated according to Global Strategy for the Diagnosis, Management and Prevention of COPD: 2003 update.
‡ Cockcroft-Gault Calculator. http://nephron.com/cgi-bin/CGSIdefault.cgi .
§ http://www.euroscore.org/calc.html .
| Alive at 1 year follow up | ||||
|---|---|---|---|---|
| Variable | No (N=165) | Yes (N=904) | p value | Odds Ratio (LCI-UCI) |
| Pre procedural data | ||||
| Ejection fraction (%) | 53.6±5.8 | 52.7±13.8 | 0.73 | – |
| Mean aortic gradient (mm Hg) | 48.0±13.0 | 51.0±17.0 | 0.11 | — |
| Aortic valve insufficiency (mild, moderate and severe) | 18 (19.0%) | 223 (23.0%) | 0.37 | 1.1 (0.7-1.6) |
| Peak systolic pulmonary arterial pressure > 50 mmHg | 45 (40.0%) | 176 (25.0%) | 0.01 | 1.8 (1.3-3.8) |
| Approach | 0.52 | – | ||
| – transfemoral | 67 (59.0%) | 658 (66.0%) | ||
| – transapical | 34 (31.0%) | 226 (23.0%) | ||
| – transubclavian | 32 (10.0%) | 99 (10.0%) | ||
| Prosthesis diameter (mm) | 0.43 | – | ||
| – 23 | 30 (29.0%) | 153 (20.0%) | ||
| – 26 | 34 (48.0%) | 373 (48.0%) | ||
| – 29 | 34 (23.0%) | 216 (28.0%) | ||
| – 31 | 0 (0.0%) | 20 (2.6%) | ||
| Kind of device: | 0.6 | 0.9 (0.7-1.5) | ||
| – Corevalve | 45 (38.0%) | 394 (51.0%) | ||
| – Edwards | 48 (41.0%) | 1375 (46.0%) | ||
| Post procedural data | ||||
| Ejection fraction (%) | 55.0±13.0 | 53.0±11.6 | 0.47 | – |
| Mean aortic gradient (mm Hg) | 11.5±4.8 | 10.9±4.7 | 0.68 | – |
| Aortic valve insufficiency (mild, moderate) | 45 (33.0%) | 223 (23.0%) | 0.03 | 3.4 (1.5-40.0) |
In multivariate logistic regression analysis ( Figure 2 ) only previous stroke (odds ratio 1.80, 1.4 to 3), inverse of renal clearance (odds ratio 8, 6 to 14), and systolic pulmonary artery pressure (sPAP) ≥50 mm Hg (odds ratio 2.10, 1.5 to 3) were independently related to all-cause mortality, with a nonsignificant Hosmer-Lemeshow test (p = 0.67), whereas insulin dependent diabetes mellitus, chronic obstructive pulmonary disease (COPD), hyperlipidemia, ejection fraction, and age did not perform significantly. Multicollinearity diagnostics with tolerance statistics was excluded.
The AUC of the STT score for 1-year mortality was 0.68 (0.62 to 0.71; Figure 3 ), whereas for 30 days it was 0.66 (0.64 to 0.75, Figure 3 ). AUC for all-cause 30-day death for STS was of 0.67 (0.54 to 0.79) and for logistic EuroSCORE it was of 0.68 (0.57 to 0.81), whereas at 1-year, AUC for STS was 0.66 (0.51 to 0.73) and for logistic EuroSCORE it was 0.62 (0.54 to 0.71; Figure 4 ). STT score was superior to STS and EuroSCORE for 1-year all-cause death (p <0.001 for both) and to STS for 30 days mortality (p = 0.045), although not for EuroSCORE (p = 0.57).
For all scores and end point, Hosmer-Lemeshow test resulted as nonsignificant.
In the external validation cohorts, 13 (7.6%) patients died at 30 days and 63 (36%) after a follow-up of 732 (282 to 1,140) days ( Tables 3 and 4 ). AUCs of STT score were of 0.66 (0.56 to 0.7) and of 0.67 (0.62 to 0.71, all confidence interval of 95%; Figures 5 and 6 ). AUC for all-cause death at 30 days was of 0.45 for STS (0.3 to 0.61) and of 0.48 for logistic EuroSCORE (0.37 to 0.65), whereas at 1 year it was of 0.61 for STS (0.52 to 0.79) and of 0.53 for logistic EuroSCORE (0.52 to 0.69) on the derivation cohort. Similarly STT was significantly superior to both of them at 1-year follow-up, whereas no difference was found at 30 days.
| Alive at 1 year follow up | ||||
|---|---|---|---|---|
| Variable | No (N=63) | Yes (N=114) | p value | Odds Ratio (LCI-UCI) |
| Age (years) | 82.5±6.8 | 80.3±7.3 | 0.69 | |
| Women | 36 (57.0%) | 57 (67.0%) | 0.42 | 1.5 (0.7-1.4) |
| Non-insulin dependent diabetes mellitus | 13 (20.0%) | 25 (22.0%) | 0.23 | 1.5 (0.7-1.9) |
| Insulin dependent Diabetes mellitus | 53 (84.0%) | 98 (96.0%) | 0.89 | 1.3 (0.7-3.9) |
| Hypertension | 37 (58.0%) | 77 (68.0%) | 0.13 | 0.6 (0.3-1.3) |
| Hyperlipidemia | 18 (26.0%) | 35 (21.0%) | 0.43 | 2.5 (0.7-1.9) |
| Previous myocardial infarction | 18 (28.0%) | 49 (43.0%) | 0.03 | 0.45 (0.3-0.9) |
| Previous percutaneous coronary intervention | 9 (14.0%) | 15 (33.0%) | 0.51 | 1.2 (0.3-1.9) |
| Previous coronary bypass graft | 10 (16.0%) | 31 (27.0%) | 0.06 | 1.5 (0.4-1.9) |
| Carotid artery disease ∗ | 19 (31.0%) | 27 (34.0%) | 0.23 | 0.3 (0.2-1.9) |
| Peripheral artery disease ∗ | 3 (4.8%) | 4 (4.5) | 0.59 | 4.5 (0.5-5.6) |
| Previous stroke | 19 (30.0%) | 26 (23.0%) | 0.45 | 1.4 (0.5-4.5) |
| Chronic obstructive pulmonary disease † | 47.0±9.0 | 56.0±23.0 | 0.008 | 2.3 (1.3-3.7) |
| Last clearance value before intervention (Glomerular Filtration Rate; mL/min/1.73 m 2 ) ‡ | 23.0±17.0 | 22.0±12.0 | 0.67 | 1.6 (0.5-4.5) |
| Logistic euroscore § | 8.4±7.1 | 10.4±5.4 | 0.45 | 1.6 (0.9-1.9) |
| STS score mortality ¶ | ||||
∗ According to STS (Society of Thoracic Surgeons) definition http://209.220.160.181/STSWebRiskCalc261/de.aspx .
† Evaluated according to Global Strategy for the Diagnosis, Management and Prevention of COPD: 2003 update.
‡ Cockcroft-Gault Calculator http://nephron.com/cgi-bin/CGSIdefault.cgi .
§ http://www.euroscore.org/calc.html .
Stay updated, free articles. Join our Telegram channel

Full access? Get Clinical Tree


