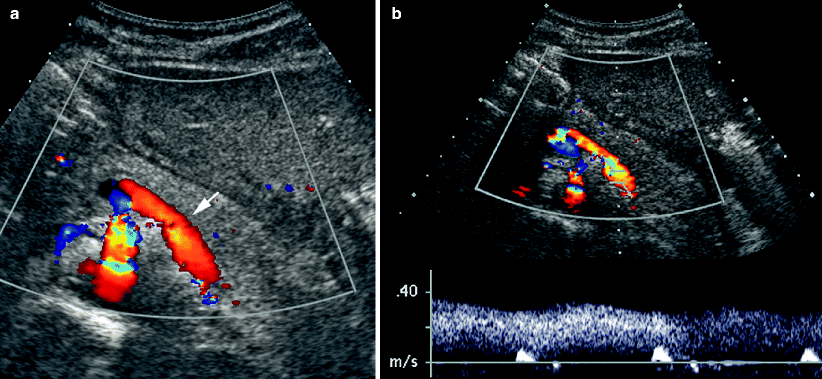
is normally 0.55–0.70 (Fig. 46.1) [7].
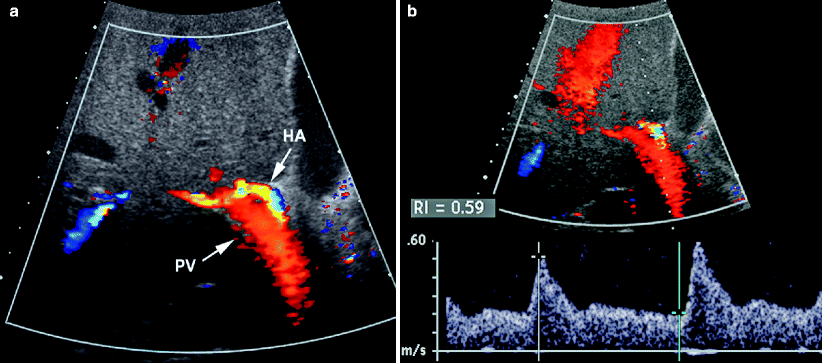
Fig. 46.1
Hepatic artery waveform. (a) Color Doppler image of porta hepatis demonstrating high flow in the hepatic artery (arrow, HA) adjacent to the portal vein (arrow, PV), which has slower flow. (b) Spectral waveform from the hepatic artery showing low resistance arterial flow with a resistive index of 0.59
Portal Veins
In normal patients, the portal veins provide 70–75% of the hepatic blood supply. The main portal vein is formed by the confluence of the splenic vein and the superior mesenteric vein in the mid epigastrium, posterior to the pancreas. It travels into the liver at the porta hepatis, and then branches into the right and left portal veins. The right portal vein branches further into anterior and posterior branches shortly after the main portal vein bifurcation. (Fig. 46.2). Variations of this anatomy are common, seen in about 35% of patients. The most common variant is trifurcation of the main portal vein into the right posterior, right anterior, and left portal veins, with other variants including bifurcation of the main portal vein into the right posterior branch and a common trunk for the right anterior branch and the left portal vein. The portal vein and its branches are considerably larger than the hepatic arteries. As a result, the main portal vein and its branches can be seen farther out into the liver parenchyma with grayscale imaging than the hepatic arteries [8].
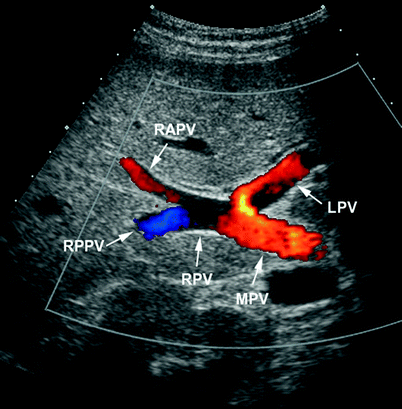

Fig. 46.2
Main portal vein and its branches. Color Doppler sonogram of the porta hepatis showing the main portal vein (arrow, MPV), branching into the left portal vein (arrow, LPV) and right portal vein (arrow, RPV), as well as bifurcation of the right portal vein into anterior (arrow, RAPV) and posterior (arrow, RPPV) branches
Normal Doppler waveform of the portal veins demonstrates continuous antegrade flow toward the liver with a mildly undulating pattern. Flow is affected by respiration and cardiac pulsatility, although the effect is normally mild. The mean velocity in the portal vein is typically 15–30 cm/s, while the peak velocity has a broad range of normal from 15 to 40 cm/s. In general, variations in velocities in the main portal vein are small, with the lowest velocity measuring more than half the highest velocity. That is,
 (Fig. 46.3) [7, 9, 10].
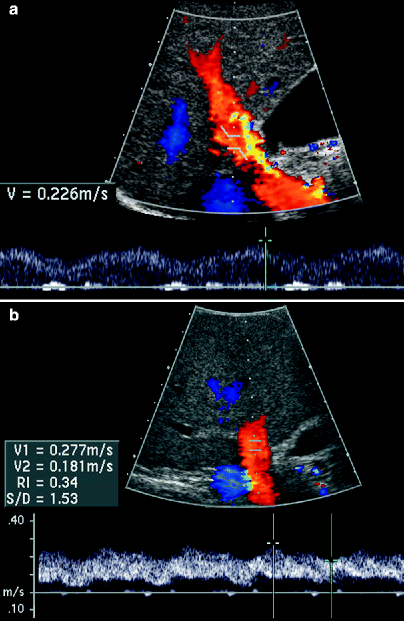


Fig. 46.3
Portal vein waveform. (a) Color and spectral Doppler sonogram of the main portal vein, demonstrating continuous, antegrade, mildly undulating flow into the liver with a peak velocity of 22.6 cm/s. (b) Portal Doppler waveform showing mild pulsatility with the lowest velocity (18.1 cm/s) measuring >0.5 times the peak velocity (27.7 cm/s)
Hepatic Veins
The hepatic veins drain all the blood from the liver into the inferior vena cava. That is, all the blood entering the liver through the portal vein and hepatic arteries is drained through the hepatic veins directly into the inferior vena cava. Three main hepatic veins are typically present: the left, middle, and right. The left hepatic vein travels between the medial and lateral segments of the left lobe of the liver. The middle hepatic vein courses between the right and left lobes of the liver, and the right hepatic vein courses between the anterior and posterior segments of the right lobe (Fig. 46.4). Variations of hepatic venous anatomy are common, with an additional right inferior hepatic vein in some patients and merging of the middle and left hepatic veins into a single vessel in others [11].
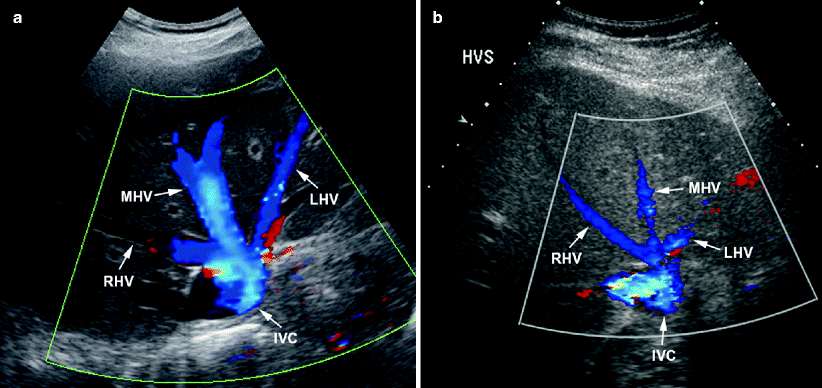

Fig. 46.4
Hepatic veins. (a) and (b) Color Doppler sonograms of liver demonstrating flow in left (arrow, LHV), middle (arrow, MHV), and right (arrow, RHV) hepatic veins as they converge into the inferior vena cava (arrow, IVC)
Normal hepatic veins have a multiphasic pattern during the cardiac cycle, with flow predominantly away from the liver and toward the heart except during short segments of the cycle. Starting with atrial systole, the first part of the hepatic vein waveform is typically retrograde, or back into the liver, as a result of increased pressure in the right atrium as the atrium contracts. This is termed the A-wave. In some patients, the A-wave is not retrograde, but rather has markedly diminished antegrade flow compared to the rest of the waveform. After atrial systole is ventricular systole, during which blood is propelled out of the heart into the great arteries. In addition, the tricuspid valve is drawn into the right ventricle, increasing negative pressure in the atrium, drawing blood back to the heart. During ventricular systole, the hepatic vein waveform demonstrates flow toward the inferior vena cava and is called the S-wave. Flow is maximal toward the heart during this portion of the cardiac cycle. Toward the end of systole, the tricuspid valve shifts away from the right ventricle. During this period, the hepatic waveform usually demonstrates a decrease in flow velocity toward the heart, or even a bit of reversed flow away from the heart, making the V-wave. Lastly, during diastole, the tricuspid valve is open, and the atria and ventricles fill with blood. The hepatic waveform during this part of the cycle is called the D-wave and characteristically demonstrates antegrade flow with velocities almost as great as during cardiac systole (Fig. 46.5) [11].
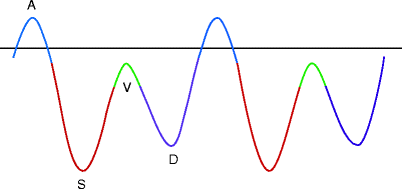

Fig. 46.5
Hepatic venous waveform. Diagram demonstrating the components of the multiphasic hepatic venous waveform. Flow below the baseline is toward the heart away from the liver. Flow above the baseline is away from the heart back toward the liver. The blue A-wave is seen during atrial systole, the red S-wave during ventricular systole, and the purple D-wave during diastole. The green V-wave is a transitional wave between ventricular systole and diastole, when flow decreases and the tricuspid valve shifts into the right atrium
The multiphasic pattern of hepatic venous flow is sometimes considered to have four components, the A-wave, V-wave, S-wave, and D-wave, and is sometimes called triphasic. The latter term is used by those who consider the V-wave to be a transitional period and not its own wave. No matter which term is used to characterize the waveform, it is important to recognize the normal appearance of the hepatic venous waveform in order to identify abnormalities of flow in these vessels (Fig. 46.6) [11].
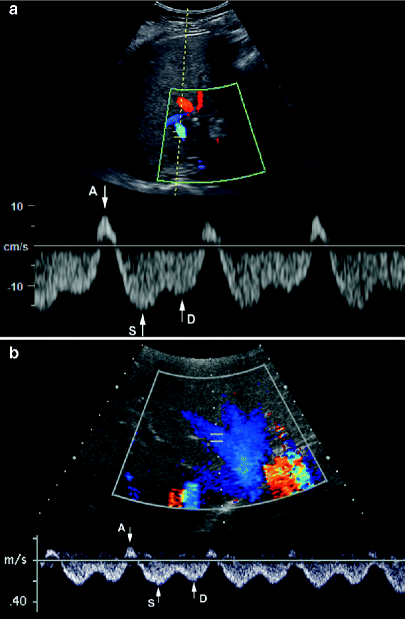

Fig. 46.6
Hepatic vein waveforms. (a) and (b) Color and spectral Doppler of the hepatic vein, demonstrating normal multiphasic flow with the A-wave (arrow, A), S-wave (arrow, S), and D-wave (arrow, D). The V-wave, defined by some as a separate wave, is the depression between the S- and D-waves
The hepatic venous waveform is affected by respiration. In particular, during inspiration and Valsalva, the multiphasic waveform may become monophasic, or flattened, with diminished flow toward the heart. Thus, it is best to assess the hepatic veins at end expiration or during quiet respiration. Because of this, imaging and Doppler acquisition may be difficult because the scan should not be performed with the patient in suspended respiration after taking a deep breath. Intercostal views may be necessary, as the subcostal approach may not be adequate [11].
Role of Doppler in Assessment of the Liver
Color and spectral Doppler are used in conjunction with grayscale imaging of the liver to identify blood vessels in the liver and assess the vessels for presence and direction of flow. In addition, Doppler is used to evaluate the dynamics of flow within the vessel [11]. Diseases of the liver alter the parenchyma, which in turn, alters blood flow in the arteries and veins leading into the liver, within the liver, and exiting the liver [7]. Thus, Doppler studies should be performed to help determine if the liver parenchyma is abnormal. Once the presence of liver disease has been established, Doppler is used to help determine the severity of disease and to monitor progression [12].
Common indications for liver Doppler are listed in Table 46.1. The most common indication is suspected or known portal hypertension. These patients are monitored closely to detect changes in portal venous flow and to look for the development of collateral vessels. Patients with known or suspected liver disease, such as cirrhosis or hepatitis B or C, may benefit from Doppler studies, because the Doppler assessment may provide information about the severity of disease. Doppler is also an important tool for monitoring the progression of these diseases to determine when intervention is necessary. In addition to the indications above, patients with systemic diseases, such as hypercoagulability and atherosclerosis, may develop abnormalities of the vessels entering or exiting the liver, leading to damage to the liver.
Table 46.1
Indications for performing liver Doppler
Portal hypertension |
Abnormal liver function tests |
Hepatitis B |
Hepatitis C |
Cirrhosis |
Metastatic disease in the liver |
Suspected veno-occlusive disease after hematopoietic stem cell transplantation |
Trauma |
Hypercoagulable state |
Gastrointestinal bleed |
Abnormalities of the Hepatic Artery
Altered blood flow in the hepatic artery typically results from one of two pathologic processes, arterial stenosis, or hepatic parenchymal disease. The most common site of atherosclerotic disease affecting blood flow in the hepatic artery is in the celiac artery near its origin from the aorta. A stenosis of 70% or greater in the celiac axis is considered hemodynamically significant and can lead to diminished blood flow to the liver through the hepatic artery. The diagnosis of celiac stenosis is made with spectral Doppler when the peak systolic velocity measures greater than 200 cm/s in the celiac artery (Fig. 46.7). Additional findings with celiac stenosis may include an abnormal tardus-pardus waveform in the main hepatic artery [13, 14].
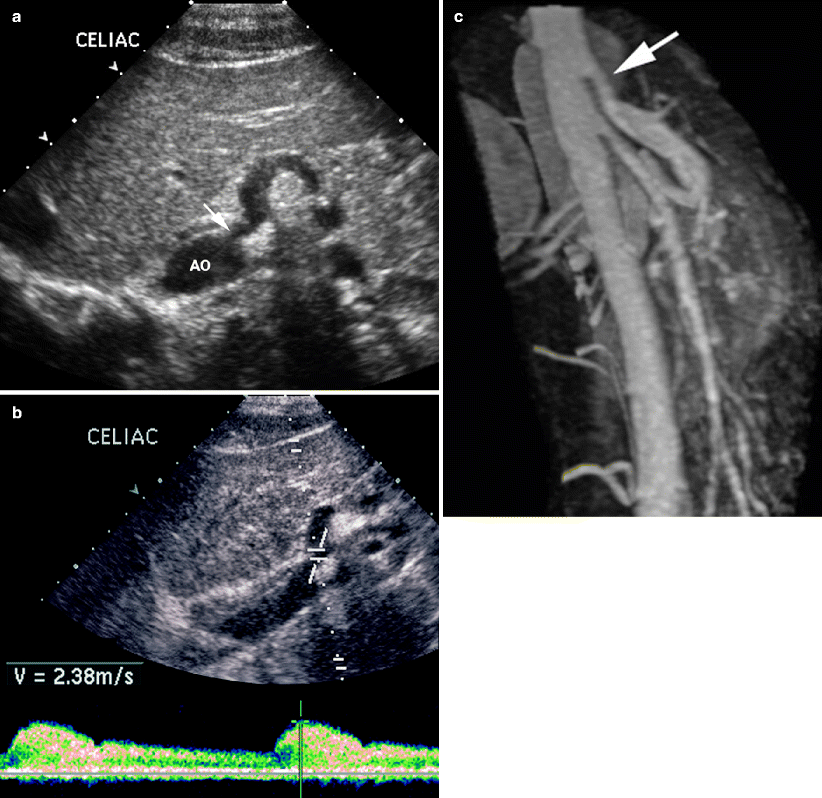

Fig. 46.7
Celiac artery stenosis. (a) Transverse sonogram demonstrating stenosis (arrow) at the origin of celiac artery from the aorta. (b) Sagittal midline image of celiac origin from aorta with spectral Doppler showing elevated velocity of 238 cm/s, indicative of stenosis. (c) Sagittal midline magnetic resonance angiogram of abdominal aorta and its branches showing celiac stenosis at its origin (arrow)
Liver parenchymal disease and liver congestion may cause increased vascular resistance in the liver. The increased resistance is reflected in the hepatic artery waveform as diminished diastolic flow and an elevated Doppler resistive index measuring >0.70 (Fig. 46.8). Common pathologies associated with an elevated resistive index in the hepatic artery include cirrhosis, acute hepatitis, metastatic disease, congestive heart failure, and hepatic vein obstruction.
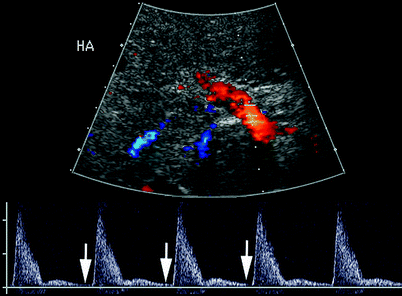

Fig. 46.8
High resistance hepatic artery flow. Color Doppler sonogram with spectral waveform below of the hepatic artery in a patient with cirrhosis, demonstrating almost no end diastolic flow (arrows), indicative of high resistance to arterial inflow
A few rare entities may lead to an abnormally low resistive index in the hepatic artery that measures <0.55. Such entities include vascular malformations with arteriovenous shunting, arteriovenous or arterioportal shunt, and significant stenosis of the celiac artery or the hepatic artery.
Abnormalities of the Portal Venous System
Altered Portal Venous Hemodynamics
The normal portal venous waveform demonstrates continuous antegrade flow toward the liver with mild respiratory variation and mild cardiac pulsatility. Abnormalities of flow in the main portal vein include increased flow, diminished flow, to-and-fro flow, reversed flow, absent flow, and exaggerated cardiac pulsatility (Fig. 46.9). Each of these abnormalities may indicate one of several pathologic states (Table 46.2) [1, 7]. When abnormal blood flow is detected in the main portal vein, assessment of the portal vein branches is important to determine the distribution or extent of the abnormality. Flow direction and waveform characteristics should be assessed in the three main branches of the main portal vein, the right posterior, right anterior, and left portal veins.
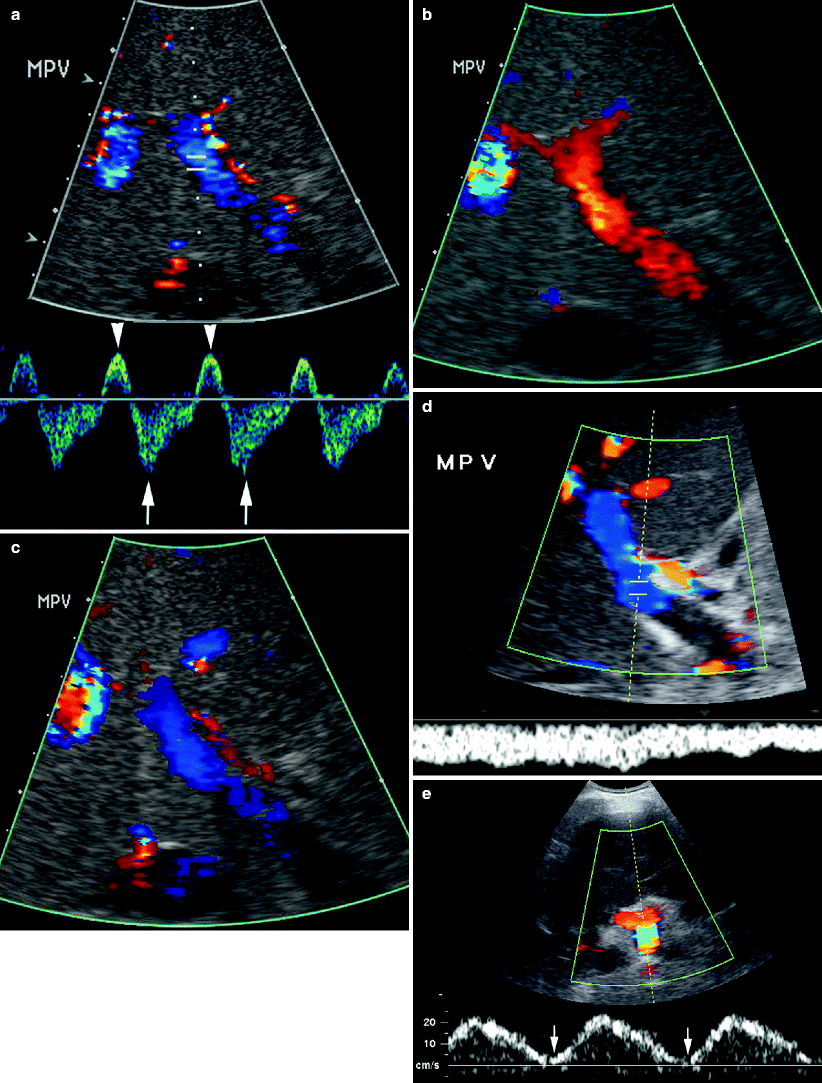

Fig. 46.9
Abnormal portal vein waveforms. (a) To-and-fro flow in the main portal vein in a patient with tricuspid regurgitation is seen in the spectral waveform below the color Doppler sonogram. The waveform shows antegrade flow toward the liver (arrowheads) and retrograde flow away from the liver (arrows) during each cardiac cycle. (b, c) Color Doppler sonogram of portal vein showing (b) antegrade flow toward the liver in red and (c) retrograde flow away from the liver in blue, during the cardiac cycle. (d) Reversed flow in the portal vein in another patient shown in the color Doppler sonogram as blue in the portal vein and on the spectral waveform as flow below the baseline. (e) Exaggerated cardiac pulsatility in another patient with congestive heart failure, demonstrating markedly diminished portal vein flow (arrow) during part of each cardiac cycle
Table 46.2
Causes of altered blood flow in the main portal vein
Abnormal flow pattern | Pathology |
|---|---|
Increased portal venous flow | Intrahepatic portosystemic shunt |
Portal-to-hepatic vein shunt | |
TIPS | |
Recanalized umbilical vein | |
Portosystemic shunt to coronary vein | |
Diminished portal venous flow | Portal hypertension |
Hepatic congestion | |
Metastatic disease | |
Hepatic vein thrombosis | |
To-and-fro portal venous flow | Portal hypertension |
Arterioportal shunting with cirrhosis | |
Hepatic congestion | |
Metastatic disease | |
Reversed portal venous flow | Portal hypertension |
Arterioportal shunting with cirrhosis | |
Hepatic congestion | |
Metastatic disease | |
Absent portal venous flow | Portal hypertension |
Hepatic congestion | |
Metastatic disease | |
Hypercoagulable state | |
Splenic vein thrombosis | |
Tumor in the portal vein | |
Exaggerated cardiac pulsatility | Congestive heart failure |
Tricuspid regurgitation | |
Arterioportal shunting with cirrhosis |
Because each type of altered blood flow pattern may be seen with several different pathologic processes, and because some pathologic processes may manifest one of several patterns of altered portal venous flow, we discuss various disease entities and describe how Doppler is used to diagnose and monitor these diseases.
Portal Hypertension
Portal hypertension is defined as increased pressure in the portal vein such that the pressure gradient between the portal vein and the inferior vena cava is 12 mmHg or greater [5]. Portal hypertension can develop from presinusoidal pathologies, such as sarcoidosis, lymphoma, or schistosomiasis, or from postsinusoidal pathologies, such as cirrhosis, hepatic vein thrombosis (Budd-Chiari syndrome), or veno-occlusive disease after bone marrow transplantation. Rarely, portal hypertension develops from extrahepatic diseases, such as prehepatic portal vein compression or posthepatic hepatic vein or inferior vena cava obstruction [4, 5, 15].
The most common cause of portal hypertension is liver cirrhosis. Cirrhosis may result from a number pathologies affecting the liver (Table 46.3), the most common being alcoholism and chronic active hepatitis B [16]. Cirrhosis is liver parenchymal fibrosis that results from a chronic insult to the liver that causes cell damage and death, and the damaged cells are then replaced by fibrosis. The fibrotic liver parenchyma causes increased vascular resistance, which leads to elevated pressure in the portal veins and, thus, portal hypertension.
Table 46.3
Causes of cirrhosis and portal hypertension
Alcohol consumption |
Hepatitis B infection |
Hepatitis C infection |
Steatohepatitis |
Chronic congestive heart failure |
Cystic fibrosis |
Bile duct destruction or primary biliary cirrhosis |
Sclerosing cholangitis |
Congenital biliary atresia |
Hemochromatosis |
Wilson’s disease (copper storage disease) |
Glycogen storage disease |
Autoimmune hepatitis |
The sonographic evaluation for portal hypertension starts with grayscale imaging of the liver to locate and assess the diameter of the main portal vein in the porta hepatis and the parenchyma of the liver. Signs of cirrhosis in the liver include coarse hepatic parenchyma, nodular liver contour, enlargement of the left and caudate lobes and a small right lobe, and focal masses. Extrahepatic signs include ascites and splenomegaly. Doppler assessment begins with the portal confluence to document presence and direction of flow in the splenic vein (Fig. 46.10). Next, flow should be assessed in the main portal vein with color and spectral Doppler, to determine flow direction and mean and peak velocities. Flow direction should be assessed in the anterior and posterior branches of the right portal vein and in the left portal vein. Lastly, a careful search for collateral vessels should be performed, using grayscale and color Doppler, to look for a recanalized umbilical vein, coronary vein collaterals, and varices around the gallbladder or in the region of the gastroesophageal junction [4, 7].

